
Square
Following
Hot
News
Profile
Share your thoughts
placeholder
Article
( new streamer) market overview
live-cover
LIVE67
Does a bullish moving-average alignment always mean you should chase long positions?
Not necessarily. The key is whether the price’s position relative to the moving averages is synchronized with momentum. Take $ZEC as an example: the current price is 1235.97, with MA5=1225.24 above MA20=1138.62, forming a standard bullish alignment and indicating a healthy trend direction; however, RSI has reached 70.2, nearing overbought territory, while the price is hugging the Bollinger upper band at 1248.36, making the risk-reward of chasing short-term highs unattractive. A reusable approach is: use movin
post-image
ZEC+9.33%
XPL+6.22%
INJ+11.20%
🔴 Strategy (MSTR) could be excluded from major MSCI indices (such as the MSCI USA, MSCI World, or MSCI ACWI) starting in late November 2026.
MSCI is one of the largest index providers in the world. Thousands of billions of dollars are invested in funds that automatically track these indices. If a stock is removed, these funds are required to sell it.
This is not yet certain: MSCI has introduced “buffers” to limit abrupt changes. A company already in the index, such as Strategy, will only be removed if it fails to meet the new criteria for two consecutive years. The final list of affected secu
post-image
MSTR+5.58%
MSCI+2.49%
$RENDER took decisive action, so the account performed better. This is a good reason to exit. Profits have been locked in. My daily watchlist: $BAT and $ETH .
post-image
RENDER+3.13%
BAT+28.99%
ETH+1.67%
$MARSCOIN is currently in a high-volatility, weak-trend phase. Conclusion first: short-term bias is bearish; chasing longs is not recommended. If it rebounds to around 0.0782, a small short position may be cautiously attempted, but a hard stop-loss must be used.
The reasoning is as follows. MARSCOIN is currently at 0.0772, down 5.04% over 24h, with the amplitude over 30 candles reaching as high as 15.93%. Its volatility is significantly higher than BTC's 3.44%, making it a typical high-risk asset. In terms of moving averages, MA5=0.07824 remains above MA20=0.07621, so the apparent bullish ali
post-image
MARSCOIN-6.36%
BAT+28.99%
BTC+0.94%
If I could leave just one note for $FIL today, it would be: don’t let +7.87% make the decision for you.
What’s really worth discussing is that $FIL remains strong, while the crowded trade is already out in the open. $FIL is currently at 1.172, up +7.87% over 24 hours. The 1-hour support is 0.9999, resistance is 1.1774, and current volume is 0.61 times the average volume of nearly 20 bars.
The 1-hour trend is strong, with RSI at 78; the 4-hour trend is strong, with RSI at 56. This combination makes me temporarily accept the following interpretation: I acknowledge that the trend is strong, but
post-image
FIL+8.74%
Range-bound SKHYNIX is about to break out and most traders are positioned the wrong way.

$SKHYNIX /USDT - SHORT

Trade Plan:
Entry: 971.37 – 978.79
SL: 1010.69
TP1: 948.37
TP2: 930.56
TP3: 903.85

Why this setup?
Why now? The daily trend is range, but the 1h ATR of 14.839521 signals a squeeze is building inside that range. The 15m RSI at 58.85 shows momentum is not yet exhausted, so a short entry near 975.08 is valid as long as we stay below 978.79. TP1 at 948.37 and TP2 at 930.56 define the first two targets on the path down, while the invalidation level of 1156.63 is the hard line that w
SKHYNIX-4.15%
An unpopular take: $INJ ’s current +10.99% gain is not as conclusive as it looks.
$INJ is currently at 8.423, up +10.99% over 24 hours. The 1-hour support is 7.061, resistance is 8.562, and current volume is 0.77 times the average volume of the past 20 periods. What is truly useful in these numbers is where 7.061 and 8.562 are containing the range.
This is where I currently stand: I acknowledge that the trend is strong, but what matters next is not how much higher it can surge, but whether buyers step in during the first pullback. The 1-hour trend is strong, with an RSI of 86; the 4-hour trend
post-image
INJ+11.20%
Gold has climbed back above 4150, while silver is hovering around 57. The dollar has weakened, and Treasury yields have pulled back a bit too.
But don’t celebrate too soon. Oil prices are still rising, and inflation hasn’t gone anywhere. This rebound looks more like a breather than a turnaround.
What I’m watching is whether gold can hold above 4150 if oil surges again next week.
If you see it differently, tell me why.
post-image
GLDX+1.91%
PAXG+1.38%
HYPERLIQUID $HYPE REJECTING MOVING AVERAGE RESISTANCE ARE BEARS TARGETING $78.06 NEXT?
Pair: $HYPE /USDT
Direction: SHORT
Entry Price: 81.62
Target Levels (Take Profit)
TP 1: 79.48 2.62%
TP 2: 78.06 4.36%
Stop Loss
SL: 84.47
Technical Breakdown
HYPE ($81.565) faced strong sell-side rejection following an impulsive upward push, printing a topping wick right at overhead structural resistance. This price action confirms persistent seller defense and sets up a clean continuation toward lower targets.
Price action tested areas above short-term moving averages before meeting heavy distribution
HYPE+1.72%
This is not a game... ✅️
Everything is fine!
🔥🐶🔥
Bullish on $SOCKS
post-image
XAUUSD LIVE TRADING
live-cover
LIVE282
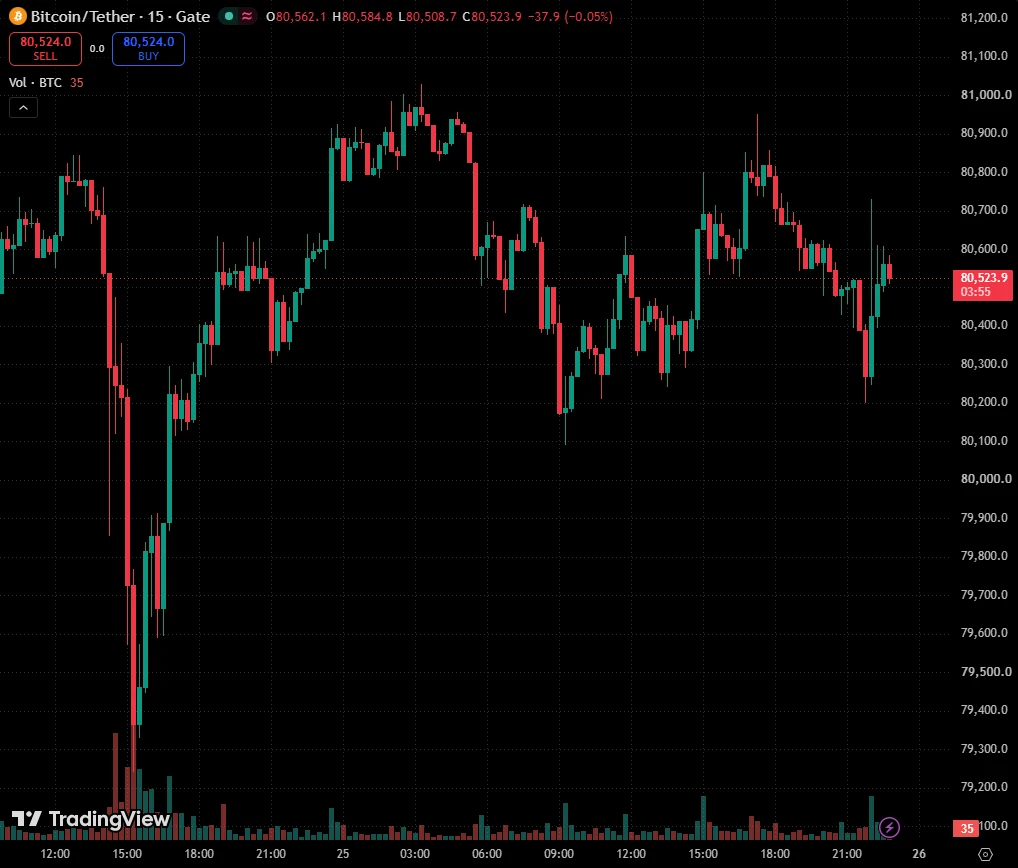
I’ve been watching $81K on Bitcoin. This week it tested that level, and then some.
On Tuesday, Korean stocks fell 5.5%. Bitcoin dipped to about 81,040 on Gate, then climbed back above $83K within hours. On Wednesday evening it slid again, and that drop has the heaviest volume on my chart. It fell to around 81.6K.
The 24h low on Gate now shows 79,795. So at some point in the last day it went under my line. Right now it’s back around 82.3K.
I can’t see that dip on the candles I’m looking at, so I don’t know how long it stayed down or how fast it came back.
My read: the line didn’t hold cleanly,
post-image
BTC+0.94%
Silver surges! From 55.5 to 57.6. Completed ✅ target 1, up 3.8%. Short sellers, keep it up 💪 Dump it down with all kinds of selling pressure so I can go long lower 🤭 #XAG $XAG
post-image
飞鱼2026祝福版
Latest Silver Strategy!!!
XAGUSD+0.04%
Continue adding to long positions on $DASH here. 💪Entry range: 49.57 - 49.82Target profit 1: 52.10Target profit 2: 54.02Invalidation level: 48.08DASH is showing strong recovery momentum and has reclaimed the 1-hour MA99 resistance at 50.01. The 15-minute chart remains clearly bullish above the MA7 and MA25, so the current setup favors an attempted breakout, targeting the 50.50 liquidity zone. Trade 👇👇👇 hereHot coins: $SIREN : Current price 0.03206 - 24-hour gain: +44.09%$SOL : Current price 105.91 - 24-hour gain: +1.07%
post-image
DASH+1.92%
SIREN+7.18%
SOL+1.25%
$OP
This move is pushing from 0.1397 toward 0.1418, up more than 13% over the past 7 days, while open interest is piling up as longs keep adding and driving it higher🚀 The wildest part is that shorts are effectively paying to stay in, having to hold on while funding remains negative. The pressure isn’t a bad thing—it’s an early-entry position. Break through 0.1418 and jump aboard.
post-image
OP+0.27%
Careful, @crocat_x is an impersonator and most likely a rug!
Report.
The official crocat:native X is @CroCat_Token with CA 0x7Eb480c734eC5f6bd2B918F7393b59D59913DFFA
This is a good reminder as Cronos is getting more succesful, rugs and rats are also coming back.
Invest with eyes open, very easy to run in to these!
post-image
CRO+0.24%
first got my 1000x shorts liquidated then my 1000x longs
post-image
10.16 $BNB Strategy chart 1 is the BNB 4-hour candlestick chart, and chart 2 is the BNB hourly candlestick chart.
From the larger timeframe in chart 1, we can see that BNB has touched the lower major ascending trendline today, namely the positions at 10 a.m. and 10 p.m. on October 15, corresponding to 708 and 712, respectively. Given the very obvious signs of price control in BNB recently, when BTC falls and ETH falls, BNB can always recover its price after falling.
If the broader market continues to make new lows in the near term, BNB is very likely to break below this 4-hour ascending trend
BNB+0.33%
Load More

Join 40 M users in our growing community

⚡️ Join 40 M users in the crypto craze discussion

💬 Engage with your favorite top creators

👍 See what interests you

Trending Topics

USSeptemberPPIBeatsExpectations

91.35k Views1.88k Discussing

US September PPI came in at 6.3% YoY, well above the 5.3% market expectation, pointing to renewed producer-side inflation pressure. Weekly jobless claims were 199K, broadly in line with forecasts. Could hotter inflation further reduce room for rate cuts, and what does it mean for $BTC, US stocks, and gold?

DrLinHanSpeaksAtOxfordUnion

135.63k Views1.86k Discussing

JapanAndKoreaStocksPlunge

47.27k Views1.76k Discussing

View More