Square
Following
Hot
News
Profile
Share your thoughts
placeholder
Article
#每周来晒 #美股财报季
The latest earnings-season debate is becoming more interesting than a simple question of who beat Wall Street expectations. In my view, the real battle among the Magnificent Seven is about who can transform artificial intelligence investment into sustainable revenue, stronger operating margins, and reliable free cash flow.
Investors are no longer satisfied with ambitious AI announcements. They want measurable results, and the market reaction to earnings shows how quickly sentiment can change when spending rises faster than confidence in future returns.
1. The Magnificent Seven: S
NVDA-0.60%
MSFT+0.56%
GOOGL-1.21%
AMZN-0.97%
AAPL-0.17%
  • 3
  • 1
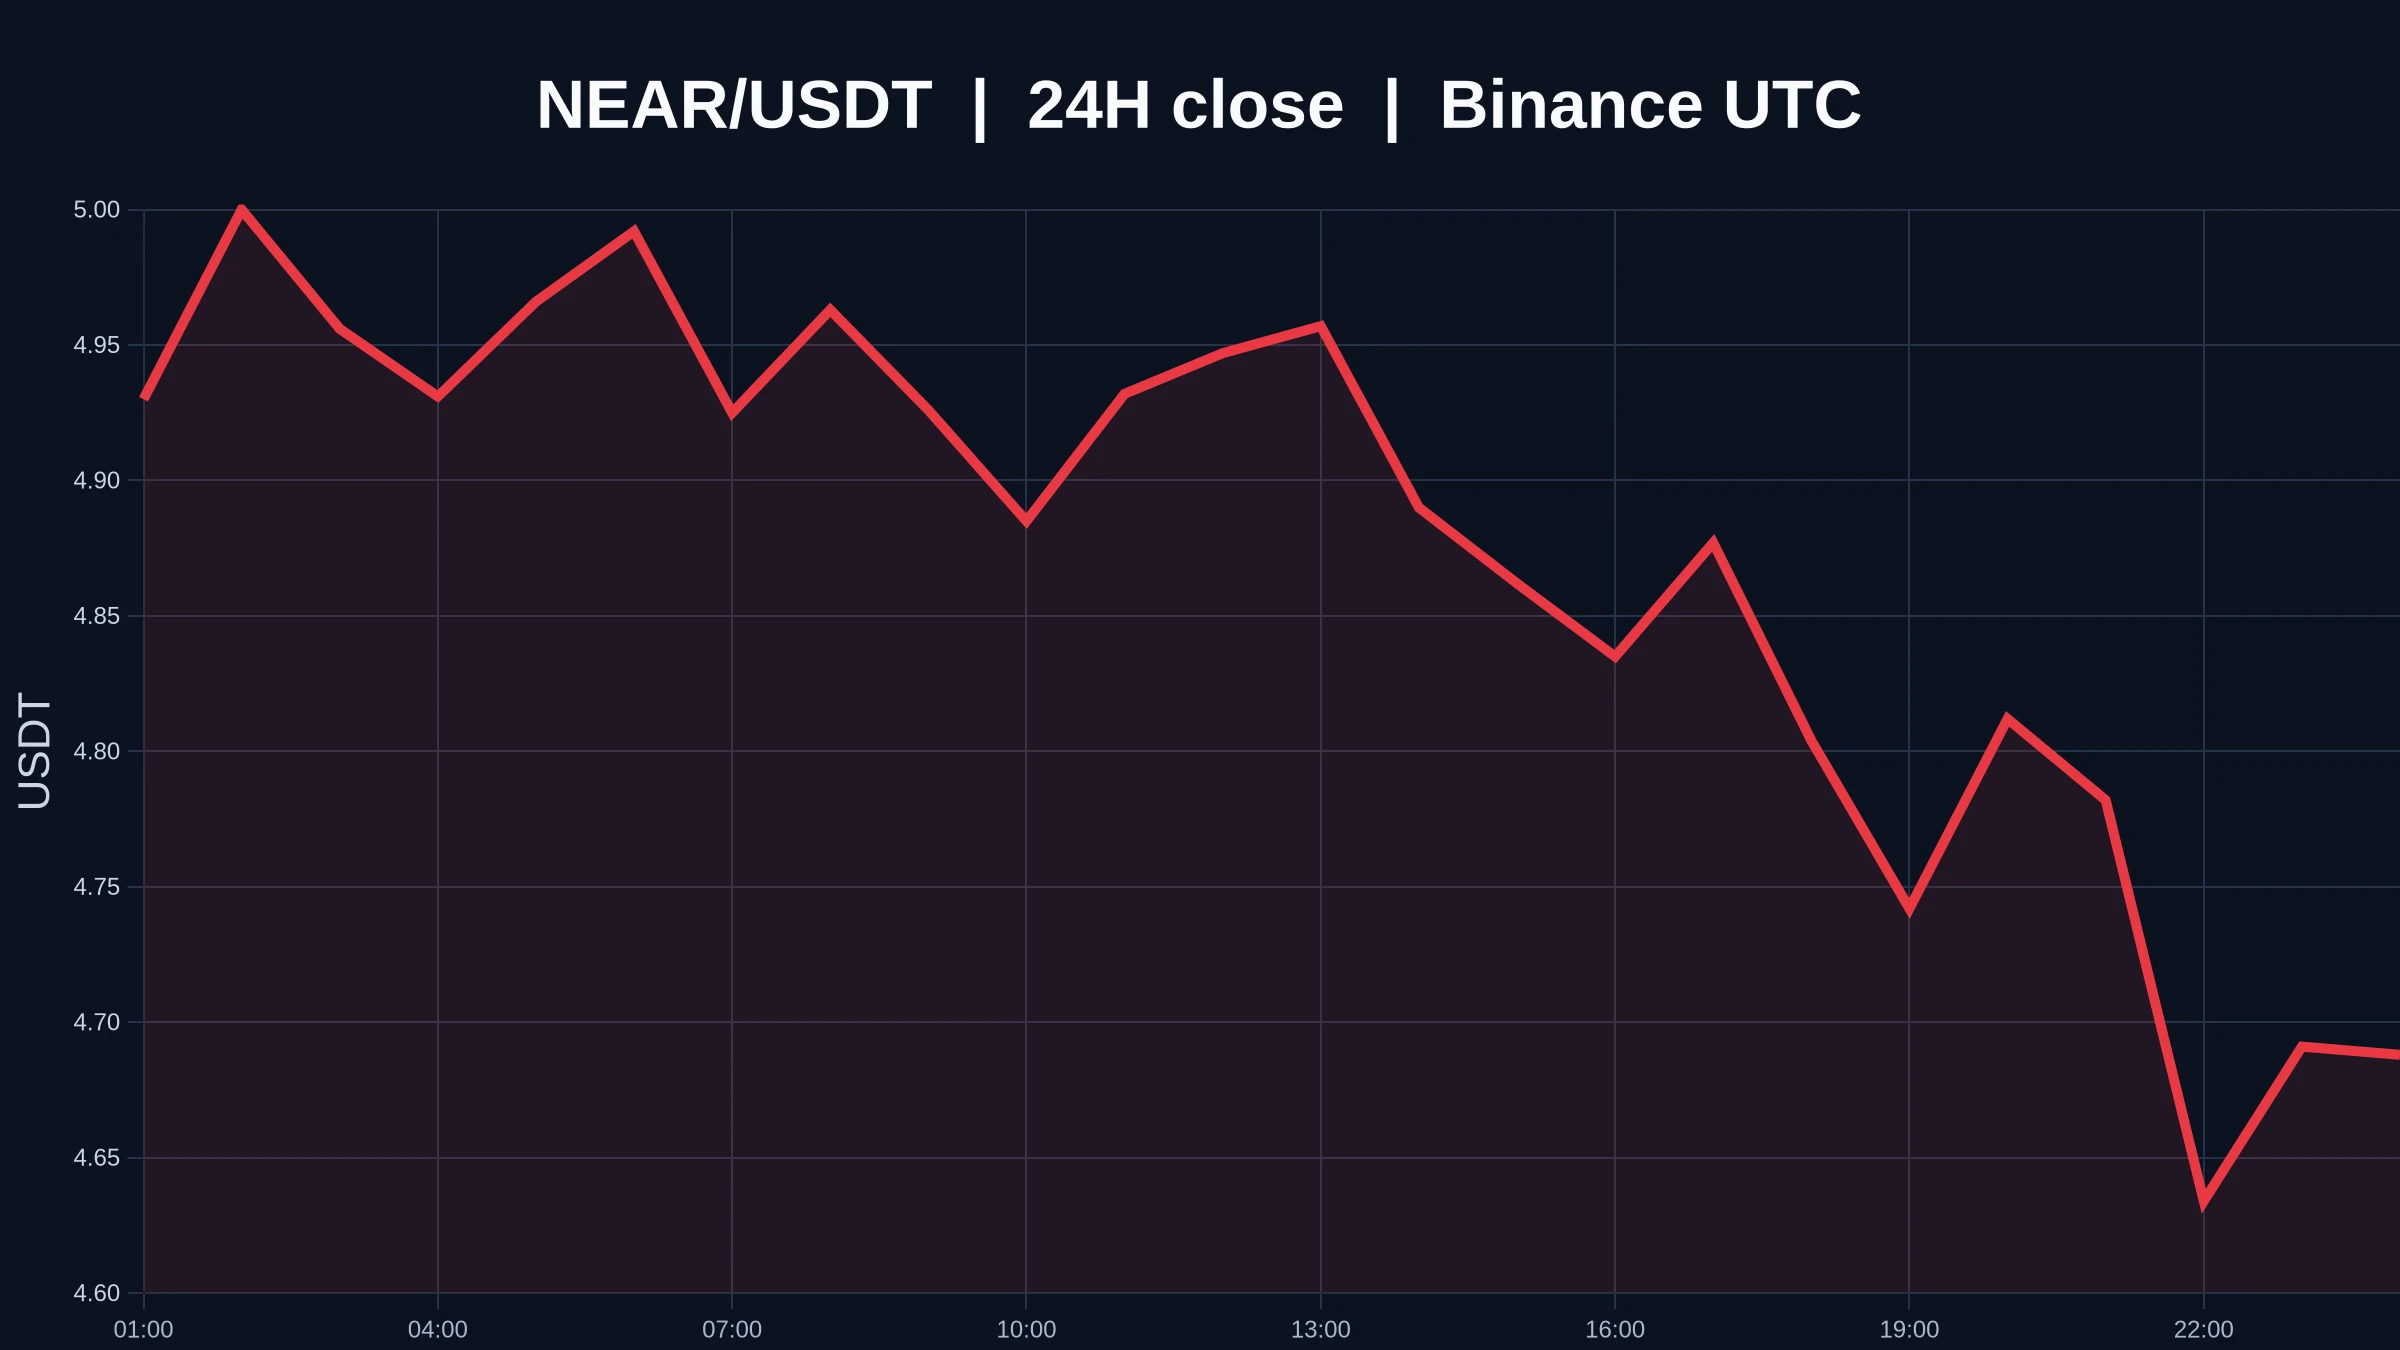
$NEAR is around 4.7 USDT, down 3.81% in 24 hours, with the high and low at 5.011 and 4.588. The 1-hour support and resistance levels are also exactly these two numbers; both the 1-hour and 4-hour charts are marked weak, and trading participation is only 0.19x. The most unusual thing about this chart is that when the price is near the 24-hour low of 4.588, the structure still shows no signs of support, and volume has not increased. There is still a gap between being oversold and actually bottoming.
I’d rather see this as a state where “demand for a rebound is increasing, but a reversal still la
post-image
Trenches
YMB
Y
bade
b
YMB
2TKD...pump
Market Cap
$.
Change
.
24h Vol
$.
Holders
.
AGT
A
bade
b
AGT
0x5d...e274
Market Cap
$.
Change
.
24h Vol
$.
Holders
.
CNPY
C
bade
b
CNPY
0xc6...ddd2
Market Cap
$.
Change
.
24h Vol
$.
Holders
.
ZIG
Z
bade
b
ZIG
0x8c...1145
Market Cap
$.
Change
.
24h Vol
$.
Holders
.
TRUTH
T
bade
b
TRUTH
6bW6...pump
Market Cap
$.
Change
.
24h Vol
$.
Holders
.
#SpotGoldFallsBelow$4000 #ShareWeekly
Gold Below $4,000: Inflation Pressure, Fed Uncertainty, and the Battle to Find a Floor
Gold’s latest decline has put one of the market’s most important psychological levels under serious pressure. Spot gold fell to approximately $3,987 during Asian trading, breaking below $4,000 for the first time since July. After months of strong gains, the move raises a critical question: Is this a temporary correction, or is the market entering a deeper phase of repricing?
My view is that gold’s weakness reflects a combination of persistent inflation concerns, changin
XAUT-0.84%
  • 3
  • 1
Norway is teaming up with two NATO allies to build 20 warships—by Nordic standards, that’s a massive order. I did a double take when I came across the news this weekend. Europe’s defense buildup isn’t just talk; they’re putting real money into shipyards. It’s a genuine boost for shipbuilding and the defense supply chain. The only question is how much of that money will actually be spent over the next few years. What do you think?
post-image
Someone tell me $DOOD
has any life left in it. We are bleeding out right at support and it is starting to look awfully quiet down here. Anyone catching this or just watching the floor disappear?TP: 0.001669SL: 0.001461Market movers:$ETH : Current Price 2,368.42 - 24h Change: -0.63%$BIRB : Current Price 0.0794 - 24h Change: +49.00%
post-image
BIRB+108.16%
Copy Trading Live Profit Show
live-cover
LIVE1,095
I think it's best to wait patiently for now. The risk of opening long positions is still very high. Bitcoin is under pressure and is expected to fall to $79,000–$78,000. Zcash is also down more than 5% today. What do you think? $ZE $BTC
post-image
BTC-0.25%
ZEC-3.04%
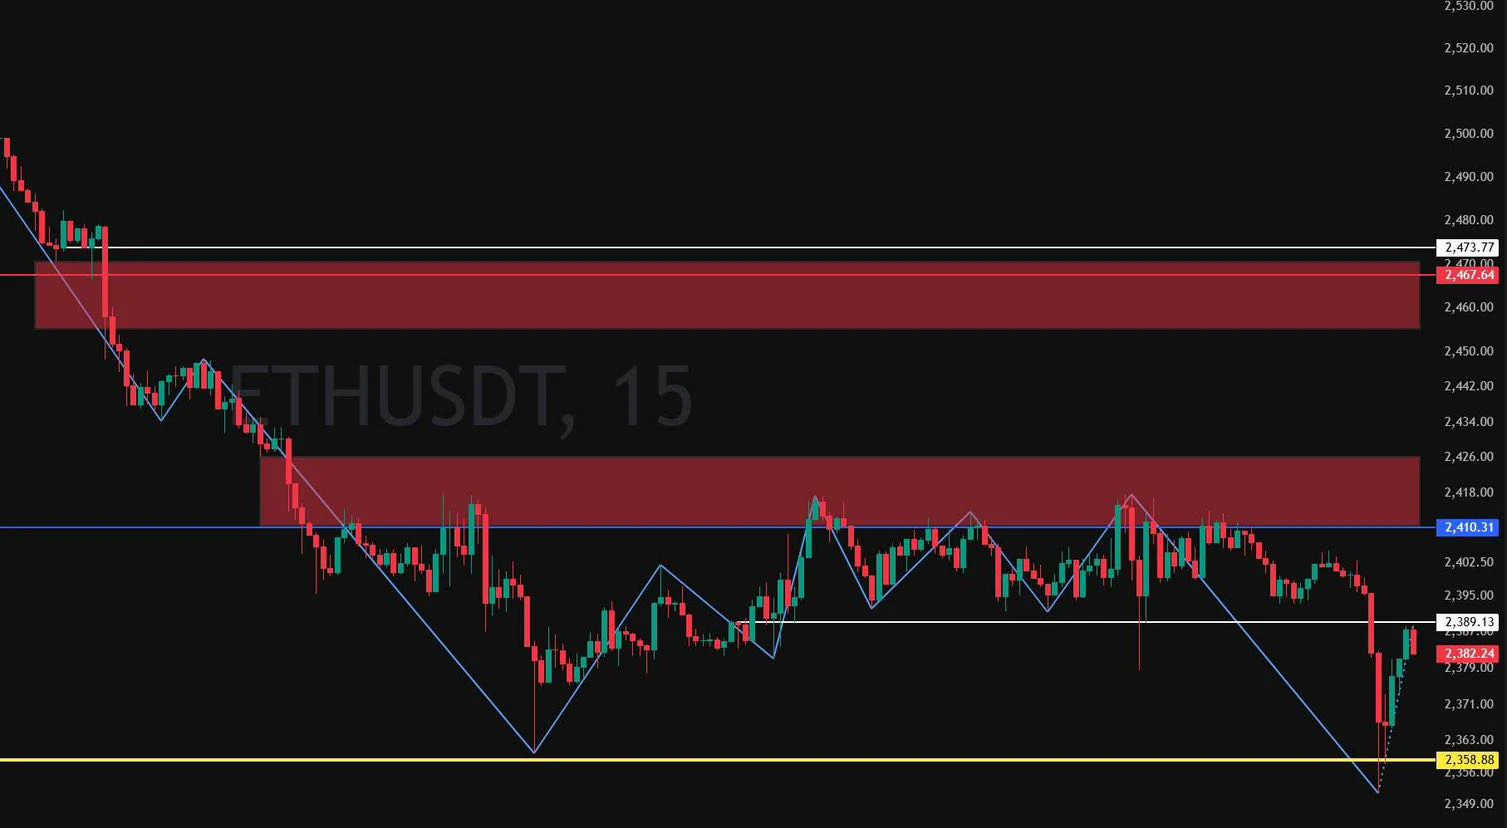
10/23 Market Update:
For the ETH view shared on last night's livestream, attempting a short-term long requires price to at least move above the first red zone. If it can't, watch to see whether price breaks below the white line (the 10/23 opening price) again. A break below would have a high probability of testing the lower yellow-line zone (H4 support)!
Can we go long here now? No! Bears still have the upper hand, and until specific bullish conditions emerge, don't rely on subjective guesses about tops and bottoms.
#技術分析 #ETH
post-image
ETH-0.18%
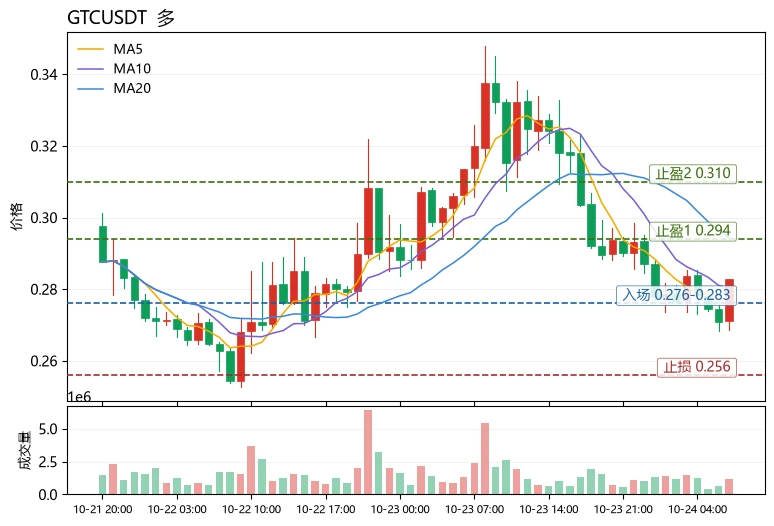
Many people equate “a big drop” with “an oversold bounce opportunity,” which is the easiest trap to fall into when comparing assets side by side—a larger drop does not mean relative strength, and oversold does not mean it’s time to go long. Put three assets from the same sector side by side, and their relative strength becomes clear. Current price: 0.28286, 24h: -12.71%, the smallest drop among the three candidates. Trading volume is moderate at 10.4M USDT, but the chart structure is more noteworthy: the price has moved back above the Bollinger lower band at 0.25827. Although MA5 at 0.278008 r
post-image
GTC
GTC芝麻币
Gate.Fun
MC:$0.1Holders:1
0%
GRAM-6.73%
PHA-12.74%
You get one sealed Evolving Skies booster box.
Or the same money in $CRO .
Locked for 5 years.
No splitting.
post-image
CRO-1.10%
VVV | Short 🔴 | Bearish | 15-minute 24-hour: -5.11% | Volume: 31.2M USDT. Short rationale: Price below EMA200; EMA20/50/200 in bearish alignment; RSI14 at 28.5; MACD histogram negative; ADX14 at 34.2; volume is 1.23 times the 20-candle average; breakout from the 20-candle range. Entry: 24.682 Stop-loss: 25.3309 Take-profit 1: 23.8709 | Take-profit 2: 23.3842 | Take-profit 3: 22.7353 For reference only; do not chase the trade. The strategy is invalidated if the stop-loss level is hit. Technical analysis only; this is not investment advice.$VV
post-image
VVV-3.36%
Just hit 5k followers 🙏🏻 🙏🏻
Been sharing charts and analysis for years and love to see how many people it’s been able to help!
Blessed to have such a great following. Heres to more 🍻
Twice in a row, I asked Grok Bot to analyze it, and it errored both times.
Is it because Trump is in it? Or because there’s a war?
Or because these two factors are combined?
post-image
$GTC Down 15.89% in 24 hours, currently at 0.2726. I’m putting my prediction on the record: it will rebound above 0.30 within 48 hours. My bet is that I’ll post proof of all my trading fees for this week. 24-hour trading volume is up sharply at 93M, and the low of 0.2673 already saw a wick that swept out a batch of leveraged longs. This kind of panic selling has happened three times in GTC’s history, and each time it turned out to be a golden short-term buying opportunity. There’s no sign of unusual on-chain activity from the project team; this is purely sentiment-driven selling. Trading plan:
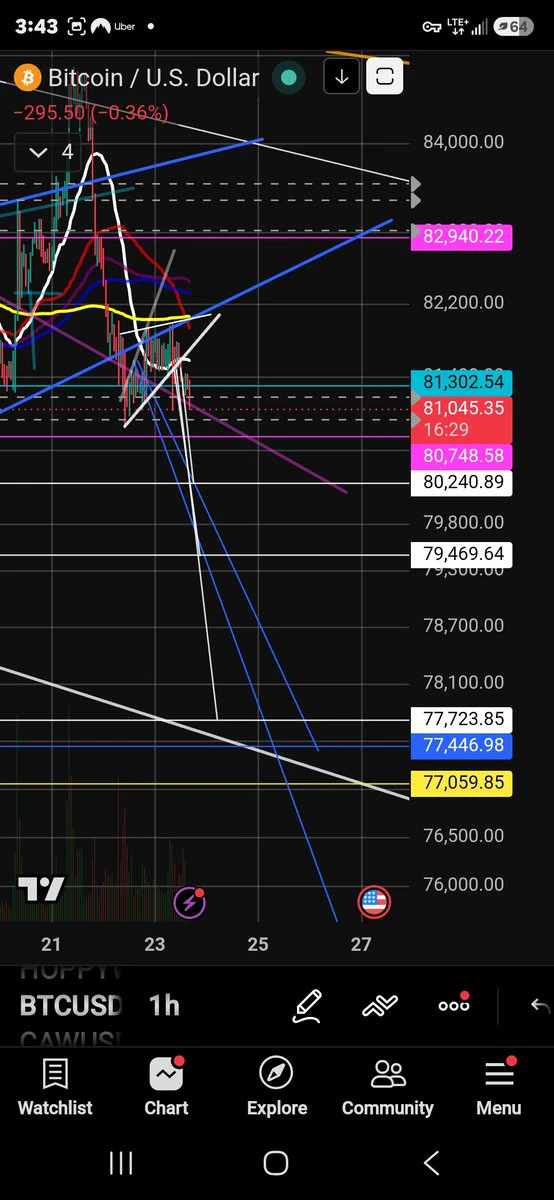
$BTC Breaking Down As Projected.
Price action could not get back over the 1hr 200MA. So price broke downwards as suggested.
NFA, DYOR ⚠️
#Crypto #Trading #BTC
post-image
BTC-0.25%
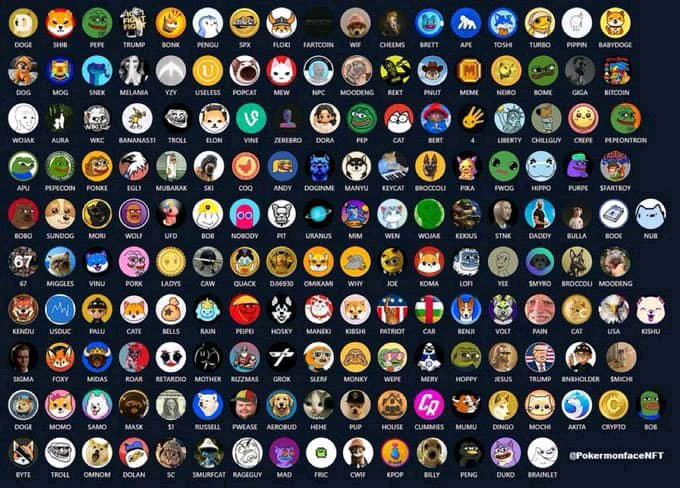
Which #memecoin is a must hold for 2026 ?
post-image
MEME+0.23%
Bitcoin ultimately failed to hold the 82K level. Price has once again broken below 81K. The short held at 81,750 is already up over 1,200 points.
You can close part of it here first. Protect your breakeven and watch the 80K support level. $BTC
BTC-0.23%
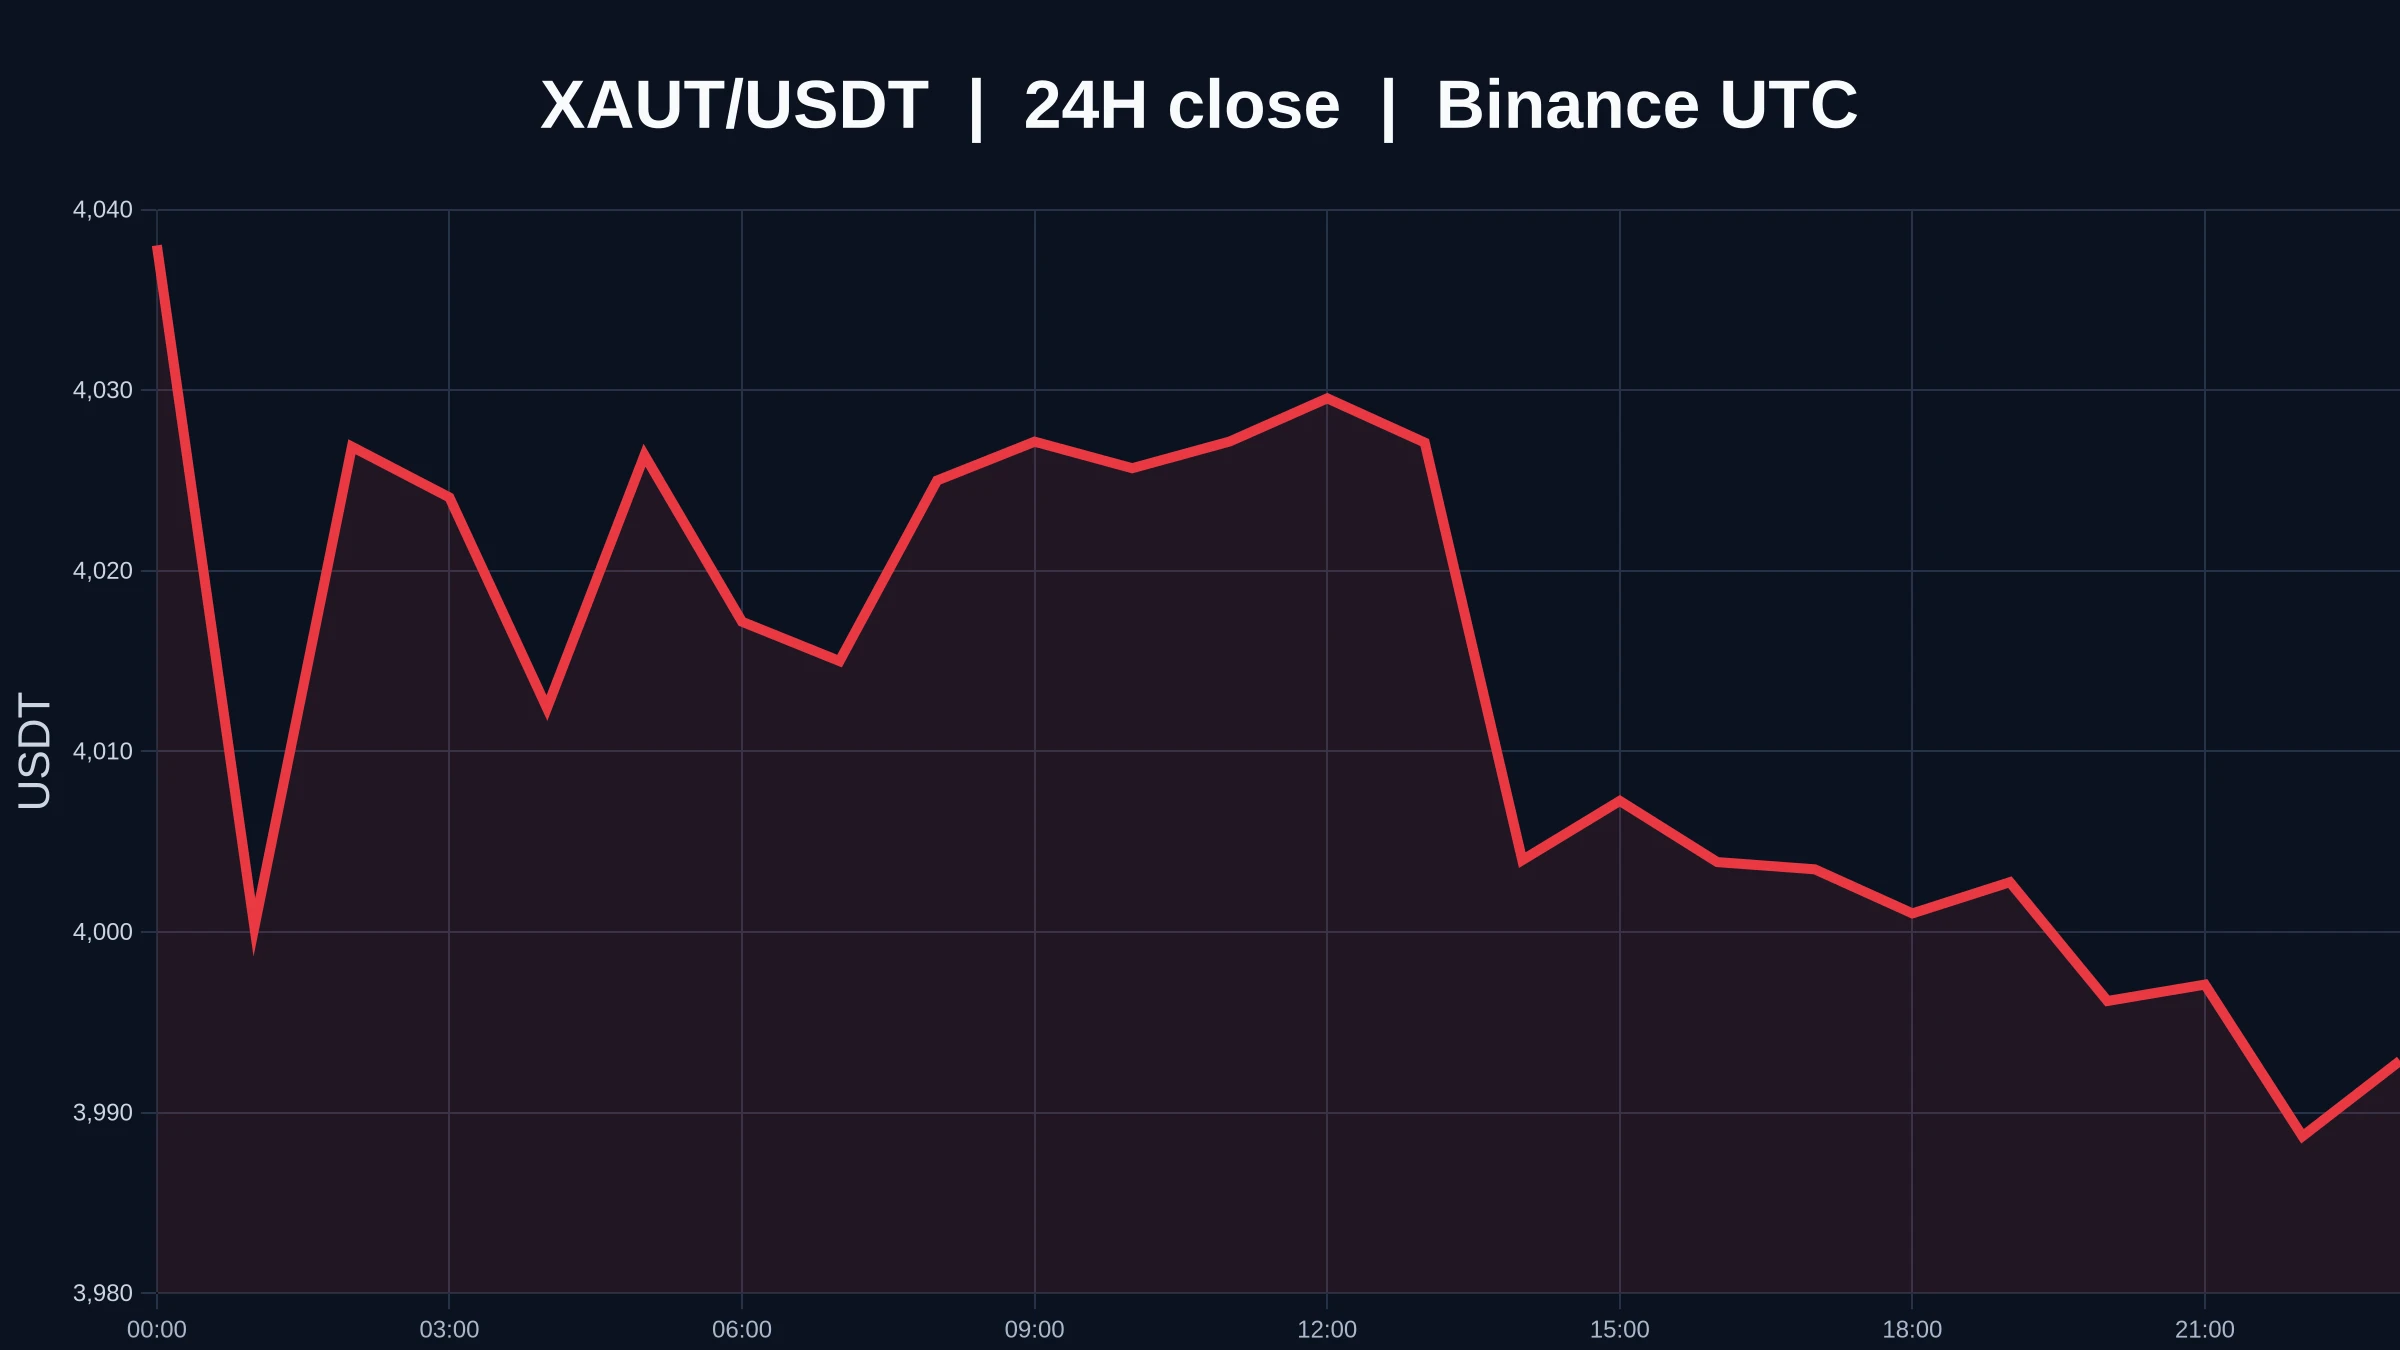
The most unusual thing about this chart is that the price is moving while volume has shrunk to 0.08x. $XAUT is currently at 3,992.86 USDT, down 0.92% over 24 hours, with the high and low at 4,039.57 and 3,980.01, respectively. The 1-hour support and resistance are also exactly these two levels. The direction is marked as weak, but trading volume has barely followed, undermining the credibility of this move.
A sharp drop only shows that selling pressure has occurred; it does not automatically mean the price is cheap, much less prove that anyone is really defending 3,980.01. There is still a “st
post-image
XAUT-0.84%
BTC MARKET TRENDS
live-cover
LIVE2,644
Load More

Join 40 M users in our growing community

⚡️ Join 40 M users in the crypto craze discussion

💬 Engage with your favorite top creators

👍 See what interests you

Trending Topics

USEarningsSeason

25.46k Views3k Discussing

The U.S. Q3 earnings season is in full swing, with major tech companies including Tesla and Meta reporting results. Market focus is shifting beyond revenue and profit toward AI spending, capital expenditure, margins and forward guidance. Which company’s earnings are you watching most closely?

GateWCTCS9GlobalTradingCompetition

475.52k Views7.67k Discussing

BTCDropsBelow81000

144.06k Views38.18k Discussing
View More