Square
Following
Hot
News
Notifications
Profile
Share your thoughts
placeholder
Article
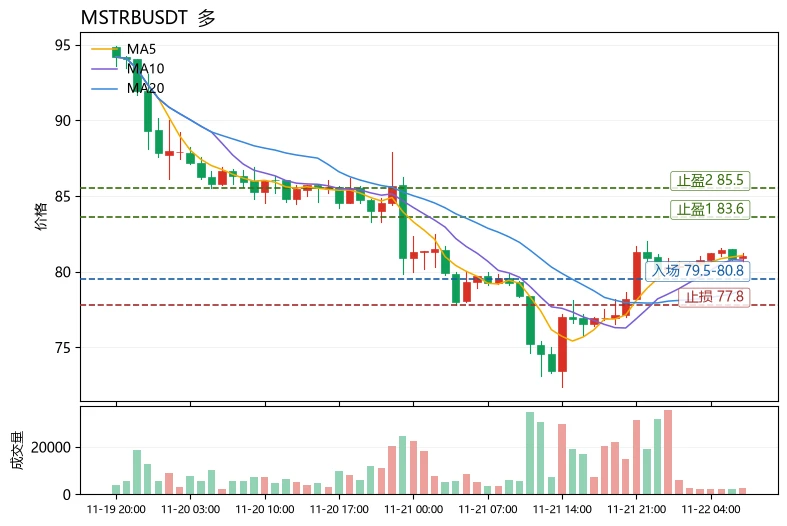
The most unusual detail in today’s market is that the Fear and Greed Index has plunged to 12, deep in the extreme fear zone, while MSTBUSDT bucked the trend and closed up 2.06%. MA5 (81.072) also held firmly above MA20 (78.83), and the MACD histogram remained bullish at +0.5023—a clear divergence between market panic and price structure. Among similarly active assets, $ENSO USDT$ENSOUSDT led with a 13.38% gain, but its MACD histogram showed a bearish signal at -0.001279, while its funding rate of -0.6305% indicates crowded longs and elevated risk of chasing the rally;
$PEPEUSDT fell 2.01% over
post-image
pepeusdt
pepeusdtUncle Pepe
Pump.Fun
MC:$2.33KHolders:1
0%
ENSO-3.03%
Towards the end of the week, something interesting unfolded in the markets. While stocks faced a sharp sell-off, the bond market moved in the opposite direction. The yield on the 10-year U.S. Treasury note fell by more than 10 basis points to 4.948%, while the 2-year Treasury yield dropped by over 13 basis points to 4.647%. In short, capital fleeing the stock market sought a "safe haven"—and it found one in bonds.

Why is this surprising? Because, typically, the expectation of a Federal Reserve interest rate hike pushes bond yields higher. Indeed, the market still views a rate hike in December
BTC-0.67%
GT-2.41%
SOL-0.77%
IDOL-6.71%
4STOCK-3.94%
  • 2
  • 1
Trenches
IDOL
I
bade
b
IDOL
0x3b...ab07
Market Cap
$.
Change
.
24h Vol
$.
Holders
.
PIEVERSE
P
bade
b
PIEVERSE
0x0e...25a9
Market Cap
$.
Change
.
24h Vol
$.
Holders
.
FIONA
F
bade
b
FIONA
B34n...pump
Market Cap
$.
Change
.
24h Vol
$.
Holders
.
CLAUDIA
C
bade
b
CLAUDIA
2j5S...W2ZM
Market Cap
$.
Change
.
24h Vol
$.
Holders
.
Singularity
S
bade
b
Singularity
7R4M...pump
Market Cap
$.
Change
.
24h Vol
$.
Holders
.
market update and trading signal with sheen crypto
live-cover
LIVE1,822
BTC-0.67%
ETH-1.26%
SOL-0.77%
$NAORIS Up 15% in a day, touching a high of 0.036—is the “breakout pattern confirmed”?
There’s a widely circulated claim: once the price clears the previous high and closes green on heavy volume, the pattern is confirmed and it’ll keep moving up. Sounds convincing, but doesn’t hold up in practice. Today’s 24-hour trading volume was 13.8M. In a 15% green candle, that volume shows there was turnover, but also that selling pressure was absorbed—and being absorbed doesn’t mean it’s all been cleared. Looking at the move from 0.0296 to 0.036, the price has already covered a lot of ground. Structural
NAORIS+0.66%
  • 1
  • 1
I spent the whole day running around taking care of business at the Commerce Bureau, without wearing any jewelry.
In the face of power, people are as insignificant as ants.
post-image
3372.56@开户以来, that's a huge loss
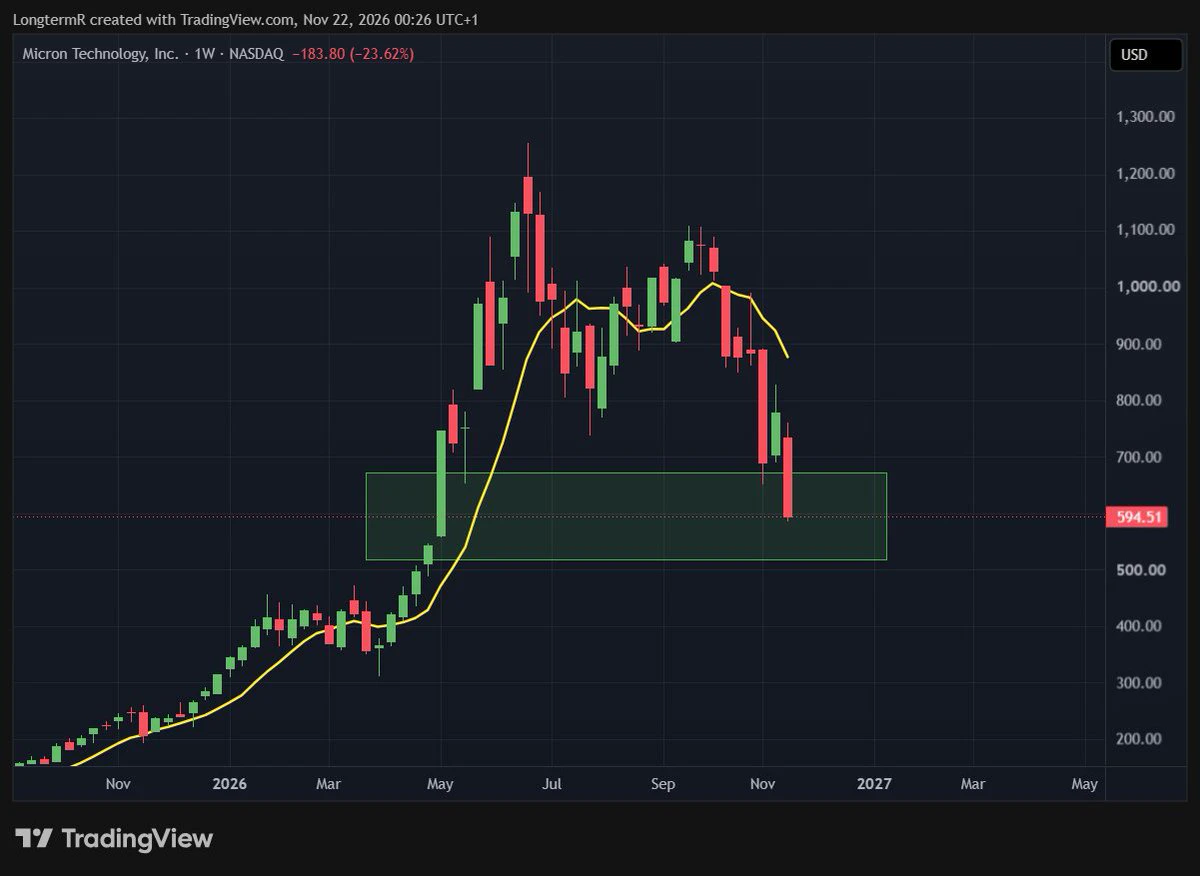
$MU Yeah, I know Micron looks like s*it here.
But it is actually in the Fib retracement area box.
Good to know ✍️🏼
post-image
MU-13.88%
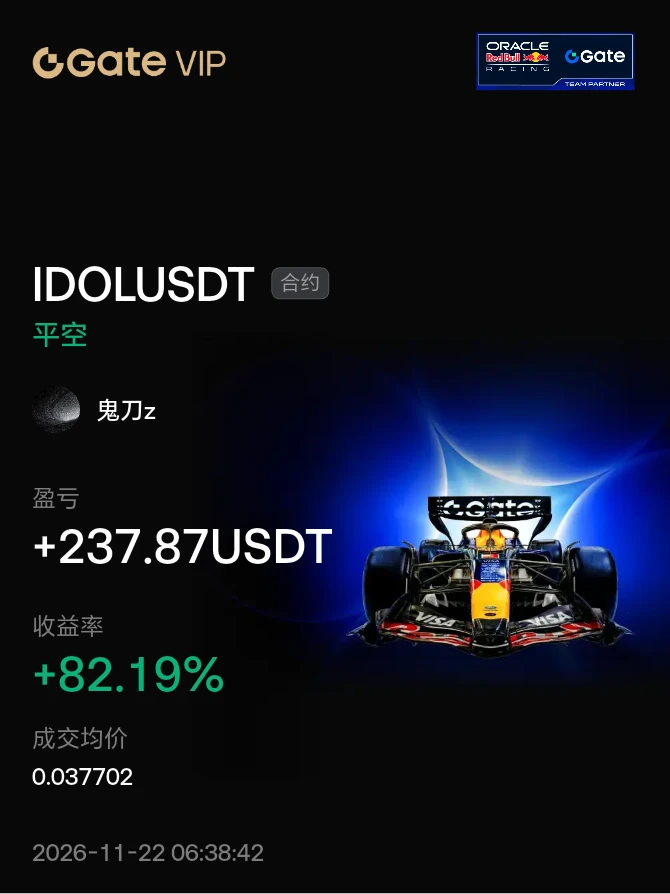
#晒出我的合约收益
Take a small bite of IDOL
Seize the opportunity$ANT #IDOL
post-image
ANT-8.68%
  • 4
  • 1
Long
$DODOX ‼️ Entry price: 0.03950 - Current price take profit: 0.04366 Stop loss: 0.03600
post-image
DODOX
DODOXDODOX
Pump.Fun
MC:$2.22KHolders:87
32.76%
$ENA Cycle Divergence: 1-Hour Strength, 4-Hour Weakness—Which Will Shift First?
Currently, $ENA is at 0.0989 USDT, down 0.60% over 24 hours, with a range of 0.0897–0.1002. The 1-hour trend is bullish, with support at 0.0897 and resistance at 0.1; the 4-hour trend is bearish, with support also at 0.0897 and resistance at 0.1181. The two timeframes give opposing signals, and the direction is still being contested.
The 1-hour RSI is 75.6, already in overbought territory, and EMA20 at 0.09770221 is below the price; the 4-hour RSI is 37.8, indicating weakness, and EMA20 at 0.10242771 is above the
post-image
ENA+8.04%
BTC Market Outlook
Wait for a Pullback to Go Long
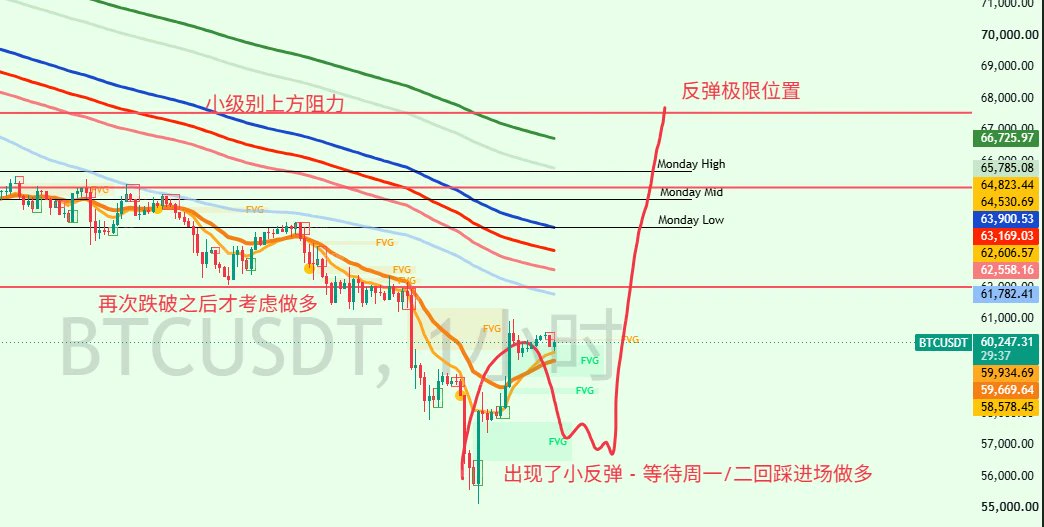
After two weeks of waiting, we’re finally nearing a bottom, and the market has seen its first rebound of around 10%—though it was only 5,000 points, it’s still encouraging
Many believe BTC will continue falling below 48,000. I don’t rule out that possibility, but I also think the market will rebound next Monday or Tuesday. At the very least, “there’ll be a rebound to trade”
This rebound is in sync with the rebound I expect in U.S. stocks
After the VIX rose on Friday, I think U.S. stocks will continue falling until intraday Monday or before the
post-image
BTC-0.67%
  • 2
$TRX Current price: 0.3054, up 1.09% in 24h. The 1-hour RSI of 63.89 signals relative strength, but the 4-hour RSI of 34.55 is deeply weak, while the volume ratio is only 0.20, indicating a clear drop in volume. The two timeframes are at odds above the same support at 0.2987, with no clear directional consensus. I’ll wait for confirmation. A break above 0.307 confirms the move once reached; a break below 0.2987 is my stop-loss. Low-volume standoffs are most likely to lure traders into one-sided thinking, so I’ll wait for volume confirmation before making a call. Not investment advice
#TRX #波场
post-image
TRX+0.42%
Arbitrum One’s Stablecoin Market Cap Increased by $327.4 Million Over the Past 7 Days
live-cover
LIVE1,137
BTC-0.67%
ETH-1.26%
SOL-0.77%
$H If you don't know much about coins, invest less! Invest less in coins that abandon miners! Learn from past mistakes!! Besides, this is a coin from those Indian bastards, so you definitely shouldn't invest
post-image
H-2.00%
  • 1
Read through the Primus FHE docs tonight.
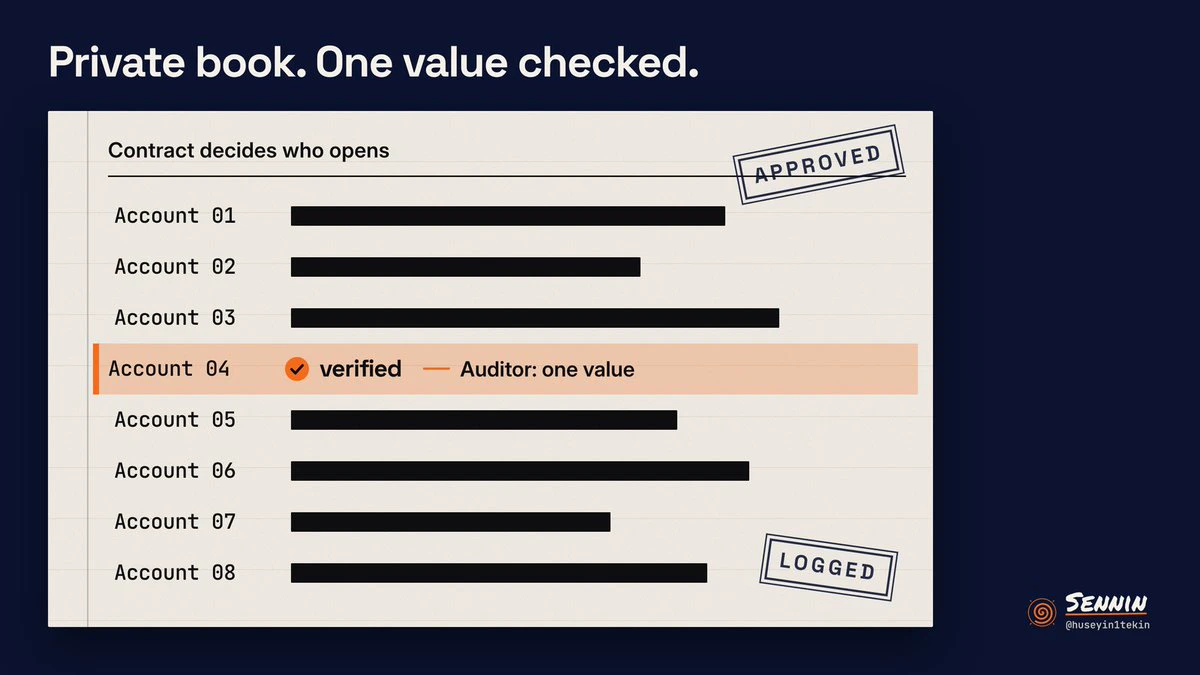
Balances and amounts stay encrypted onchain. The contract decides who can open each value, and every opening has to be approved and recorded. So an auditor can check one number without the whole book going public.
They mention it for payroll and treasuries.
I still want to see that record of who opened what. For now decryption runs through a TEE-protected service, with threshold MPC planned later.
post-image
FHE-3.50%
Continue holding the core long position and make T-trades based on the subscription levels.
At short levels, reduce your long position; at long levels, add to it. Repeat this process to preserve and maximize profits#BTC跌破6万美元关口
See the subscription updates below for specific levels
TradingKingGaoYuliang
Sharing the latest early-session levels! #BTC跌破6万美元关口
Last day of the limited-time subscription offer; prices return to regular rates tomorrow!
BTC-0.67%
#pi Buy when the price is low if you have liquid funds. Absolutely do not take out online loans to buy in. Even if the DEX launches in Q1 2027, it may not be available in many regions. Anyone familiar with the team knows trading won’t launch in regions without licenses. Don’t expect to make a quick profit; keep accumulating gradually for the long term.
PI-0.60%
  • 3
$XRP The current 1-hour and 4-hour trends are showing a clear divergence. The 1-hour timeframe is bullish, with the RSI as high as 74.12, while the 4-hour timeframe is bearish, with the RSI at just 39.37. Short-term traders may see a strong uptrend, while investors focused on longer timeframes may think the market remains under downward pressure. This divergence makes the current trend difficult to assess, especially with the price already nearing the 1-hour resistance level of 0.9389.
I would choose to wait at this level, as chasing a long position carries significant risk. The current price
post-image
XRP-1.15%
$HYPE Is Strong on the 1-Hour Chart but Weak on the 4-Hour Chart; Direction Remains Unclear
$HYPE is currently at 61.54, up 1.652% over 24 hours, with an intraday range of 55.8‑61.9. The 1-hour chart shows strength, with the price above the EMA20 at 60.8225. RSI14 is at 76.8, entering overbought territory, but the volume ratio is only 0.29, far below average, indicating limited short-term buying participation. The 4-hour chart remains weak, with the price still trading below the EMA20 at 62.93. RSI14 is at 30.86, near the lower end of its range, while resistance is well above at 70.3. Both tim
post-image
HYPE+0.24%
$ADA timeframes diverge: bullish on the 1-hour, bearish on the 4-hour, with key levels at 0.1462 and 0.1333
Currently, $ADA is at 0.1446 USDT, up 1.05% over 24 hours, with a range of 0.1333–0.1462. The 1-hour trend looks bullish, while the 4-hour trend remains bearish; the two timeframes give opposite answers.
My view: I’d rather see this as a direction that remains unconfirmed, rather than rush to label it a rebound or a pullback.
The 1-hour RSI at 77.4 has entered overbought territory, while the 4-hour RSI at 37.7 is neutral to bearish; the 1-hour EMA20 at 0.14358511 is below the current pr
post-image
ADA-1.48%
Load More

Join 40 M users in our growing community

⚡️ Join 40 M users in the crypto craze discussion

💬 Engage with your favorite top creators

👍 See what interests you

Trending Topics

BTCBreaksBelow60K

2.1M Views30.1K Discussing

BTC fell below $60,000 on November 20 for the first time since July, alongside a tech stock selloff and broader pressure on risk assets. Will $60K become resistance, or can BTC quickly reclaim it? What price or volume signals would convince you that selling pressure is easing?

GateDirectIPOPhase3ANTAllocates92100Shares

799.8K Views4.9K Discussing

NvidiaDropsNearly14Percent

335K Views7.6K Discussing

View More