
Square
Following
Hot
News
Profile
Share your thoughts
placeholder
Article
#每周来晒 #美国9月PPI大超预期 #沃什IMF讲话 Brent crude has surged past $110. U.S. stocks and Bitcoin should be on alert ahead of November 3
What happens if oil prices keep rising, AI stocks begin to correct, and U.S. inflation refuses to come down?
Any one of these factors on its own may not trigger a major sell-off. But if they converge around the November 3 U.S. midterm elections, the market could face a difficult stress test.
01 The real trouble is oil pushing inflation higher again
Brent crude has broken above $110 per barrel. This price warrants caution because crude oil is no ordinary commodity: its
post-image
ThisIsTranslateContent:
#美国9月PPI大超预期 #沃什IMF讲话 Brent crude breaks above $110; U.S. stocks and Bitcoin should be cautious before November 3
What happens if oil prices keep rising, AI stocks start correcting, and U.S. inflation remains stubbornly high?
Each of these factors alone may not necessarily trigger a major sell-off. But if they converge around the November 3 U.S. midterm elections, the market could face a challenging stress test.
01 The real problem is oil pushing inflation higher again
Brent crude has broken above $110 per barrel. This price warrants caution because crude oil is not an ordinary commodity: its effects ripple throughout the economy through transportation, production, chemicals and consumer spending.
More importantly, U.S. CPI rose 3.7% year over year in September, while gasoline prices jumped 9.1% month over month. The simultaneous rebound in inflation and rise in energy prices have prompted markets to reconsider whether the Federal Reserve needs to maintain its restrictive policy. Here lies a key tension. If oil prices spike briefly and then fall, markets may quickly absorb the negative impact; but if geopolitical conflicts persist and oil prices remain elevated, inflation could prove more persistent than expected.
This would make the Fed's choices more difficult: cutting rates could prolong inflationary pressures, while keeping rates high could weigh on the economy and asset valuations. So what concerns us more than oil rising 3.6% on any given day is whether high oil prices will change market expectations for interest rates over the coming months.
02 AI valuations and high interest rates could reinforce each other
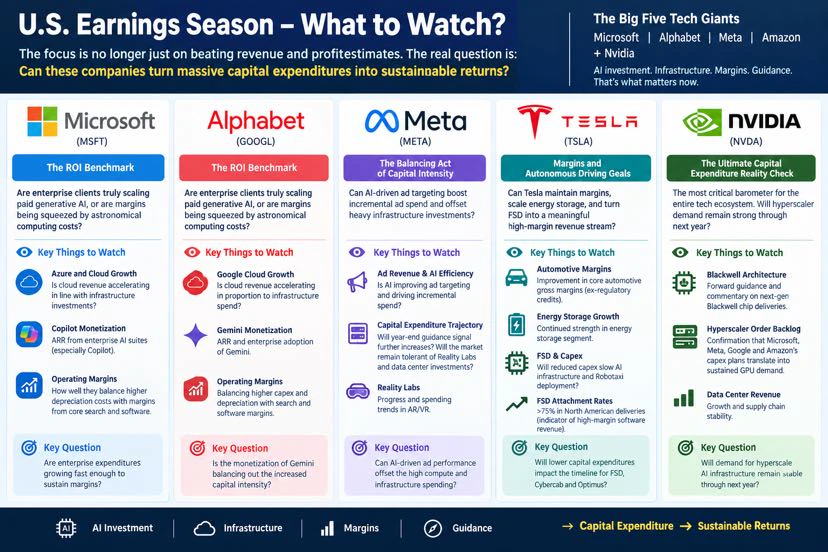
AI has been one of the most important drivers of the latest U.S. stock market rally. The market has been willing to assign high valuations to companies involved in chips, cloud computing and data centers because investors believe their revenue and profits will continue to grow.
But two questions need answering now: How much return will AI investment actually generate? If financing costs keep rising, are those returns still worth today's stock prices?
Reuters reported on October 15 that confidence in further gains for U.S. stocks depends heavily on strong earnings from large technology companies. Meanwhile, rising oil prices and Treasury yields are also putting pressure on high-valuation assets. This means that even if the AI industry's long-term direction remains unchanged, stock prices could first go through a valuation contraction. If technology companies report better-than-expected results, the market could still recover; if earnings disappoint while interest rates rise, the correction may be more than a short-term swing in sentiment.
03 Could the November 3 midterm elections become a black swan?
The election itself is not necessarily a black swan; the real risk to watch for is a gap between the election outcome and market expectations.
The U.S. midterm elections will determine control of Congress. Different outcomes could affect fiscal policy, tariffs, AI regulation and the progress of cryptocurrency legislation. For the crypto industry in particular, the pace of digital asset regulatory policy is worth watching.
But changes in congressional seats do not mean all U.S. policies will change immediately. The executive branch still has considerable policy tools at its disposal, and the specific impact will also depend on subsequent legislation and implementation.
What could truly catch markets off guard is a scenario in which investors expect the election to bring policy moderation, but the result instead creates greater policy uncertainty; or in which energy prices keep rising, increasing pressure on the government over inflation and the cost of living. If markets have already bet on a particular election outcome and the result fails to meet expectations, crowded positions could be unwound all at once.
04 What could happen to Bitcoin?
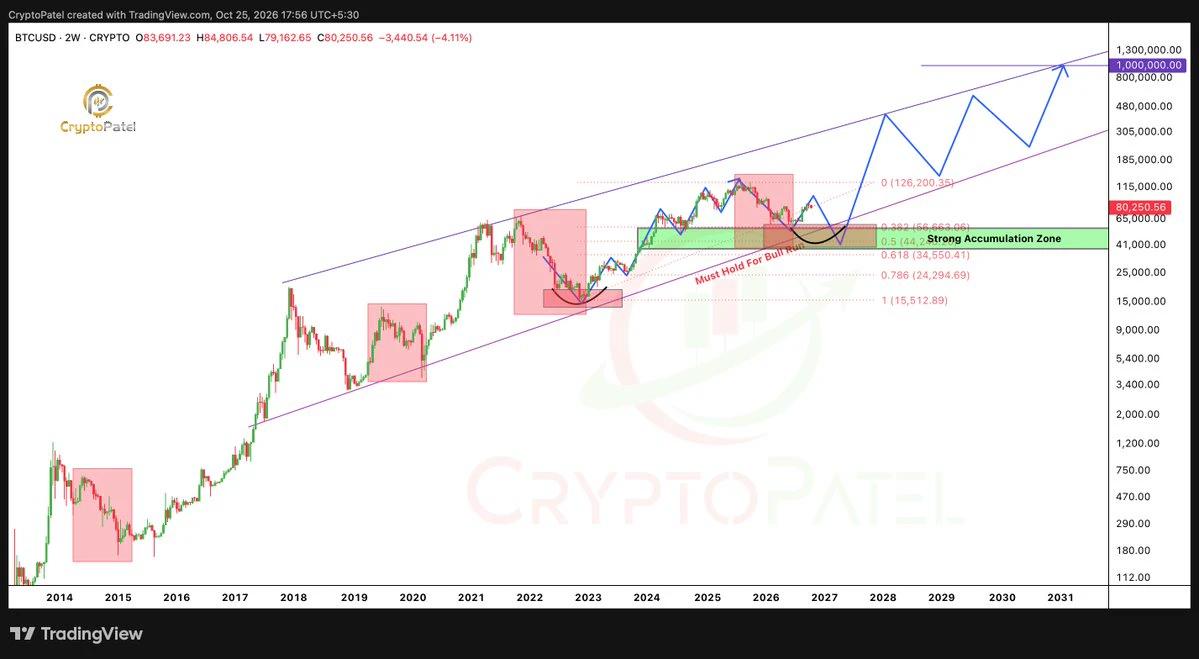
In the short term, Bitcoin should not simply be treated as a safe-haven asset. If oil prices continue to rise, inflation rebounds and the Fed sends a more hawkish signal, both technology stocks and crypto markets could come under pressure.
Bitcoin also faces an additional risk: liquidations of leveraged positions could amplify a decline. Conversely, if geopolitical tensions ease, oil prices fall and markets confirm that the Fed will not tighten policy further, risk assets could rebound quickly.
So, over the coming weeks, focus on four indicators: Brent crude prices, U.S. two-year Treasury yields, U.S. technology companies' earnings performance, and Bitcoin ETF flows and changes in futures-market leverage. These are more useful than simply guessing the outcome of a particular election.
05 How should you respond?
Volatility risks in U.S. stocks and crypto markets may rise for a while, but that does not mean a bear market is inevitable. If oil prices fall, yields stabilize and companies deliver on earnings, the market could still recover; if oil prices stay high, rate expectations continue to rise and AI earnings fall short of expectations, the market could face a deeper correction.
For investors, keep some cash on hand, manage leverage, and don't rush to buy the dip after a single decline or easily dismiss the value of long-term assets when markets panic.
The real risk to watch for is not any single negative factor, but several risks that could otherwise be absorbed separately happening at the same time. Treat the period before November 3 as an event window that warrants close attention, not as a predetermined market turning point. Going forward, watch oil prices, interest rates and earnings. The data will show where the market ultimately goes.
repost-content-media
BZ+0.10%
BTC-0.96%
GAS-4.65%
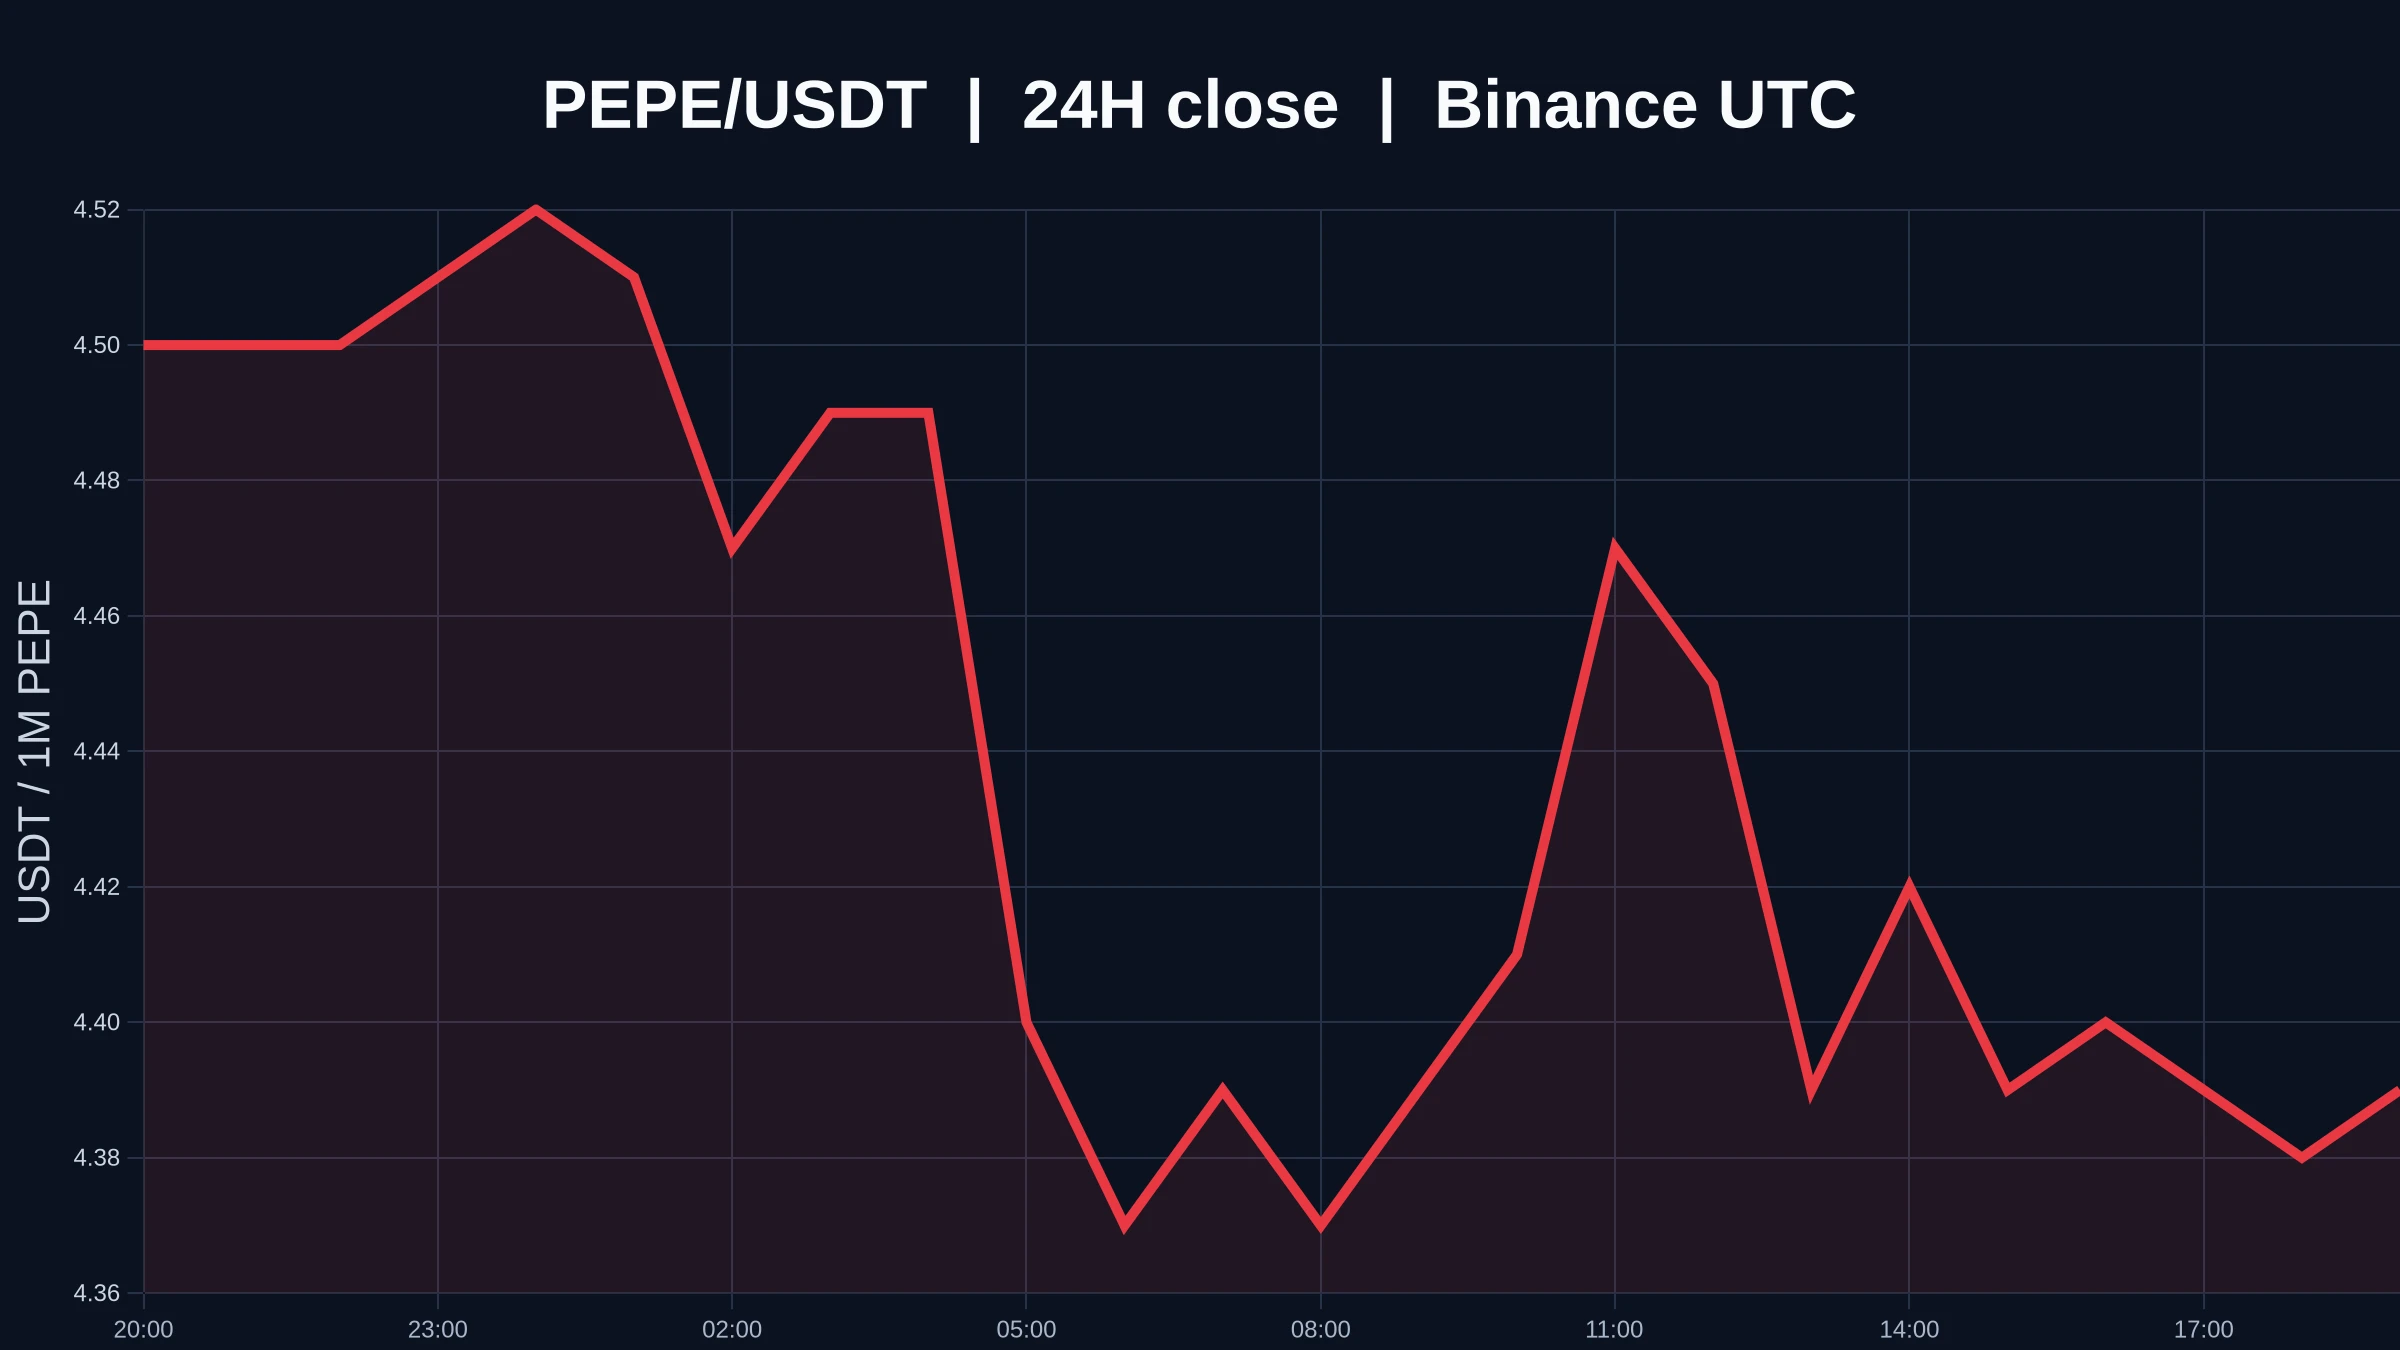
My friend shorted $AGT , $Q and $BTW today. All three. Same day.
His logic was solid: “It’s already up 65%. It can’t go higher.”
$AGT hit 0.1048 and kept going.
Then he said, “Okay, $Q is up 119%. That’s insane. Now THIS one has to dump.” It printed another green candle while he was typing the order.
By then he was angry, so he went for the third one: “$BTW is only up 34%, there’s still room for a clean short.” The chart made a new high and he made a new lesson.
The funny part is that Q’s funding was negative. Shorts were paying longs to stay in the trade. He literally paid a fee to be wrong
post-image
AGT+40.60%
Q+117.46%
BTW+26.01%
  • 1
Trenches
AGT
A
bade
b
AGT
0x5d...e274
Market Cap
$.
Change
.
24h Vol
$.
Holders
.
CNPY
C
bade
b
CNPY
0xc6...ddd2
Market Cap
$.
Change
.
24h Vol
$.
Holders
.
Q
Q
bade
b
Q
0xc0...0589
Market Cap
$.
Change
.
24h Vol
$.
Holders
.
COVENANT
C
bade
b
COVENANT
0xcd...de79
Market Cap
$.
Change
.
24h Vol
$.
Holders
.
Gato
G
bade
b
Gato
55A3...pump
Market Cap
$.
Change
.
24h Vol
$.
Holders
.
Find opportunities in $DOGE using price-volume confirmation; key levels and exit lines are here
What stands out most in this $DOGE chart is not the 2.33% 24-hour decline itself, but that the 1-hour and 4-hour charts are both weak yet haven’t delivered the same answer.
My view is that direction is taking shape for now, but low participation has reduced the credibility of this move.
$DOGE The current price is 0.07917, with a 24-hour range of 0.07702–0.08107. The 1-hour support is at 0.07702, with resistance at 0.08096; the two more distant 4-hour boundaries are 0.07702 and 0.08566. These numbers
post-image
DOGE-1.99%
$Bull is coming. This move dumped from 0.0653 to 0.0560. I chased the highs last time and took an 18% loss as tuition—I still remember it clearly. It’s now at 0.0570, down 12.29% in 24h, with 12.6M in trading volume. Volume hasn’t collapsed, which means buyers are stepping in. My plan: don’t chase at the current price; wait for a pullback to the 0.0560–0.0565 range and enter in batches, keeping my position to 30%. Set a stop-loss at 0.0540 (below the previous low); if it breaks, I’m out—no hesitation. First take-profit target: 0.0600; second: 0.0630. Sell half when it gets there. This coin is
牛来-8.83%
EtherFi's borrowing market is the largest app on Optimism, with $300.5M locked, nearly six times Aave V3's $50.35M on the network. Its loans are up 24.81% in the past 30 days to $41.55M.
@ether_fi
OP-6.85%
AAVE-2.26%
The Magnificent Seven are propping up S&P earnings growth. The earnings data is still there, but this level of concentration is a risk in itself. Once the social media buzz cools, the crowded trade can quickly unwind. After doing this for so long, I’ve learned that position sizing is always more important than getting the direction right. What do you think?
post-image
SPX+5.16%
#GateBTCAndETHFuturesVolumeRanksTop3
Gate’s rise into the global top three for BTC and ETH derivatives trading volume highlights a major structural shift in cryptocurrency exchange liquidity. Whether this momentum is sustainable depends on several key factors and market dynamics:
Key Drivers Supporting Gate’s Momentum in the Derivatives Market
* Deepening Liquidity and Reduced Friction: High trading volumes—such as the $7.18 billion daily benchmark in BTC futures—result in tighter spreads and lower slippage, attracting institutional market makers, algorithmic traders, and high-frequency funds
BTC-0.25%
ETH-0.93%
GT-3.58%
XAUUSD-0.12%
MU-5.66%
  • 4
Same range just chop all around for $ETH .
Deviation? Continuation? Or still chop
ETH-0.93%
The morning sunlight shines on the flower’s center,
making it especially radiant.
May your mood bloom like a flower
🐷🐷🐷🐷
post-image
#WarshIMFSpeech 📊 100% Win! Gate Square “Share Weekly” Special Topic is Ongoing!........
Post with hashtags for red packets, Up to 100 USDT weekly !
How to Join.......
1️⃣ Register: https://www.gate.com/campaigns/6244......
2️⃣ Post with #ShareWeekly and WarshIMFSpeech......
💬 Topic
Fed Chair Kevin Warsh speaks at an IMF fireside chat today. With inflation pressures rising, markets are watching for policy signals and their impact on the USD, stocks, and BTC.
💡 Discussion
1️⃣ Will Warsh sound hawkish or dovish? Could the Fed hike rates again?
2️⃣ How will his remarks impact BTC? Rally or pul
TSLA-2.17%
this army will see heaven sooner than later, looks like 2024
post-image
#DOGE DOGE ETF switches from consecutive net inflows to redemptions! Can the $0.08 support hold?
Dogecoin fever cools! ETF funds flee, with $0.08 becoming a crucial line in the sand🐶
Once wildly popular Dogecoin (DOGE) is now facing a subdued market atmosphere. Dogecoin ETFs had previously seen three consecutive weeks of inflows, but the trend completely reversed in October as institutional funds began to pull out, putting considerable pressure on the price.
📉ETF funds see $540k in outflows over two days.
According to SoSoValue data, spot Dogecoin ETF flows were virtually flat from October 1
post-image
ThisIsTranslateContent:
#DOGE DOGE ETFs switch from consecutive net inflows to redemptions! Can the $0.08 support hold?
Dogecoin hype cools! ETF funds flee, with $0.08 becoming a make-or-break line🐶
Dogecoin DOGE, once hugely popular, is now facing a subdued market atmosphere. Dogecoin ETFs had previously seen three consecutive weeks of inflows, but the trend completely reversed in October as institutional funds began to pull out, putting significant pressure on the price.
📉ETF funds see $540,000 in outflows over two days.
According to SoSoValue data, from October 1 to 9, flows in and out of Dogecoin spot ETFs were virtually flat, with no funds entering or leaving. Instead of a turnaround, a wave of redemptions followed. Around $400,000 flowed out on October 12, followed by another $138,600 on the 13th, bringing total outflows to $540,000 in just two days.
Fund net assets also shrank from nearly $17 million at the start of the month to $14.44 million. The retreat of institutional funds is a major headwind DOGE must now face.
📊The price continues to weaken, with bearish technical indicators.
DOGE is down 14% overall this month. It was still holding at $0.095 at the start of the month, but slid steadily after October 7 and is now trading at around $0.0800.
Although it briefly rebounded to a high of $0.088 on the 12th, the recovery was short-lived, and the price quickly fell again, touching a low of $0.08. Technical indicators are also unpromising: the RSI has fallen below its signal line, while the CMF money flow indicator briefly dropped to near -0.90 and has now recovered to -0.30, indicating that the overall trend of capital outflows remains unchanged.
⚖️Futures market sees a tug-of-war between bulls and bears, with bullish positions weakening.
Signals from the derivatives market are mixed. DOGE open interest first surged to $652 million, then fell to $598 million before edging back up to $609 million. The funding rate remains positive at 0.0088%, indicating that the market still retains some long positions, with bulls continuing to pay fees to bears. However, the overall decline in open interest means bullish momentum in the futures market is weakening.
📌Market Summary and Key Points to Watch
$0.08 is a key short-term support level for DOGE. If it breaks decisively below this level, pressure on bulls will intensify sharply, and the price could fall further. The market is currently weak overall, and the rebound lacks strength, so it is unwise to blindly buy the dip. Watch closely to see whether the $0.08 support holds.#WCTCS9
repost-content-media
DOGE-1.99%
Layout: Bitcoin, Ethereum, Dogecoin
live-cover
LIVE880
  • 4
EIA data determines the short-term direction of crude oil
live-cover
LIVE1,889
$ETH is currently at 2,396.89, down 1.15% over 24 hours, with volume at 0.12 times the average over the past 20 candles. Put these figures together, and the key point to explain is that $ETH’s price has already moved, but trading activity and volume have not followed.
One verifiable update: Gate’s official announcement reads, “Gate Research: Corporate Earnings Support U.S. Stocks, KR1 Launches Ethereum Validator Nodes…”. It may explain why people are paying attention, but it cannot answer which way the price will move.
You can tentatively trust the direction, but not assume the move will conti
post-image
ETH-0.93%
#TeslaRoadsterSparksMemeCoinSurge
Tesla’s Rocket Roadster Meets Crypto Hype: Can FTR Turn Viral Attention Into a Lasting Rally?.
The connection between futuristic technology and cryptocurrency speculation is becoming increasingly visible. Tesla’s rocket-powered Roadster demonstration has created a powerful online narrative, attracting attention from technology enthusiasts, traders, and meme-coin communities. Now, the key question is whether this attention can translate into sustained market participation or whether the excitement will fade as quickly as it appeared.
For me, this story is not
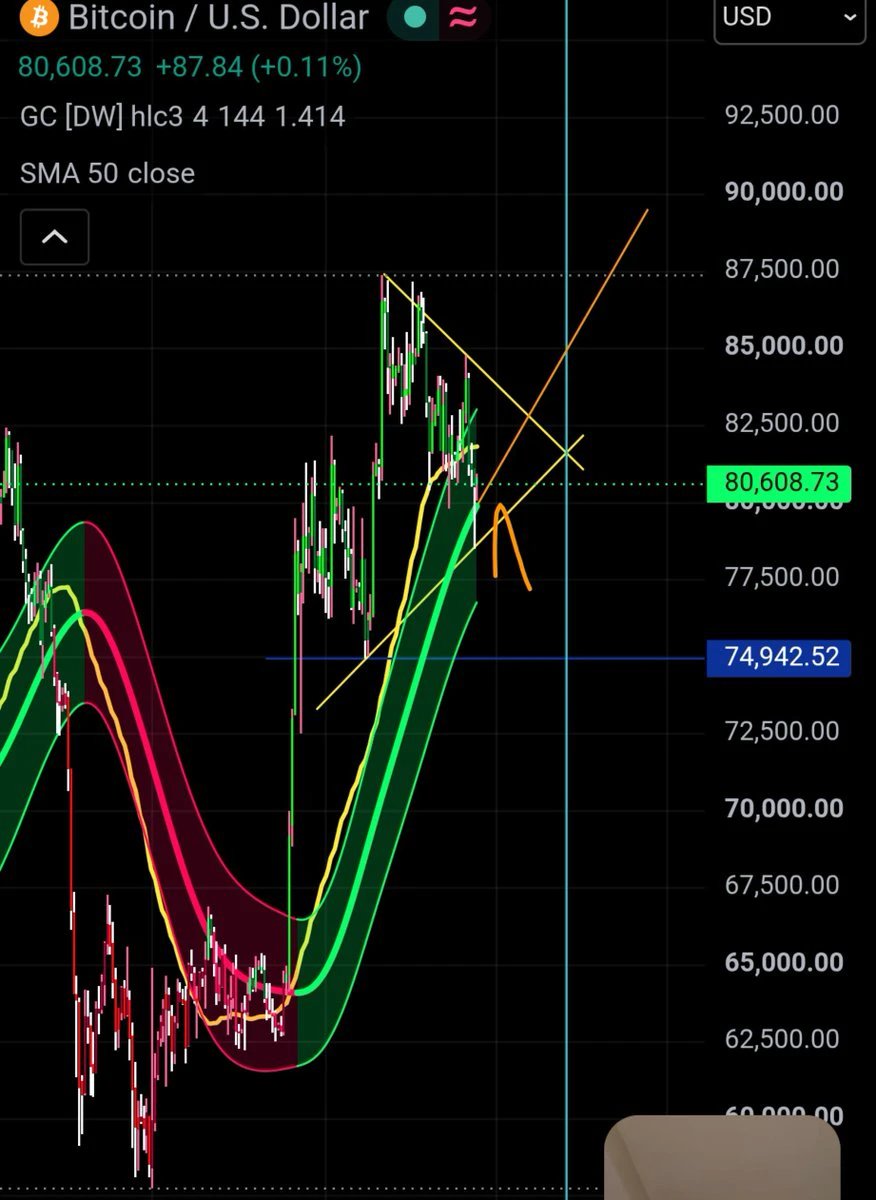
Strong rebound after sweeping the lows—the bulls fought tooth and nail to defend 80.7k. Try going long on $BT .
Entry range: 80,804.0 - 81,210.1Take-profit targets: 82,824.1 - 84,277.7Stop-loss: 79,996.0Note: If it fails to reclaim the 1-hour MA25, it may test the range low again. Don’t go all in, guys. Size your position according to your account. It’s time to go long! 👇👇👇These caught my attention today: $AV and $AGT .
post-image
AGT+40.60%
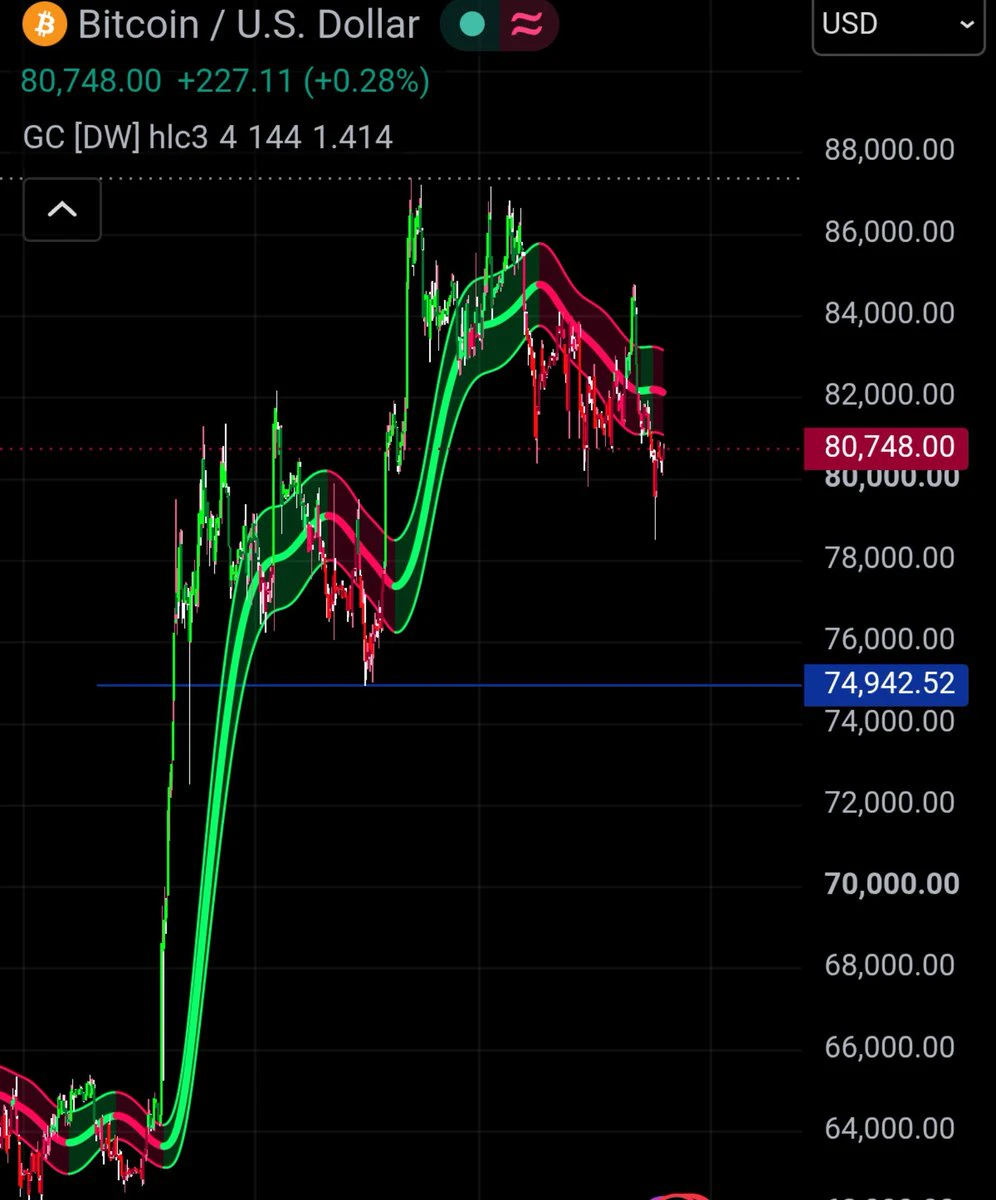
$BTC Confirming this scenario with ETH movement $ETH
post-image
BTC-0.25%
ETH-0.93%
#KOSPIJumps3.3% #ShareWeekly
KOSPI Rebounds After a 7.6% Crash: Is the Semiconductor Sell-Off Over, or Is More Volatility Ahead?
The Asian stock market experienced a dramatic shift on October 15–16, 2026, as semiconductor stocks came under heavy selling pressure before staging a partial recovery. South Korea’s KOSPI index suffered a sharp 7.6% decline on October 15, dropping to 5,554 points and triggering a circuit breaker. The index touched its lowest level since April, highlighting how quickly market sentiment can change when inflation concerns, interest-rate expectations, and uncertainty s
SK Hynix+0.79%
JPN225+0.00%
NAS100-0.37%
CXMT-1.15%
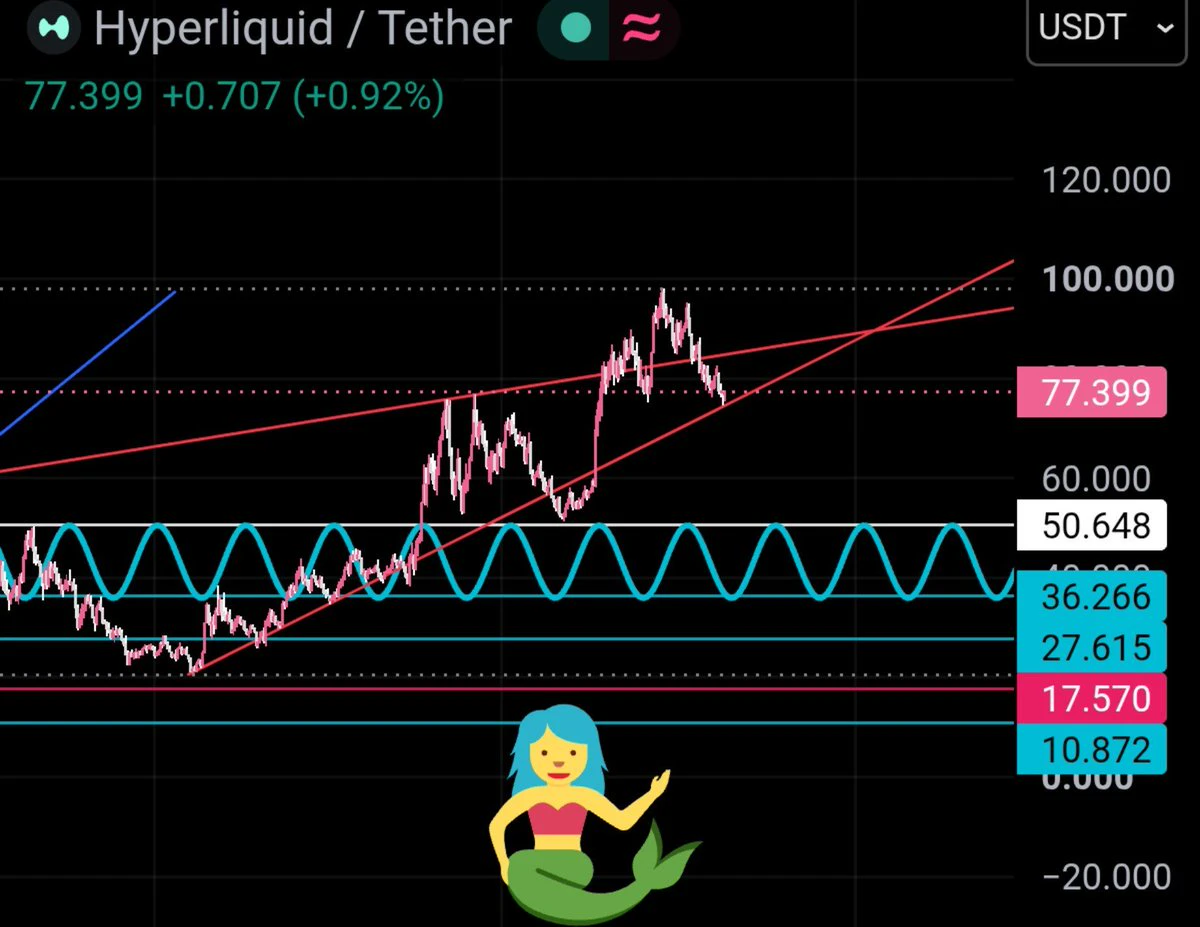
hyperliquid:native is back at the 77–75 support area, the same zone that started the September rally.
A short-term bounce is around the corner. A break above the descending trendline would open the way back to 82–84.
Will this support hold again?
post-image
HYPE-2.86%
Load More

Join 40 M users in our growing community

⚡️ Join 40 M users in the crypto craze discussion

💬 Engage with your favorite top creators

👍 See what interests you

Trending Topics

USSeptemberPPIBeatsExpectations

91.35k Views1.93k Discussing

US September PPI came in at 6.3% YoY, well above the 5.3% market expectation, pointing to renewed producer-side inflation pressure. Weekly jobless claims were 199K, broadly in line with forecasts. Could hotter inflation further reduce room for rate cuts, and what does it mean for $BTC, US stocks, and gold?

GateWCTCS9GlobalTradingCompetition

37.87k Views6.68k Discussing

GateBTCAndETHFuturesVolumeRanksTop3

53.8k Views1.81k Discussing

View More