











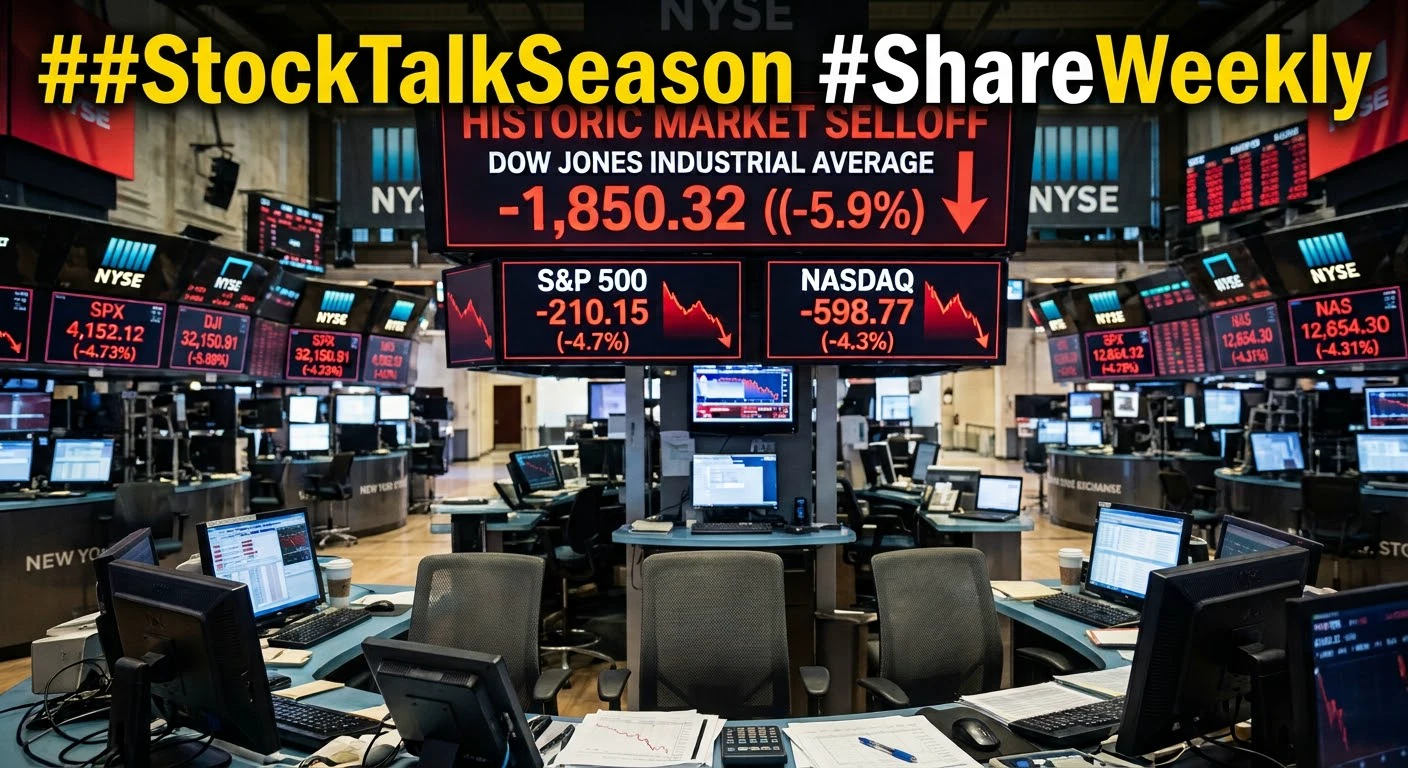


Why did a week of risk aversion shake the stock markets so severely?
U.S. stocks ended the week with significant losses; the Nasdaq experienced its sharpest weekly decline in months, and the "fear index" (VIX) surged by as much as 70% on Thursday, climbing above the 28 level. Meanwhile, bond yields rose toward the end of the week, settling around 4.85%, and the U.S. dollar strengthened. Conversely, gold and silver saw their strongest weekly performance in months, closing with gains of approximately 4% and over 5%, respectively.
What does a "week of risk aversion" mean?
The events on Wall Street this past week can be summarized in a single sentence: the market repriced risk. U.S. stocks closed the week with broad losses; the S&P 500 fell by approximately 2.7%, while the Nasdaq suffered its worst week in months, dropping 3.4%. The turning point arrived on Thursday, when a sell-off in artificial intelligence and semiconductor stocks triggered the sharpest single-day decline for the index since the spring of 2025, causing trillions of dollars in market capitalization to evaporate in a single day.
The reasons behind this are not merely technical—they are political. The shift in control of Congress following the midterm elections held earlier in the week led investors to question the future of spending on artificial intelligence infrastructure. As confidence in the growth narrative surrounding data centers wavered, stocks with the most inflated valuations faced the heaviest selling, while forced liquidations by leveraged funds turned the downturn into a full-blown panic. What you need to watch is whether this marks the end of a trend or is merely a correction. The attempt by AI-related stocks to recover on Friday suggests that the selling pressure is not entirely one-sided. It is too early to say whether the indices have bottomed out; however, the fact that panic selling did not shift into panic buying indicates that the market remains in a state of indecision.
Why did the "price of fear" surge?
The most striking development of the week occurred in the volatility index—often referred to as the "fear index." On Thursday, it spiked by approximately 70%, climbing above the 28 level—the highest reading seen in months. In simple terms, this means investors were willing to double the premiums they pay for instruments that act as insurance for their portfolios.
The impact of this surge in volatility is indirect yet profound. A high "fear premium" prompts market makers to trim their positions, leads funds to lower their risk limits, and results in an overall reduction in liquidity. We saw a clear manifestation of this in the crypto space: on that same day, hundreds of millions of dollars in leveraged long positions were liquidated, a wave that dragged Bitcoin down from above $80,000 to the $75,000 range.
The key indicator to monitor is the level at which the fear index eventually stabilizes. Sharp, single-day spikes are often reversed; however, if the index remains at elevated levels, it suggests that the market environment has not yet cleared, and any rally in risk assets will be met with skepticism.
How did the interplay between interest rates and the dollar unfold?
Throughout the week, the bond market told two distinct stories. Mid-week, a flight to safety—triggered by a sell-off in equities—pushed interest rates lower; however, a strong employment report released on Friday reversed this dynamic. The addition of 165,000 new jobs drove bond yields back up, with the 10-year benchmark yield settling around 4.85%, while the dollar also ended the week on a strong note.
For crypto investors, this shift is significant: both interest rates and the dollar serve as inverse indicators of risk appetite. When interest rates rise and the dollar strengthens, the appeal of non-yielding assets diminishes, the cost of leverage increases, and institutional capital tends to migrate toward safer havens. Indeed, Bitcoin spot funds saw outflows exceeding a billion dollars last week—a clear, tangible sign of weakening institutional demand.
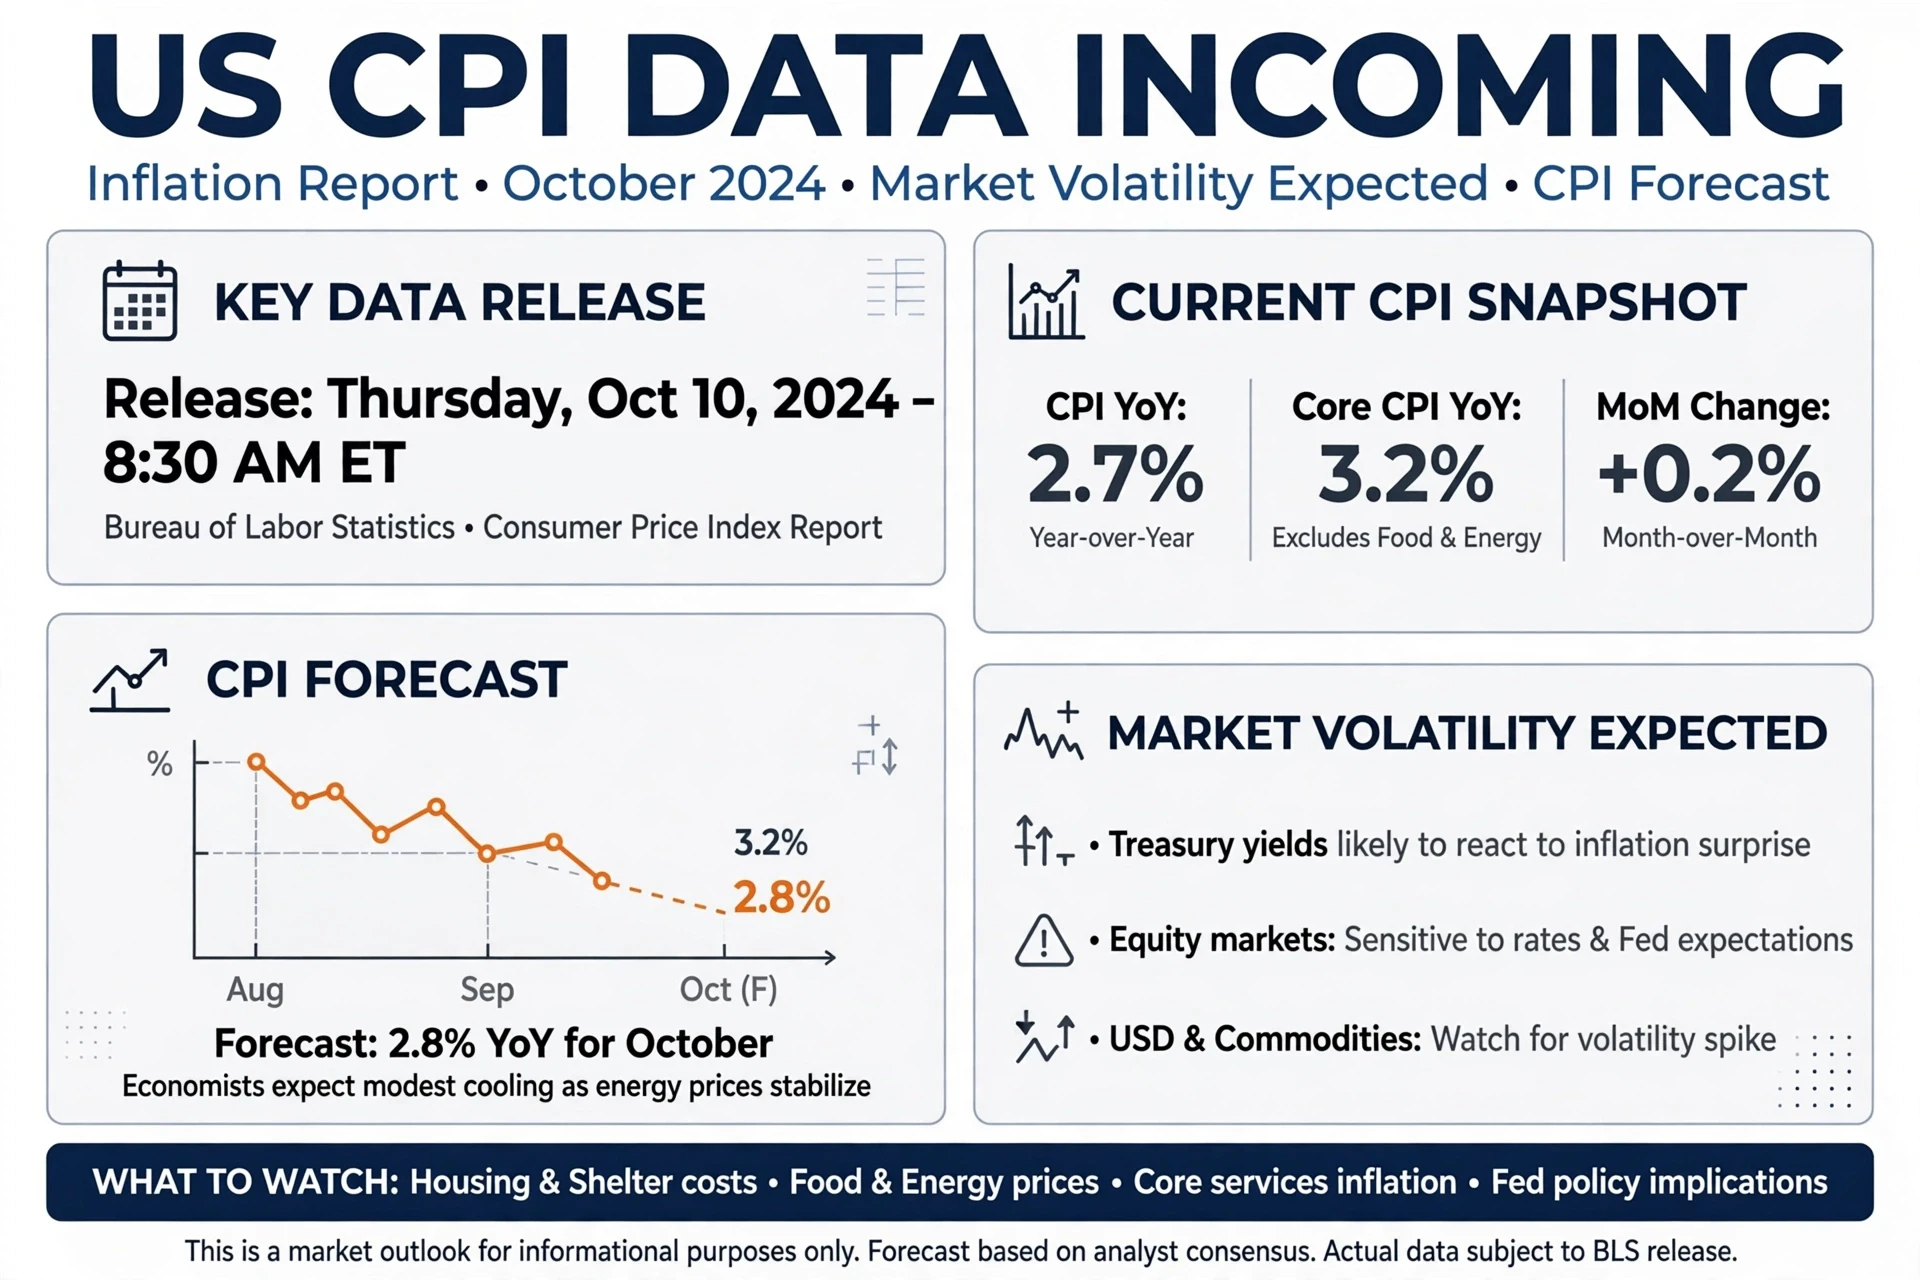
All eyes are now on Tuesday’s CPI data. Economists anticipate that annual inflation will climb from 3.7% to approximately 3.9%. Should this figure materialize, a December interest rate hike would become all but certain, keeping pressure on both bond yields and the dollar. Conversely, if inflation comes in surprisingly low, this pressure could ease, providing some breathing room for risk assets.
Why did gold and silver rise simultaneously?
The surprise stars of the week were, without a doubt, precious metals. Gold closed the week with a gain of approximately 4%, settling above the $4,000 threshold, while silver topped the performance list with an increase of over 5%. This marked their strongest week in months. The rise in gold—occurring alongside falling stocks, a surging "fear index" (volatility index), and rising interest rates—defies conventional wisdom; typically, high interest rates are the arch-nemesis of gold, an asset that yields no interest.
So, why the rally? The answer lies in a shift in capital flows. Investors moved funds pulled from equities not into other stocks, but into tangible assets. This was bolstered by central banks, which, as revealed in data released this week, continued to purchase gold at record levels during the third quarter. A broad spectrum of investors—from family offices to massive institutional funds—simultaneously sought a "safe haven," pushing prices higher despite the headwinds from rising interest rates. The sharper rally in silver, meanwhile, reflects both safe-haven demand and industrial demand.
The key question now is whether the $4,000 level will serve as a pivotal turning point for gold. If this level holds, the thesis of a rotation into safe-haven assets gains weight; however, should interest rates climb even further, maintaining this resistance level will become increasingly difficult. The takeaway here is that the rise in precious metals should be viewed not as mere "hype," but as a defensive reflex aimed at portfolio protection.
What about Bitcoin?
This week, crypto failed to fit into either the "safe-haven" category or the role of a bellwether for risk appetite. Bitcoin fell in tandem with the sell-off in equities, and unlike gold, it failed to rally. The wave of billion-dollar outflows from institutional funds has once again put the "digital gold" narrative to the test this week—and the results were not encouraging. During this week of fear, institutional capital flowed into commodities and bonds rather than the blockchain.
To understand why, one must view Bitcoin as a liquidity-sensitive asset. As the likelihood of the Federal Reserve tightening policy increases, the supply of borrowed capital in the market shrinks; consequently, speculative, long-horizon assets are the first to be sold off. Bitcoin is currently defending the $75,000 support level. If this threshold holds, the bearish scenario is deferred; if it is lost, the $73,000 level—followed by the $70,000–$72,000 range—emerges as the next potential destination.
In the crypto space, there are two key factors to watch: first, whether the direction of institutional fund flows shifts this week; and second, whether Tuesday’s inflation data can revive risk appetite. The debate over whether Bitcoin acts as a "safe haven" or a "risk asset" cannot be settled in a single week—but this week’s outcome clearly leans toward the latter.
What is the lesson for the individual investor?
Looking at the week as a whole, the picture is clear: we are witnessing a global "flight to safety." Equities are being sold, metals are being bought, the dollar and interest rates are strengthening, and crypto finds itself caught in the crossfire. In weeks like this, the costliest mistake is to gauge the entire market based on the movement of a single asset. Assuming a "safe-haven" rush simply because gold is rising, predicting a market collapse because stocks are falling, or declaring a final verdict because Bitcoin is being sold—these are all hasty reactions, and they all stem from the same error: losing sight of the broader context.
The lesson for you is this: build your portfolio based on its inherent resilience, not on the direction of the wind. Periods of "risk-off" sentiment are times when the correlations between all assets approach one—meaning everything falls in tandem; it is precisely during such weeks that the true value of diversification becomes clear. Furthermore, keep a close eye on the economic calendar; the CPI data on Tuesday, followed by the Federal Reserve’s December decision, will be the defining moments that set the market's direction. During these periods, leverage is the first thing to evaporate in the face of volatility—manage your margin accordingly.
Finally, bear in mind this reality: risk-off phases do not last forever, and the most aggressive rallies often follow the darkest weeks. However, do not mistake "often" for "always." Your task today is not to predict the future, but to accurately interpret the current landscape and ensure that, regardless of which scenario unfolds, your positions remain resilient.
This content is for informational purposes only and does not constitute investment advice.
$BTC $XAU $XAG $US500 $US30
#USCPIDataIncoming
#USAIStocksHitHard
#USNonfarmPayrolls
#StockTalkSeason
#ShareWeekly
U.S. stocks ended the week with significant losses; the Nasdaq experienced its sharpest weekly decline in months, and the "fear index" (VIX) surged by as much as 70% on Thursday, climbing above the 28 level. Meanwhile, bond yields rose toward the end of the week, settling around 4.85%, and the U.S. dollar strengthened. Conversely, gold and silver saw their strongest weekly performance in months, closing with gains of approximately 4% and over 5%, respectively.
What does a "week of risk aversion" mean?
The events on Wall Street this past week can be summarized in a single sentence: the market repriced risk. U.S. stocks closed the week with broad losses; the S&P 500 fell by approximately 2.7%, while the Nasdaq suffered its worst week in months, dropping 3.4%. The turning point arrived on Thursday, when a sell-off in artificial intelligence and semiconductor stocks triggered the sharpest single-day decline for the index since the spring of 2025, causing trillions of dollars in market capitalization to evaporate in a single day.
The reasons behind this are not merely technical—they are political. The shift in control of Congress following the midterm elections held earlier in the week led investors to question the future of spending on artificial intelligence infrastructure. As confidence in the growth narrative surrounding data centers wavered, stocks with the most inflated valuations faced the heaviest selling, while forced liquidations by leveraged funds turned the downturn into a full-blown panic. What you need to watch is whether this marks the end of a trend or is merely a correction. The attempt by AI-related stocks to recover on Friday suggests that the selling pressure is not entirely one-sided. It is too early to say whether the indices have bottomed out; however, the fact that panic selling did not shift into panic buying indicates that the market remains in a state of indecision.
Why did the "price of fear" surge?
The most striking development of the week occurred in the volatility index—often referred to as the "fear index." On Thursday, it spiked by approximately 70%, climbing above the 28 level—the highest reading seen in months. In simple terms, this means investors were willing to double the premiums they pay for instruments that act as insurance for their portfolios.
The impact of this surge in volatility is indirect yet profound. A high "fear premium" prompts market makers to trim their positions, leads funds to lower their risk limits, and results in an overall reduction in liquidity. We saw a clear manifestation of this in the crypto space: on that same day, hundreds of millions of dollars in leveraged long positions were liquidated, a wave that dragged Bitcoin down from above $80,000 to the $75,000 range.
The key indicator to monitor is the level at which the fear index eventually stabilizes. Sharp, single-day spikes are often reversed; however, if the index remains at elevated levels, it suggests that the market environment has not yet cleared, and any rally in risk assets will be met with skepticism.
How did the interplay between interest rates and the dollar unfold?
Throughout the week, the bond market told two distinct stories. Mid-week, a flight to safety—triggered by a sell-off in equities—pushed interest rates lower; however, a strong employment report released on Friday reversed this dynamic. The addition of 165,000 new jobs drove bond yields back up, with the 10-year benchmark yield settling around 4.85%, while the dollar also ended the week on a strong note.
For crypto investors, this shift is significant: both interest rates and the dollar serve as inverse indicators of risk appetite. When interest rates rise and the dollar strengthens, the appeal of non-yielding assets diminishes, the cost of leverage increases, and institutional capital tends to migrate toward safer havens. Indeed, Bitcoin spot funds saw outflows exceeding a billion dollars last week—a clear, tangible sign of weakening institutional demand.
All eyes are now on Tuesday’s CPI data. Economists anticipate that annual inflation will climb from 3.7% to approximately 3.9%. Should this figure materialize, a December interest rate hike would become all but certain, keeping pressure on both bond yields and the dollar. Conversely, if inflation comes in surprisingly low, this pressure could ease, providing some breathing room for risk assets.
Why did gold and silver rise simultaneously?
The surprise stars of the week were, without a doubt, precious metals. Gold closed the week with a gain of approximately 4%, settling above the $4,000 threshold, while silver topped the performance list with an increase of over 5%. This marked their strongest week in months. The rise in gold—occurring alongside falling stocks, a surging "fear index" (volatility index), and rising interest rates—defies conventional wisdom; typically, high interest rates are the arch-nemesis of gold, an asset that yields no interest.
So, why the rally? The answer lies in a shift in capital flows. Investors moved funds pulled from equities not into other stocks, but into tangible assets. This was bolstered by central banks, which, as revealed in data released this week, continued to purchase gold at record levels during the third quarter. A broad spectrum of investors—from family offices to massive institutional funds—simultaneously sought a "safe haven," pushing prices higher despite the headwinds from rising interest rates. The sharper rally in silver, meanwhile, reflects both safe-haven demand and industrial demand.
The key question now is whether the $4,000 level will serve as a pivotal turning point for gold. If this level holds, the thesis of a rotation into safe-haven assets gains weight; however, should interest rates climb even further, maintaining this resistance level will become increasingly difficult. The takeaway here is that the rise in precious metals should be viewed not as mere "hype," but as a defensive reflex aimed at portfolio protection.
What about Bitcoin?
This week, crypto failed to fit into either the "safe-haven" category or the role of a bellwether for risk appetite. Bitcoin fell in tandem with the sell-off in equities, and unlike gold, it failed to rally. The wave of billion-dollar outflows from institutional funds has once again put the "digital gold" narrative to the test this week—and the results were not encouraging. During this week of fear, institutional capital flowed into commodities and bonds rather than the blockchain.
To understand why, one must view Bitcoin as a liquidity-sensitive asset. As the likelihood of the Federal Reserve tightening policy increases, the supply of borrowed capital in the market shrinks; consequently, speculative, long-horizon assets are the first to be sold off. Bitcoin is currently defending the $75,000 support level. If this threshold holds, the bearish scenario is deferred; if it is lost, the $73,000 level—followed by the $70,000–$72,000 range—emerges as the next potential destination.
In the crypto space, there are two key factors to watch: first, whether the direction of institutional fund flows shifts this week; and second, whether Tuesday’s inflation data can revive risk appetite. The debate over whether Bitcoin acts as a "safe haven" or a "risk asset" cannot be settled in a single week—but this week’s outcome clearly leans toward the latter.
What is the lesson for the individual investor?
Looking at the week as a whole, the picture is clear: we are witnessing a global "flight to safety." Equities are being sold, metals are being bought, the dollar and interest rates are strengthening, and crypto finds itself caught in the crossfire. In weeks like this, the costliest mistake is to gauge the entire market based on the movement of a single asset. Assuming a "safe-haven" rush simply because gold is rising, predicting a market collapse because stocks are falling, or declaring a final verdict because Bitcoin is being sold—these are all hasty reactions, and they all stem from the same error: losing sight of the broader context.
The lesson for you is this: build your portfolio based on its inherent resilience, not on the direction of the wind. Periods of "risk-off" sentiment are times when the correlations between all assets approach one—meaning everything falls in tandem; it is precisely during such weeks that the true value of diversification becomes clear. Furthermore, keep a close eye on the economic calendar; the CPI data on Tuesday, followed by the Federal Reserve’s December decision, will be the defining moments that set the market's direction. During these periods, leverage is the first thing to evaporate in the face of volatility—manage your margin accordingly.
Finally, bear in mind this reality: risk-off phases do not last forever, and the most aggressive rallies often follow the darkest weeks. However, do not mistake "often" for "always." Your task today is not to predict the future, but to accurately interpret the current landscape and ensure that, regardless of which scenario unfolds, your positions remain resilient.
This content is for informational purposes only and does not constitute investment advice.
$BTC $XAU $XAG $US500 $US30
#USCPIDataIncoming
#USAIStocksHitHard
#USNonfarmPayrolls
#StockTalkSeason
#ShareWeekly