
Square
Following
Hot
News
Profile
Share your thoughts
placeholder
Article
$SNDK
Key levels respected; bounced from the $1,279.29/share support zone
I will only pick this at $995.69/share, or I leave it
#NFA
SNDK-0.56%
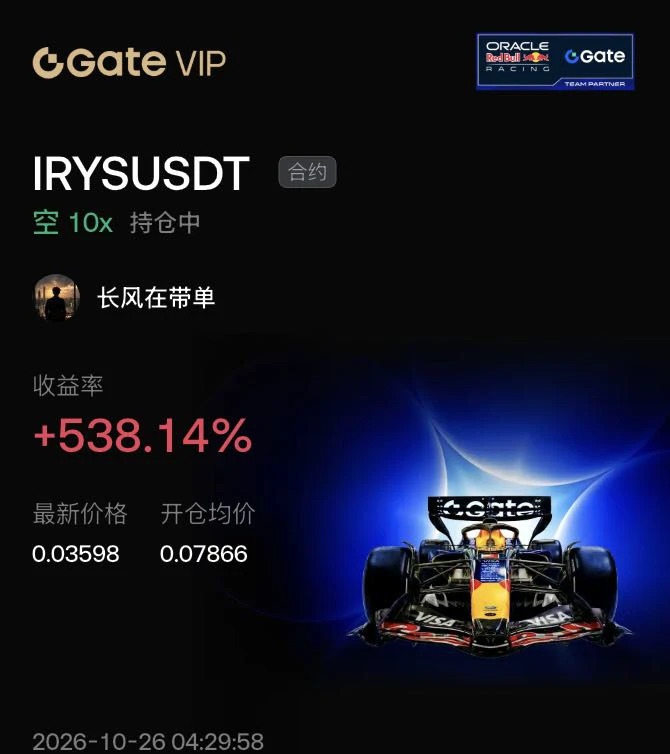
$MARSCOIN is currently in a high-volatility, weak-trend phase. Conclusion first: short-term bias is bearish; chasing longs is not recommended. If it rebounds to around 0.0782, a small short position may be cautiously attempted, but a hard stop-loss must be used.
The reasoning is as follows. MARSCOIN is currently at 0.0772, down 5.04% over 24h, with the amplitude over 30 candles reaching as high as 15.93%. Its volatility is significantly higher than BTC's 3.44%, making it a typical high-risk asset. In terms of moving averages, MA5=0.07824 remains above MA20=0.07621, so the apparent bullish ali
post-image
MARSCOIN-6.36%
BAT+28.99%
BTC+0.94%
$ZEC The altcoin king is a money printer—stay steady, hold spot through the bull market. It feels incredible
ZEC+9.33%
I’ve been watching $81K on Bitcoin. This week it tested that level, and then some.
On Tuesday, Korean stocks fell 5.5%. Bitcoin dipped to about 81,040 on Gate, then climbed back above $83K within hours. On Wednesday evening it slid again, and that drop has the heaviest volume on my chart. It fell to around 81.6K.
The 24h low on Gate now shows 79,795. So at some point in the last day it went under my line. Right now it’s back around 82.3K.
I can’t see that dip on the candles I’m looking at, so I don’t know how long it stayed down or how fast it came back.
My read: the line didn’t hold cleanly,
post-image
BTC+0.94%
$ICNT Up 21% in half a day, it surged straight from 0.1015 to 0.1371, with 13.7M in trading volume pouring in. That’s not the kind of volume retail investors can generate. I took a quick look on-chain just now: the top 10 addresses’ holding concentration hasn’t declined, indicating this move is not distribution but someone accumulating. On the macro side, here’s an anchor: during the week when the Fed minutes leaned hawkish, the 30-day correlation between altcoins and the Nasdaq surged to 0.78. Small-cap assets like ICNT have higher beta, so as long as rate-hike expectations don’t rebound, it
ICNT+25.77%
The anticipated script has played out in full; precision is never just empty talk.
With the skills to match, any market conditions can be handled with ease; no matter how complex the market fluctuations, every move can hit the mark.
Nine years of dedicated experience and accumulated expertise are the strongest foundation for establishing oneself in this market.
$BTC #Solana大升级定档
BTC+0.96%
We are getting closer to $4M in fees per day on Hyperliquid again.
Add the $500k from the yield reserve and we are already there
post-image
HYPE+1.66%
The answer is always hidden in the process that time brings. I’ve already made it extremely clear—the hints have been laid out plainly. Since June, it has felt exactly like hitting whatever I aim at and winning every battle; there’s only one word for it: “awesome”!
$BTC #美国9月CPI超预期
BTC+0.96%
Which step is $CRCLB’s latest rally most likely to fool you on?
$CRCLB There is a very typical debate right now: one side uses +8.96% over 24 hours to prove the direction, while the other counters with key levels. I’m not taking sides based on the rise or fall for now, because $CRCLB remains strong, while the crowded positioning is already out in the open and has yet to provide a complete answer. I acknowledge that the trend is strong, but what matters next is not how much higher it can surge, but whether anyone steps in during the first pullback.
Laying out the chart, the current price is 86.
post-image
Besides $BTC
, which cryptocurrency is most suitable for long-term holding?
● $HYPE ● $TAO ● NEAR
post-image
BTC+0.94%
HYPE+1.66%
TAO+2.94%
Short-Selling Analysis of the Biggest Decliners: Real wealth is hidden in the red candlesEveryone is mesmerized by green candlesticks. Chasing pumps, chasing hot trends. But where is the real opportunity? It is right in front of you—in the red candles. Most people are too afraid to touch them. These four coins are weakening sharply. The market structure has already broken down. Sellers are fully in control. This is not a pullback, but a trend. Smart money positioned itself long ago. I have carefully examined every chart. No hype, just letting the charts speak. $TRUT
Risk level: HighEntry price
post-image
Gold is finally dropping the act. As soon as PPI heats up, it runs faster than anything else. For example, in one U.S. PPI release, the year-over-year increase came in above expectations, core PPI also rose month over month, and the energy and transportation services components heated up together. Less than half an hour after the data came out, spot gold shot straight up from the intraday low, quickly expanding its gain to more than 1%, while COMEX gold futures volume suddenly surged. At the same time, the U.S. Dollar Index weakened, the 10-year Treasury yield fell, and as real rates eased, it
post-image
GLDX+1.91%
PAXG+1.38%
XAU+1.52%
XAG+3.28%
XCU-0.86%
$NEAR NEAR Breaks Out of a 4-Year Descending Channel: TP1: $11
NEARUSDT
Weekly Time Frame:
NEAR (1W, log scale) is breaking out of the descending channel that has defined price action since the 2022 top, and the weekly candle is now pushing above the upper boundary.
What the chart shows:
After the 2022 high (~20.6), price spent years in a descending channel, bottoming around the 0.9 area in early 2026.
Since that low, price has risen sharply and is now trading at ~5.4, above the channel’s upper trendline.
The breakout is happening at the 2024 volume profile POC (~5.2), so the trendline and a h
post-image
NEAR+10.37%
$AKE I've been positioning for a long time, and it has finally taken off. I'll sell everything once it doubles.
post-image
AKE+18.84%
CPI Comes in Hotter Than Expected
live-cover
LIVE40
On watch tomorrow $MSFT $GOOGL
post-image
MSFT+1.04%
GOOGL+0.37%
Many people reflexively buy the dip as soon as they see a 15% drop in 24 hours, while ignoring broader market sentiment and sector correlation—this is the most typical trading misconception. The Fear and Greed Index is 53, neutral but leaning cautious. There has been neither panic selling nor greedy capital stepping in, so looking at a coin’s decline in isolation is meaningless at this point.
$AV Down 15.18% today, with a trading volume of only 6.2M USDT, a typical low-volume sharp drop. However, the technicals have not deteriorated: MA5=0.27448 remains above MA20=0.26686, so the medium-term
post-image
XPL+6.22%
#Bitcoin Golden Cross loading.
You know what this means...
post-image
BTC+0.94%
BTC UPDATE
live-cover
LIVE71
With the same 1000U, some people are holding the bag at $WAL 0.0677, while others who bottom-fished at 0.0502 are already laughing. It is now 0.0512, down 15.7% in 24 hours, with a 565M trading volume—what does that indicate? Panic sellers are fleeing, but with selling this fierce, who is taking the other side?
Round one: the volume showdown. A 565M trading volume at this market-cap level means the turnover rate has been pushed to the limit. Rising volume during a decline either means the main players are unloading or that the market is shaking out and rotating holders. What is the difference
WAL-19.52%
Load More

Join 40 M users in our growing community

⚡️ Join 40 M users in the crypto craze discussion

💬 Engage with your favorite top creators

👍 See what interests you

Trending Topics

USSeptemberPPIBeatsExpectations

91.35k Views1.88k Discussing

US September PPI came in at 6.3% YoY, well above the 5.3% market expectation, pointing to renewed producer-side inflation pressure. Weekly jobless claims were 199K, broadly in line with forecasts. Could hotter inflation further reduce room for rate cuts, and what does it mean for $BTC, US stocks, and gold?

DrLinHanSpeaksAtOxfordUnion

135.63k Views1.86k Discussing

JapanAndKoreaStocksPlunge

47.27k Views1.76k Discussing

View More