Square
Following
Hot
News
Notifications
Profile

K2Carry

vip
No content yet
Peak Tier VIP 45.7 Year(s)
7
Following
55
Followers
69
Liked
💎 November 13 Market Analysis: The Truly Worthwhile Entry Point Has Finally Arrived
bitcoin:native fell to around 68,528 today, and is currently fluctuating around 68,600, down nearly 7% in 24 hours.
After losing 72,200 yesterday, the market did not linger there for long and went straight to the core accumulation zone we had previously mapped out:
✅ 67,750–69,100
✅ 200-week moving average at around 67,999
So the biggest difference between today and yesterday is:
Yesterday, price was merely approaching support; today, it has truly entered a valuable area on the higher timeframes.
But I want to
BTC-0.67%
ETH-1.26%
UNI+3.05%
AAVE-1.22%
INJ-1.67%
U.S. spot Bitcoin ETFs have seen cumulative net outflows of about $1.42 billion through November 11, 2026. The same period last year saw net inflows of about $25.2 billion.
Across 8 trading days in November, outflows totaled about $1.88 billion, with IBIT alone accounting for about $1.77 billion. But IBIT is still positive for the year, at about +$2.45 billion; dragging the total into negative territory are Fidelity’s FBTC (about -$1.9 billion) and legacy GBTC (about -$2.9 billion).
On November 11, Morgan Stanley’s MSBT was the only fund to see inflows, at about $9 million. It launched this ye
BTC-3.45%
GBTC-3.49%
💎 November 12 Market Outlook: This Is Not Just a Pullback—bitcoin:native Is Determining the Direction of the Next Phase
🟠 $BTC Where exactly are we now?
$ BTC has already fallen below:
• Weekly Bollinger Bands middle line: approximately 74,271
• 50-week moving average: approximately 75,177
• Daily EMA20: approximately 76,967
• 4H EMA20: approximately 74,060
But it remains above the 200-week moving average at approximately 68,018.
So the current market structure is clear:
The short- and medium-term levels have broken down, but the major support level has not yet given way.
72,200–73,150 is th
BTC-0.67%
ETH-1.26%
UNI+3.05%
AAVE-1.22%
INJ-1.67%
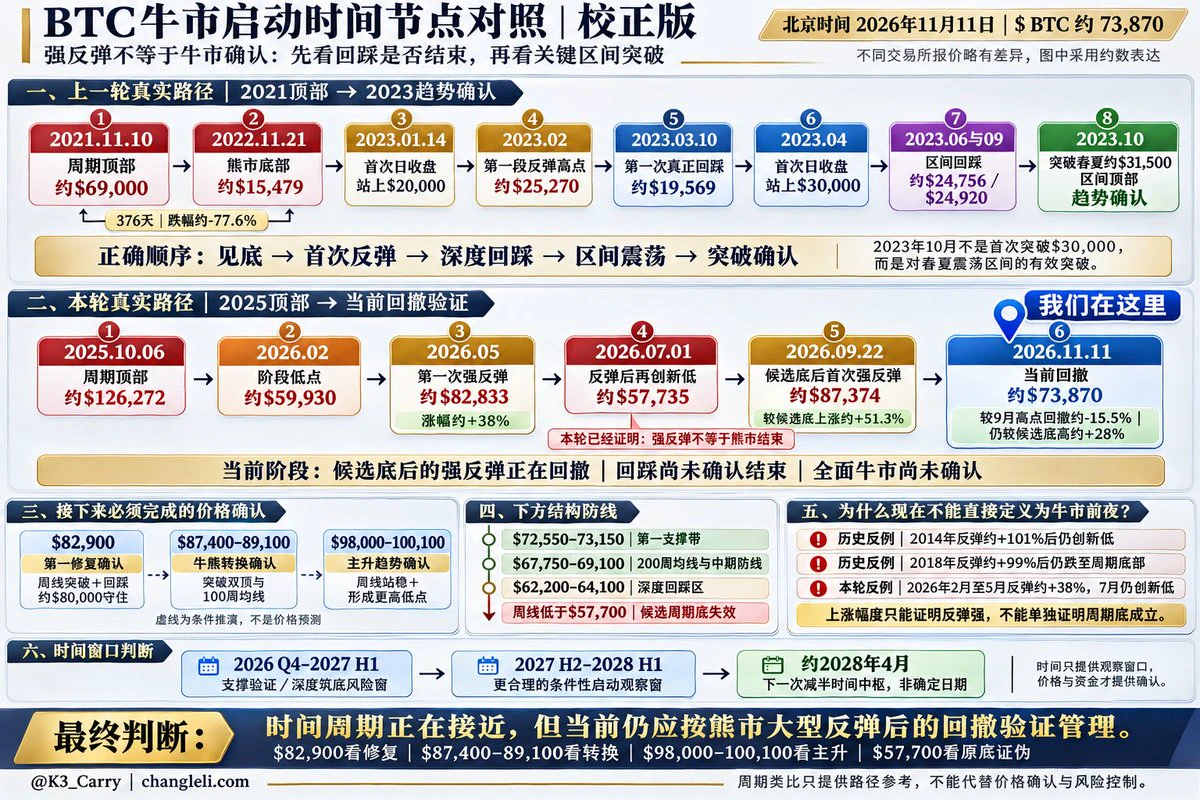
$BTC The next bull market may be closer than most people think.
The current market is gradually approaching that familiar phase,
and when we break down the real starting point of the previous bull market, we find:
the previous bull market did not take off directly from the bottom.
📍 November 2022: Fell to $15,479, forming the bear market bottom
📍 January 2023: Reclaimed $20,000
📍 February 2023: Rebounded to $25,270
📍 March 2023: Retested $19,569
📍 April 2023: Broke above $30,000 for the first time
📍 June and September 2023: Returned to consolidate around $25,000 twice
📍 October 2023: B
post-image
BTC-0.67%
  • 3
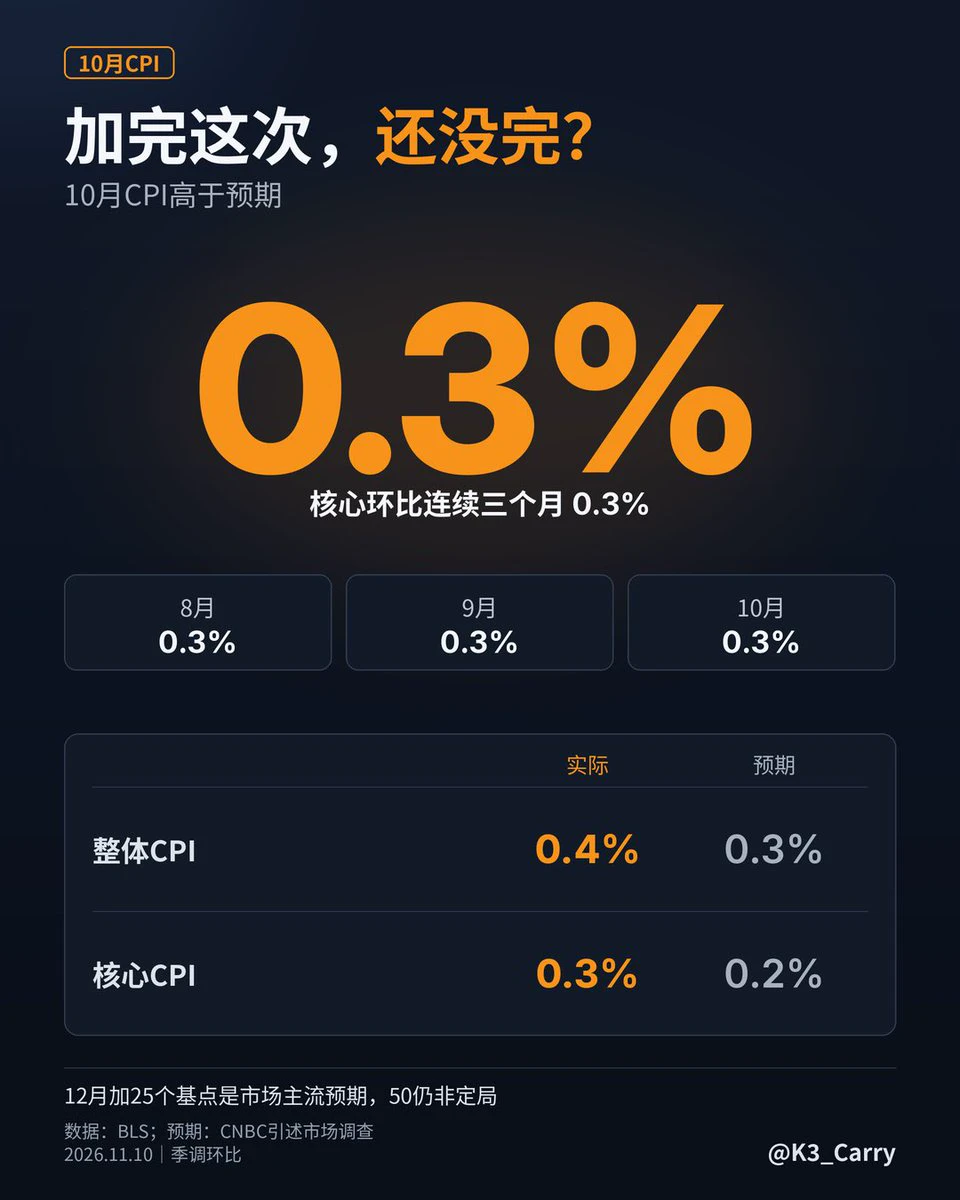
The 25-basis-point hike is already priced in. The truly painful part is that this may not be over after this hike.
Tonight, core #CPI rose 0.3% for the third consecutive month, above expectations. Before the data came out, Waller said that at this level, a 50-basis-point hike should be considered in December.
But I’m more concerned about another question: Is the market braced for one hit in December, or more of the same next year?
First, the data:
Headline CPI rose 0.4% month over month, versus expectations of 0.3%.
Core CPI rose 0.3% month over month, versus expectations of 0.2%.
Core inflat
GAS+0.00%
BTC-0.67%
The 25-basis-point hike is already priced in. The real pain is this: even after this hike, it may not be over.
Core #CPI rose 0.3% for the third consecutive month tonight, above expectations. Before the data came out, Waller had said that at this level, a 50-basis-point hike in December should be considered.
But I’m more concerned about another question: Is the market bracing for one hit in December, or more hits next year?
First, the data:
Headline CPI rose 0.4% month over month, versus expectations of 0.3%.
Core CPI rose 0.3% month over month, versus expectations of 0.2%.
Core CPI has been
post-image
GAS+0.00%
BTC-0.67%
Strategy raised $283.8 million by selling common stock last week (November 2–8), and used $81.9 million to buy coins.
Another $188.3 million went toward repurchasing its own preferred stock, STRC, and $13.6 million was placed in what it calls “USD Cash.”
This week it bought 1,036 BTC at an average price of $79,012; it now holds 850,364 BTC at an average cost of $75,456 (including fees). If BTC falls below $75,456, the market value of this stash will be below its purchase cost. This is just a comparison of market value and cost, not an accounting impairment or a measure of the company’s net ass
STRC+0.04%
BTC-0.67%
The Nasdaq plunged about 5.5% last night, wiping over $1 trillion off the US stock market’s value overnight; BTC fell from above 80k back to around 76k, and 24-hour liquidations have already reached the billion-dollar range according to multiple trackers.
Stop arguing over whether a Democratic win is bullish or bearish. The market has voted with its feet: as the regulatory narrative resurfaces, high-valuation tech gets hit first, and crypto comes along for the ride.
Nonfarm payrolls are also due tonight at 21:30. Consensus is around 65,000, with the unemployment rate in focus at 4.2%. A big he
NAS100-0.07%
BTC-0.65%
Recommend blocking the KOLs who have been calling for a rally over the past few days!
Have you ever had a trade where you made enough to change your life, only to lose even your principal in the end?
The worst part isn't losing.
It's that you really made money.
You calculated how much debt that money could pay off, and how much room it could give you to breathe.
It felt like you were just a little short of your goal.
But in the end, you had nothing to show for it and were down on the trade.
A coin, bought at 100.
At 120, you think it's just getting started.
At 150, the trend looks great.
At 180, you're already up 80%.
Someone says you should take profit. You know it too.
But yo
🔶 The trading assistant tool that understands you best
💎 1102 Intraday Market Analysis👇 At a Glance
🎯 Core strategy: Look for resistance on rebounds and act if price is rejected; reassess longs only if $BTC holds above 78,380.
🔴 $BTC: Bearish if a rebound into 77,300–77,620 is rejected; stop-loss at 78,400, with downside targets at 76,640 / 76,270 / 75,500.
1H, 4H, and daily charts are all showing weakness; the market has not yet confirmed a bottom.
🔴 $ETH : Resistance zone at 2,265–2,295; a break below 2,236 puts further downside to 2,215 in focus.
🔴 $AAVE : Rebound rejected at 128–129.5; downside targets at 124 / 120.
🔴 $NEAR: Resistance at
BTC-0.67%
ETH-1.26%
AAVE-1.22%
UNI+3.05%
ENA+8.04%
At 2 a.m., the Fed makes its rate decision, and 90% of people are betting on “no change.”
So no change isn’t bullish—it’s already priced in.
The real factors determining $BTC direction are two things👇
1️⃣ How many members vote to hike rates now
2️⃣ Whether Warsh will definitively commit to a December rate hike (the market has already priced in an 80% chance)
Too hawkish: 80,000 → 79,178; play defense first
Less hawkish than expected: wait for a move back above 81,350 before calling a breakout
Opening a big position before the rate decision is like handing your position over to Powell’s succes
BTC-0.67%
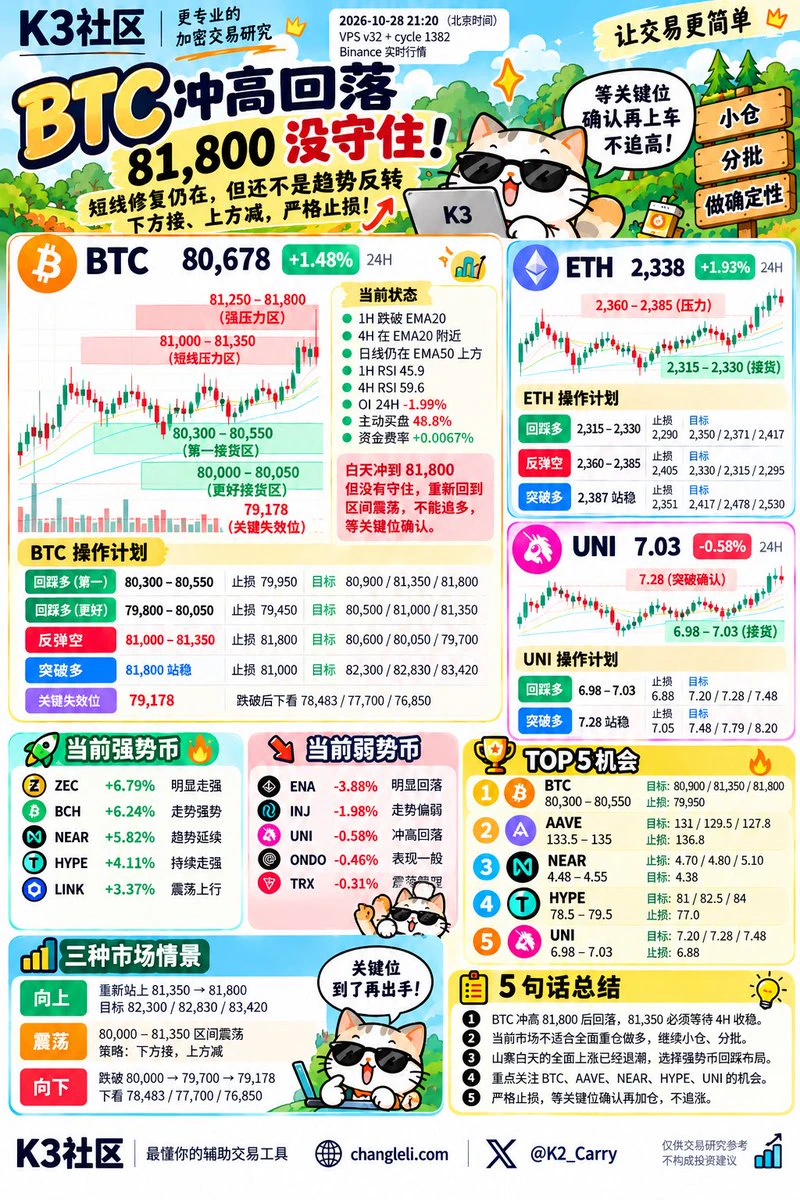
💎 10/28 Evening Market Analysis 👇 At a Glance
【What to Do Now】
$BTC Currently around 80,678.
The most important change today:
Price surged to a high of 81,800 during the day, but failed to hold.
So don't chase just because you see a breakout.
The simplest plan for tonight:
Buy the dip at 80,300–80,550
Trim first in the resistance zone at 81,000–81,350
Only chase the trend after 81,800 is firmly reclaimed
In one sentence:
The short-term recovery is still underway, but the rally failed, so treat tonight as a range-bound market again.
🔶 The trading assistant that understands you best: 🔶
——
【
post-image
BTC-0.67%
ETH-1.26%
UNI+3.05%
HYPE+0.24%
AAVE-1.22%
💎 1028 Intraday Market Analysis 👇 At a Glance
【How to Trade Now】
$BTC Currently around 80,920.
The simplest strategy now:
Buy the pullback at 80,500–80,700
Don't chase at 80,820–81,000; first see if it can hold
Only upgrade to a trend long after a genuine breakout above 81,270–81,350
In one sentence:
$BTC The short-term trend has clearly strengthened, but it cannot be called a trend reversal until 81,350 is broken.
⸻
【$BTC How to Trade】
🟢 Buy the pullback
Entry: 80,500–80,700
Stop-loss: 80,150
Targets: 81,000 / 81,350 / 82,000
Invalidation: A renewed break below 79,178 cancels this recov
BTC-0.67%
ETH-1.26%
UNI+3.05%
ZEC+1.16%
BCH+1.05%
💎 $BTC 1027 Morning Market Analysis👇 At a Glance
【How to trade the market now】
$BTC: Buy at 79,700–79,950
Stop-loss: 79,050
Targets: 80,300 / 80,700 / 81,350
$BTC Watch for resistance at 80,750–81,000.
If it fails to break through, consider shorting the rebound.
For a true trend-following entry:
Wait for 81,350 to hold.
Before 81,350 breaks out, treat all long positions as “rebound trades” only.
🔶 The trading assistant that understands you best: 🔶
【Current Market Outlook】
$BTC Currently around 80,120.
79,178 has held again, but the rebound is still not strong enough.
The 4 most importan
BTC-0.67%
ETH-1.26%
UNI+3.05%
INJ-1.67%
ZEC+1.16%
  • 1
💎 $BTC 1026 Evening Market Analysis👇 At a Glance
【How should we trade the market now?】
$BTC Currently around 80,385.
In a nutshell:
79,178 has held again, restarting the short-term rebound. But until 81,350 is broken, this should still be treated as a “rebound,” not a new uptrend.
The best approach now is not to chase prices, but to:
Buy strong coins on pullbacks, and watch for resistance when BTC reaches the pressure zone.
——
$BTC Trading Levels
Around 80.3K is the middle of the range, so it’s not a good place to chase with a large position.
🟢 Aggressive rebound entry:
80,250–80,400
St
BTC-0.67%
UNI+3.05%
INJ-1.67%
ENA+8.12%
ONDO-0.29%
💎 $BTC 1026 Midday Market Analysis👇 at a glance
【How does the market look now?】
$BTC Currently around 79,430.
Bottom line:
The market is weak right now, and BTC is testing key support. Don’t rush to buy the dip or chase shorts at the lows.
Focus on just 3 prices next:
79,178: If it fails to hold, the price may keep falling
81,350: Only a move back above this level would signal a genuine short-term turnaround
82,300: A breakout above this level would significantly improve the daily chart
Currently, $BTC has fallen back below the short-term moving averages, suggesting sellers still have the
BTC-0.65%
ENA+8.04%
TRX+0.42%
PAXG+0.37%
ETH-1.26%
💎 $BTC 1026 Market Analysis👇 At a Glance
【Trading Conclusions】
$BTC Currently around 80,583.
The market has moved from the earlier broad Risk-Off phase into an oversold rebound + selective altcoin rotation, but the $BTC 4H structure has not truly turned bullish yet.
The current trading map is very clear:
🟢 Early-entry accumulation: 80,000–80,350
🔵 4H reversal confirmation: 81,350
🟢 Clear strengthening on the daily chart: 82,300
🔴 Rebound invalidation: 79,178
In simple terms:
Until 81,350 is broken, treat this as a rebound;
A sustained move above 81,350 on the 4H confirms a genuine shor
BTC-0.65%
ENA+8.04%
ZEC+1.16%
UNI+3.05%
BNB-0.76%
Load More