Share your thoughts
placeholder
Article
I just switched the app to the background, and it suddenly plunged. Is it playing hide-and-seek with me? During the intraday drop, I saw $ONDO rebound briefly, but there was practically no volume. This smells strongly like a bull trap, so those chasing longs will probably suffer for a while. I’m not greedy—I placed a short at 0.3997, and it’s now at 0.365, securing +416.87%.

Feels really good. In this downtrend, as long as you get the direction right, you can profit while lying down. Position management: 70% has been closed, and the stop-loss on the remaining 20% will be executed as planned.
post-image
ONDO+1.29%
ETH-2.07%
BNB-0.41%
gate and gate all team thank you
Nvidia Earnings Week Creator Leaderboard Revealed!
From earnings previews to after-hours recaps, streamers shared their insights and broke down market trends through livestreams, allowing more perspectives to be heard in real time.
👑 TOP 1: KatyPaty|0.5 NVDA
🥈 TOP 2: Luzhou Wanderer|0.2 NVDA
🥉 TOP 3: Luna_Star|0.2 NVDA
🍀 Copy-Trading Lucky Winner: GateUser-3d5f71ca|0.5 NVDA
See the poster for the list of winners ranked TOP 4—10 and TOP 11—40. Congratulations to all the winning streamers and creators!
🚀 Event details: https://www.gate.com/zh/campaigns/601
NVDA-0.22%
  • 10
  • 1
A Brief Analysis of BTC’s Short-Term Trend from Dow Theory, Chan Theory, Elliott Wave Theory, Volume-Price Relationships, Order Flow, and Price Action
I. Dow Theory
Primary trend (1-hour timeframe): The primary downtrend from the historical high of 82,814 on May 6 confirmed a trend reversal in mid-August. The price began a strong rebound from the August 14 low of 62,488. After forming a double bottom at 63,979 at 03:00 on August 18, the bulls launched an epic rally. The price surged from 63,979 to the August 28 high of 81,346.95, setting a new high for the current phase, for a cumulative gain
BTC-1.40%
SanDisk $SNDK 1800 won't let me take profit. Fine, fine, fine—I'll hold until 2300 before taking profit.
post-image
SNDK+12.46%
Bad Boy Watch, Update 2, 26.9.05 (UTC+8) 9:30
Figure 1: RKLB daily chart
Little Rocket closed at 64.26 today, with an intraday high of 65.00, a low of 63.20, and a gain of 0.71%.
Little Rocket was rejected at the 10-day moving average yesterday. It is easier to fall than rise, and Little Rocket’s real upside catalyst depends on the Neutron rocket. Expectations ahead of its unveiling could bring positive sentiment to the market. Seizing this opportunity should yield decent returns.
Figure 2: GT daily chart
GT is currently above the 8u level. As long as it does not fall below 8u, there should be
CryptoPlayerWithBadIntentions
Bad Boy Watch, Part 2 Update, 26.9.04 (UTC+8) 10:50
Figure 1: RKLB daily K-line
Little Rocket closed at 63.80 today, with an intraday high of 64.90 and a low of 62.36, up 1.13%.
For now, it still appears to be trading above the yearly moving average. Yesterday, I was hoping Little Rocket would follow with a big bullish candle—how did my jinx end up boosting Big Rocket instead? Your big brother rose, so why didn't you rise as well?
Let's see how it performs tonight. First, it needs to move above the 10-day moving average, followed by the 5-day moving average crossing above the 10-day moving average. Take it step by step.
Figure 2: GT daily K-line
gt now appears to have firmly held above $8, and is now eyeing the $10 round-number level.
repost-content-media
RKLB+0.70%
GT-0.93%
$4 Signal】Long | 4H Breakout Above the Bollinger Upper Band
$4 bid-ask depth ratio 1.09, with the price breaking above the 4H Bollinger upper band at 0.0226. 4H RSI 79.45, 1H RSI 71.50, 4H MACD histogram widening and 1H histogram shortening. The current price of 0.02361 is in the upper-middle part of the 1H range, with order book imbalance at 4.19%.
🎯Direction: Long
⚡Entry/Limit Order: 0.0236100
🛑Stop Loss: 0.0233739
🚀Target 1: 0.0239641
🚀Target 2: 0.0241412
🛡️Trade Management:
- Execution strategy: After reaching Target 1, reduce the position by 50% and move the stop loss up to the brea
post-image
4+63.98%
BTC-1.40%
ETH-2.05%
SOL-1.66%
Waiting Is the Eve of a Trader’s Attack
True waiting is never idly sitting around; it is a form of clear-headed restraint. You must still keep a close eye on the market’s breathing and rhythm, never taking your eyes off the direction of the tide, while resisting the urge to let your fingers act. Every fluctuation in the market is sending a signal. Your task is to identify the part that belongs to you, rather than being led around by every splash.
Keeping those hands that always want to trade under control is a lesson in resisting compulsive urges. Meaningless entries only consume your attentio
post-image
BTC-1.45%
GT-1.21%
ETH-2.07%
While retail stares at green 15-minute candles, the daily tape for ESPORTS is bleeding red.

$ESPORTS /USDT - SHORT

Trade Plan:
Entry: 0.01468 – 0.01478
SL: 0.01518
TP1: 0.01439
TP2: 0.01417
TP3: 0.01383

Why this setup?
- The 1D trend is **bearish**—this 15m RSI (55.76) is a dead-cat bounce, not a reversal.
- 4h structure confirms SHORT with **95% confidence**—the path of least resistance is down.
- ATR (1h: 0.000187) is tight, but TP1 (0.01439) is a 2.3% drop from entry (0.01473)—momentum is compressing for a breakdown.
- Why now? The bounce is stalling at resistance (0.01478), exa
post-image
ESPORTS-0.41%
Crypto Prediction and Trading Insights
live-cover
LIVE1,574
Building an Agent can easily turn into busywork: you know the frameworks, but have no idea who to emulate for your first project.
500+ Agent use cases cover healthcare, finance, education, retail, legal services, customer support, and supply chains.
Each one typically includes a “scenario description + open-source implementation link,” making it suitable for finding comparable projects before deciding how to adapt your own.
A more effective way to get started:
Start by narrowing down an industry instead of browsing framework directories
Open the relevant open-source repository to see
post-image
I just casually hit refresh, and it dropped on its own, leaving me in a really passive position. While it was grinding along the bottom intraday, I felt something was off when I looked at that candlestick. Volume kept shrinking, but selling pressure showed no sign of easing. Every rebound was a false breakout—who can still be fooled by this kind of rhythm?

Shorted at 0.03371, now at 0.01221, with +631.69% unrealized profit. It was genuinely sluggish at first, but the move afterward feels great. This big profit is enough to keep me happy for several days.

Time for position management: I’ve
post-image
SNDK+12.46%
ADA-6.32%
👀 I’m keeping $TRUMP /USDT on my radar here.
The chart looks like it’s trying to build momentum again after that sharp flush. Price has climbed back above the short-term moving averages, but I’m not chasing the move I want to see buyers prove they can hold the breakout area.
📍 Entry Zone: $2.30 – $2.34
🎯 TP1: $2.42
🎯 TP2: $2.50
🎯 TP3: $2.58
🛑 Stop Loss: $2.24
If $2.34 holds as support, the next push toward the previous resistance zone could get interesting. ⚡
My approach: patience on the entry, partial profits on the way up, and strict risk control if the setup breaks down.
⚠️ Disclaime
post-image
TRUMP-2.00%
Everyone is staring at $HOME /USDT’s 0.0060 support, but the 4h tape just whispered a secret the crowd missed.

$HOME /USDT - SHORT

Trade Plan:
Entry: 0.00601 – 0.00603
SL: 0.00616
TP1: 0.00592
TP2: 0.00585
TP3: 0.00575

Why this setup?
Why now? The 95% confidence SHORT isn't noise—it’s a structural echo.
- 1D trend is **bearish**, and price is hugging the 0.00602 pivot like a trapdoor.
- RSI (15m) at 47.65 shows zero momentum to escape lower highs.
- ATR (1h) of 0.000057 means the squeeze is tight—targeting TP1 at 0.00592 is a 1.6% drop, but TP3 at 0.00575 is a 4.5% slide if the flo
HOME0.00%
🟢 $ONDO is quietly setting up and that’s exactly what caught my eye.
I’m not interested in the noise around this chart. The interesting part is the reclaim: price has pushed back above the short-term averages after defending the lower range. Now I’m watching whether buyers can turn this bounce into a proper continuation.
Trade Map 👇
🎯 Entry Zone: 0.3600 – 0.3650
🚀 TP1: 0.3720
🚀 TP2: 0.3800
🚀 TP3: 0.3900
⛔ Stop Loss: 0.3530
The 0.3720 area is the first real test. A clean break with volume could open the door toward the higher targets. If price loses the entry structure, I’d rather step as
ONDO+1.34%
September 5 weekend 15-minute short-term strategy:
ETH: Short around 2488-2500, take profit around 2460-2440, stop loss if it breaks above 2500. Long around 2437-2430, take profit around 2460-2485, stop loss if it falls below 2430.
BTC: Long around 79162-78787, take profit around 79686-80498, stop loss if it falls below 78500. Short around 80498, take profit around 79700-79170, stop loss if it breaks above 81000.
SOL: Short around 103.24-103.97, take profit around 101.78-100.65, stop loss if it breaks above 105.
For ETH, account for platform price spreads by entering $1-3 above or below these
ETH-2.05%
BTC-1.40%
SOL-1.66%
Good morning, recap
Yesterday’s nonfarm payrolls release sent prices straight down; the rebound this morning has been a bit of a grind
Continuing to hold OP and NVIDIA
Stay the course
OP-0.49%
NVDA+0.87%
#SKHynix
SK hynix is showing one of the strongest momentum setups in the memory and AI semiconductor space. At the current reference price of 1,278 USDT, the stock has gained roughly 7–8% over the latest 24-hour trading window. The important point is that this rally is happening while the broader market is under pressure, which suggests that capital is actively rotating toward AI infrastructure, HBM and memory stocks. Recent reports also show SK hynix gaining around 7% as the memory bid widened across the sector.
SK hynix deserves serious attention because it is not simply another semiconduct
SKHYNIX+5.94%
  • 2
Zhanan Watch, Issue 3 Update, 26.9.05 (UTC+8) 9:00
U.S. nonfarm payrolls released before the market opened last night came in significantly above expectations, increasing the probability of a rate hike in September and weighing on U.S. stocks and the cryptocurrency market. However, the overall impact appears limited for now, as the market may be waiting for the Fed’s interest rate meeting.
Figure 1: SPCX daily chart
Today’s closing price was 147.95, with an intraday high of 150.85 and a low of 147.32, down 1.2%.
Big Rocket was not affected by external factors today and traded steadily througho
CryptoPlayerWithBadIntentions
Scumbag Watch, Episode 3 Update, 26.9.04 (UTC+8) 8:30
Figure 1: SPCX daily candlestick chart
Today’s closing price was 149.74, with an intraday high of 152.30, a low of 141.05, and a gain of 6.42%.
The Big Rocket had already been showing its old-geezer vibe a few days ago, as the scumbag said, but today it finally delivered, closing with a large bullish candle.
Once the battle began today, the bulls collectively stepped up and continuously reclaimed the high ground they had previously lost. After taking the 145 high ground, they continued advancing toward 150, engaged in back-and-forth fighting around 150, and gradually pushed upward to around the 152 line. Near the close, they repeatedly retreated to around 150. Overall, the situation looks good, but we also need to pay attention to tonight’s U.S. stock market data and the upcoming long holiday break (the market will be closed on Monday). If the stock price rises sharply again tonight, some profits can be taken off the table.
The scumbag’s next move will be to reduce the position partially around 158.
Figure 2: BTC daily candlestick chart
Today’s large bullish candle further validated the scumbag’s view. Whether it can set a new high afterward will be determined by future price action. Specifically, watch the previous high at 82800 and the false-breakout level at 85500.
repost-content-media
SPCX-1.19%
BTC-1.40%
Layout for Bitcoin, Ethereum, and Dogecoin
live-cover
LIVE1,922
  • 1
#GateEventContractTradeSharingChallenge #ETH
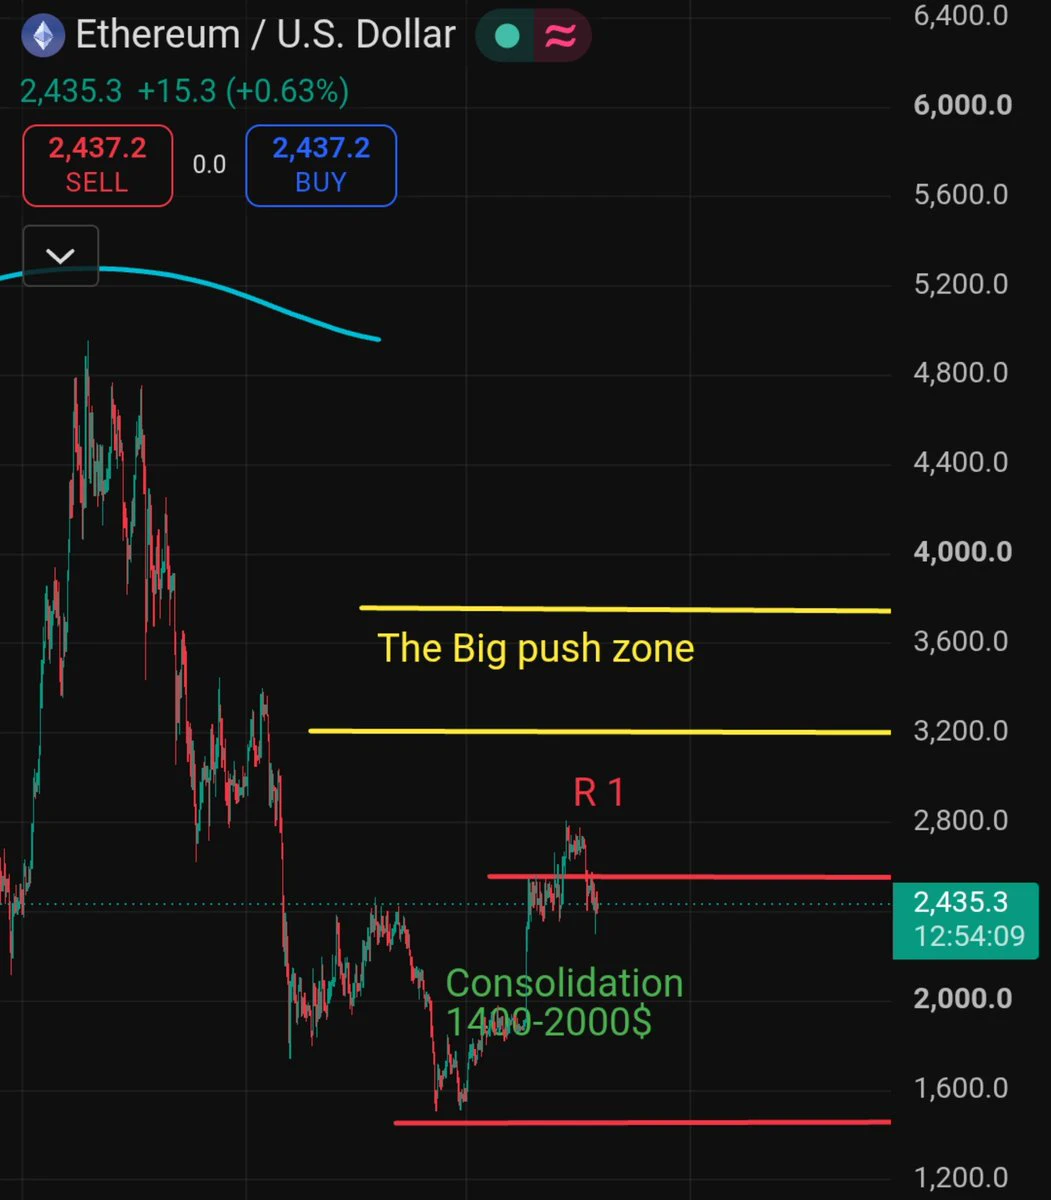
ETH is currently around $2,452, and this is becoming a very important decision zone for ETH traders. After recovering from the lower levels of the recent seven-day range, ETH is now approaching the psychological $2,500 level and the much more important $2,550–$2,560 resistance zone. From $2,452, a move to $2,500 would give roughly +2.0%, while a breakout toward $2,560 would mean around +4.4%. The real question now is whether ETH can finally break this ceiling and start another powerful upside leg.
The seven-day chart is showing a recovery and cons
post-image
ETH-2.05%
  • 4
  • 2
Load More

Join 40 M users in our growing community

⚡️ Join 40 M users in the crypto craze discussion

💬 Engage with your favorite top creators

👍 See what interests you

View More