Square
Following
Hot
News
Notifications
Profile
Share your thoughts
placeholder
Article
Everyone is waiting for a pullback, but $SKYAI keeps climbing. Is anyone actually buying these coins, or are we all just watching from the sidelines? TP: 0.04030SL: 0.03528Other coins:
$BTC : Current price 60,387.4 - 24-hour change: +1.84%
$YB : Current price 0.05398 - 24-hour change: +12.69%
post-image
SKYAI-7.58%
BTC-0.67%
YB+2.91%
Join the Gate 2026 Annual Gala: register to get 100 boost points and vote for your favorite stars of the year. For every 100 boost points you use, you get 1 draw chance(s) for a shot at surprise prizes. https://www.gate.com/competition/Annual-Gala?ref_type=165&ch=Direct&ref=BVIRBA8M$BTC ‌$ETH ‌vote for discovery gate queen 👑 discovery 👑
discovery
Join the Gate 2026 Annual Gala: register to get 100 boost points and vote for your favorite stars of the year. For every 100 boost points you use, you get 1 draw chance(s) for a shot at surprise prizes. https://www.gate.com/competition/Annual-Gala?ref_type=165&ch=Direct&ref=BVIRBA8M
repost-content-media
BTC-0.67%
ETH-1.26%
Trenches
IDOL
I
bade
b
IDOL
0x3b...ab07
Market Cap
$.
Change
.
24h Vol
$.
Holders
.
PIEVERSE
P
bade
b
PIEVERSE
0x0e...25a9
Market Cap
$.
Change
.
24h Vol
$.
Holders
.
FIONA
F
bade
b
FIONA
B34n...pump
Market Cap
$.
Change
.
24h Vol
$.
Holders
.
Singularity
S
bade
b
Singularity
7R4M...pump
Market Cap
$.
Change
.
24h Vol
$.
Holders
.
CLAUDIA
C
bade
b
CLAUDIA
2j5S...W2ZM
Market Cap
$.
Change
.
24h Vol
$.
Holders
.
#每周来晒 #Gate直通IPO第三期ANT配售92100股
Gate Direct IPO Phase 3 Allocates 92,100 ANT Shares: Another Important Step in Expanding Access to New Investment Opportunities
The latest development in Gate Direct IPO Phase 3 has attracted attention from the cryptocurrency community after the allocation of 92,100 shares of ANT. This announcement highlights the growing interest in connecting traditional financial markets with the digital asset ecosystem. Through innovative investment platforms and IPO-related services, Gate continues to explore new ways to provide users with access to emerging financial oppo
ANT-8.68%
XRP Technical Outlook: Bearish Pressure Continues as Price Tests $0.93 Support

XRP is trading around $0.9364 after another strong bearish move on the daily chart. Price has broken below the previous support structure and is trading beneath all four major EMAs. Sellers remain in control, while the $0.8619 area is now an important support zone to watch.

EMA Structure

XRP is trading below all major moving averages, confirming a bearish market structure.

- 20 EMA: $1.0502
- 50 EMA: $1.1777
- 100 EMA: $1.2374
- 200 EMA: $1.3108

The 20 EMA remains below the 50, 100, and 200 EMAs. This alignment
XRP-1.12%
$KOR 305.2 million tokens unlocking on December 4,
post-image
  • 2
#ShareWeekly #NvidiaDropsNearly14Percent
### Nvidia Drops Nearly 14% Amid Massive Stock Market Sell-Off

Nvidia (NVDA) shares plunged nearly 14% on November 20, 2026, closing at approximately $125.53 as investors rushed to sell technology stocks. The sharp decline wiped out nearly $500 billion in market value in a single trading session.

One major concern was a reported US Securities and Exchange Commission (SEC) examination of Nvidia's accounting practices. The regulatory uncertainty added pressure to the stock, which was already struggling amid concerns about expensive AI valuations and sl
NVDA-13.84%
$INFI The platform's risk warning is because 93% of token addresses have no timelock. When a sharp crash occurs, the platform can only freeze them and prevent coin deposits.
post-image
  • 3
$BLESS ’s short opportunity is here—the 1-hour downtrend isn’t over yet, and the price has already fallen below MA25 on the 15-minute chart. It’s the right time to short with the trend. The breakdown was clean and decisive, delivering a 246% gain—profits secured.
The two assets to watch closely today: $DODOX and XRP.
$BLESS remains bearish, with a tighter stop-loss. Entry range: 0.012807–0.012905; take-profit targets: 0.01210–0.0115; stop-loss at 0.013292. This rebound is weak and is most likely a bull trap ahead of the next sell-off, so bears have reason to be optimistic.
But stay alert: if
post-image
314
314314
Pump.Fun
MC:$2.19KHolders:1
0%
BLESS-2.00%
$TAO Short thesis update: 186 is a resistance zone on the 4-hour chart. Price has already hit my take-profit target, so I’m watching closely now. If a 4-hour candle closes above 189, I’ll abandon the bearish view.
The current 4-hour price is 185, below the EMA50 (193), and bears still control the momentum. The stop-loss distance is about 1.8%, with 2.9% room to the third target. If TP3 is reached, the risk-reward ratio would be around 1.6R.
Short entry range: 185.2–185.6. Staggered targets: 183.4 → 182.1 → 180.1. Structural invalidation: 188.7
Where would you place your stop loss? This is not
post-image
TAO+0.41%
#晒出我的合约收益
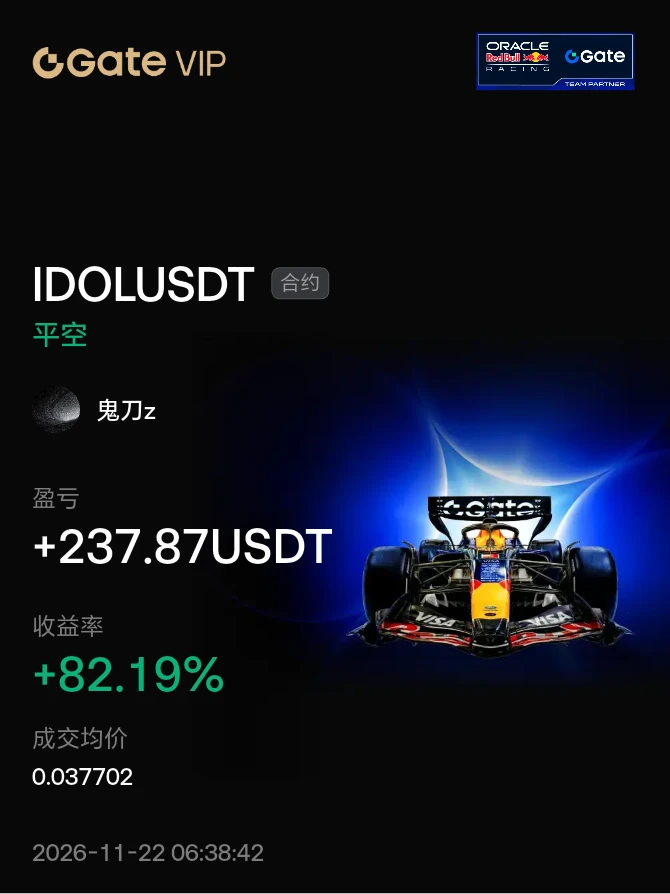
Take a small bite of IDOL
Seize the opportunity$ANT #IDOL
post-image
ANT-8.68%
  • 4
Towards the end of the week, something interesting unfolded in the markets. While stocks faced a sharp sell-off, the bond market moved in the opposite direction. The yield on the 10-year U.S. Treasury note fell by more than 10 basis points to 4.948%, while the 2-year Treasury yield dropped by over 13 basis points to 4.647%. In short, capital fleeing the stock market sought a "safe haven"—and it found one in bonds.

Why is this surprising? Because, typically, the expectation of a Federal Reserve interest rate hike pushes bond yields higher. Indeed, the market still views a rate hike in December
BTC-0.67%
GT-2.41%
SOL-0.77%
IDOL-6.71%
4STOCK-3.94%
  • 2
Market Prediction
live-cover
LIVE1,928
BTC-0.67%
BTC markets predictions
live-cover
LIVE1,744
BTC-0.67%
$IDOL The coin has reached the top zone, and I have opened a short position.🎯 Set take-profit below 0.035, and welcome to the ranks of the bears! 📉🔥
post-image
IDOL-6.71%
$IDOL This rally has entered a clear topping zone, and I’ve already entered a short position. My take-profit target is below 0.035. Those who want to short alongside me can follow suit. 📉🔥
Risk warning: The above is only a record of my personal trades and does not constitute investment advice. Contract trading carries extremely high risk, so please manage your position carefully.
post-image
IDOL-6.71%
  • 1
$XCU ‌
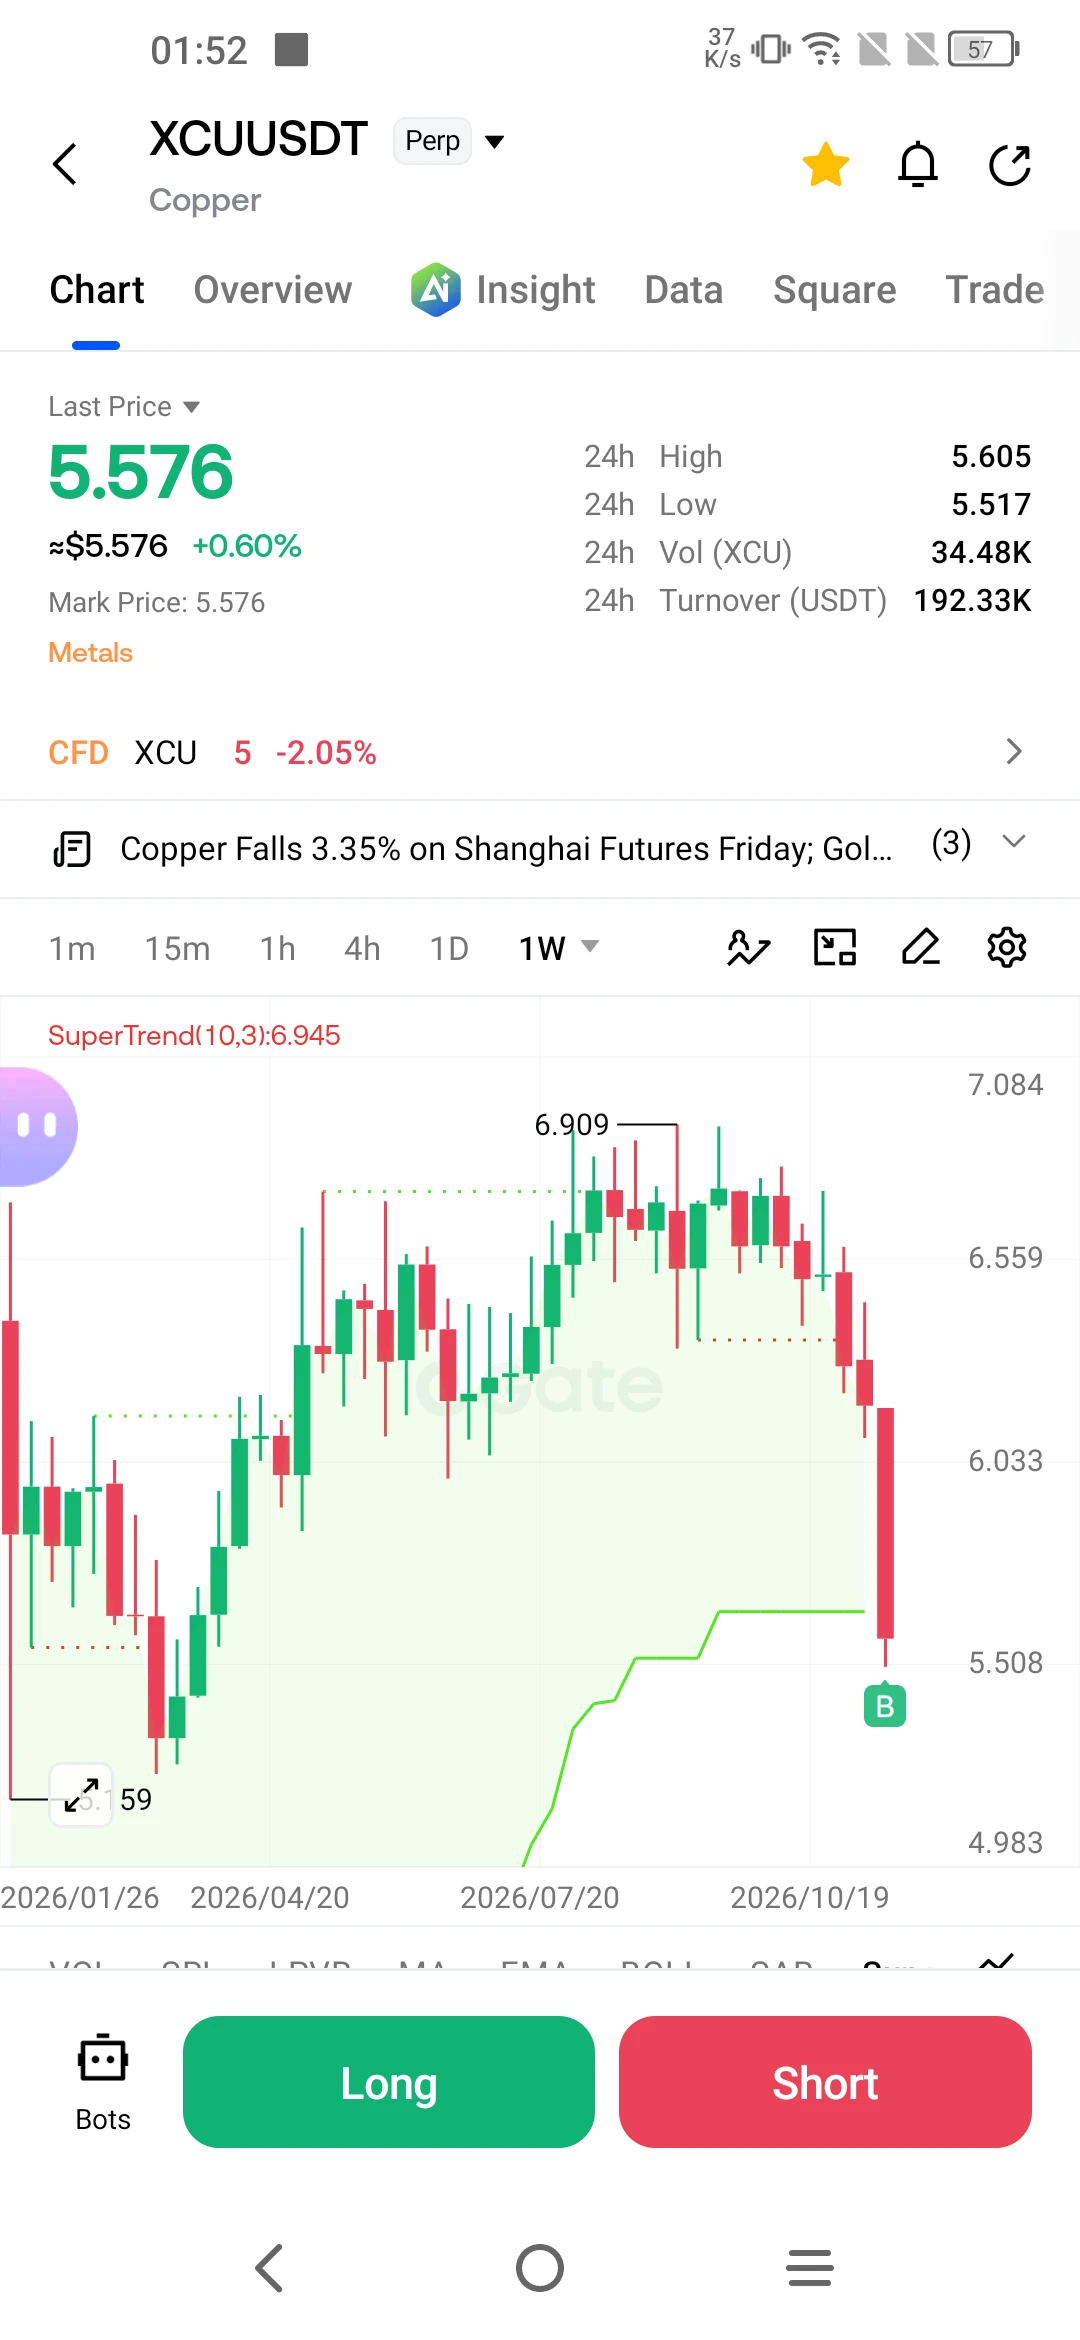
The copper market is being shaken with a speed and intensity not seen in a long time. Futures have shed more than 9% this week, marking their worst weekly performance since 2026. As clearly illustrated on the chart, prices have retreated from a peak of $6,909 to the $5,500 range. Having hit record highs in September—driven by expectations of massive demand for cabling for artificial intelligence (AI) data centers—prices are now under severe pressure as that same narrative unravels.

So, what lies behind this sudden collapse? In essence, the market is repricing the AI story, with overly
post-image
XCU+0.20%
  • 2
Okay, $SKHYNIX , we understand—the resistance level is hard to break through today. You’ve worked hard enough, and it’s time to catch your breath. Let’s see whether you have the strength to keep going or whether it’s time to call it a day. TP: 734.06SL: 796.72Other coins: $ZEC : Current price 786.23 - 24-hour change: +6.28%$PIEVERSE : Current price 3.4076 - 24-hour change: +14.87%
post-image
SKHYNIX+1.41%
ZEC+1.16%
PIEVERSE+0.58%
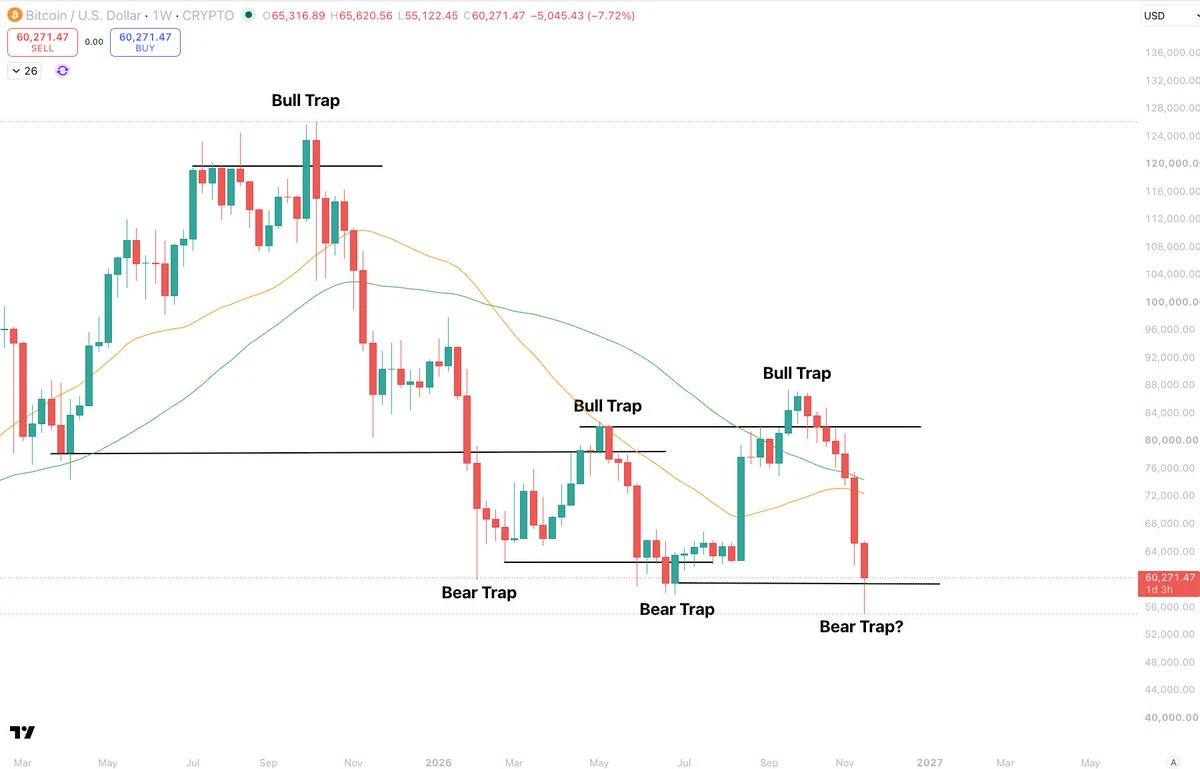
This is why the last 14 months has seemed so difficult.
We have had 6 different HTF fake-outs within that time.
Trapping and wrecking both bulls and bears.
Bitcoin has been trading sideways for 9 months, and even actually breaking structure reclaiming strong moving averages...
Only for it to be a fake-out.
It has broken technical charting rules and faked out... that's how extreme it has been.
Flipping bullish on break of structure and all moving average reclaim is wise. It has always signalled a shift.
Therefore, If you have been chopped up, you are not alone, trust me on that one.
These types
post-image
BTC-0.67%
For more than a month now, we’ve been witnessing history every day. It really leaves you wanting to cry, with nothing you can do about it.
The Nasdaq 100 $QQ peaked on 10/6. Since then, this past month has been packed with nothing but epic trading days.

From 10/6 to 10/16, $SOX fell for 9 consecutive trading days, dropping a total of 16.3% and tying its longest losing streak since listing.

On 10/29, $GOOGL plunged 12.64%, its biggest single-day drop since listing in 2004, wiping out around $500 billion in a single day.
On 10/30, INTC tumbled 28.58%, its worst day at least since 1980.
On 1
post-image
GOOGL+0.11%
#ShareWeekly market Faces Heavy Selling Pressure as Bitcoin Rebounds After a Two-Year Low

The cryptocurrency market is experiencing severe volatility following a massive sell-off across global financial markets. Bitcoin (BTC) plunged to approximately $55,251, its lowest level in two years, before recovering above $60,000. The decline reflects growing investor concerns about rising interest rates, weaker technology stocks and reduced institutional demand.

Ethereum (ETH), XRP, Solana (SOL), BNB and other major altcoins also faced significant selling pressure. The market downturn triggered bil
BTC-0.65%
ETH-1.23%
XRP-1.15%
SOL-0.77%
BNB-0.76%
Load More

Join 40 M users in our growing community

⚡️ Join 40 M users in the crypto craze discussion

💬 Engage with your favorite top creators

👍 See what interests you

Trending Topics

BTCBreaksBelow60K

2.1M Views30K Discussing

BTC fell below $60,000 on November 20 for the first time since July, alongside a tech stock selloff and broader pressure on risk assets. Will $60K become resistance, or can BTC quickly reclaim it? What price or volume signals would convince you that selling pressure is easing?

GateDirectIPOPhase3ANTAllocates92100Shares

794.1K Views4.9K Discussing

NvidiaDropsNearly14Percent

332.6K Views7.6K Discussing

View More