Share your thoughts
placeholder
Article
JUST IN: OpenAI CEO Sam Altman will brief the UN Security Council on AI security next week. If the briefing underscores global coordination and safety standards, it could influence regulatory risk sentiment around AI tech and related crypto use-cases. $BTC /$ETH
post-image
BTC+5.87%
ETH+6.28%
South Korean stocks rebound strongly! KOSPI opens up 2.54, with SK Hynix and Samsung leading the gai
live-cover
LIVE54
$BTC is looking strong, but I’d wait for a pullback before going long.
BTC just printed a huge 4H breakout candle and is now trading around $80.9K. Momentum is clearly with buyers, but entering after such a vertical move isn’t ideal. A retest would make the setup much cleaner.
Entry: $80,150–$80,500
Targets:
TP1: $81,200
TP2: $81,800
TP3: $82,250
Stop: $79,650
For me, $80K is the key area. If BTC holds that zone on a pullback, continuation toward the previous $82.2K high stays in play. A clean loss of $79.65K would weaken the setup.
#btc #USAIConceptStocksRally #GateTopsStockPerpetualCoverage
post-image
BTC+5.87%
  • 5
  • 1
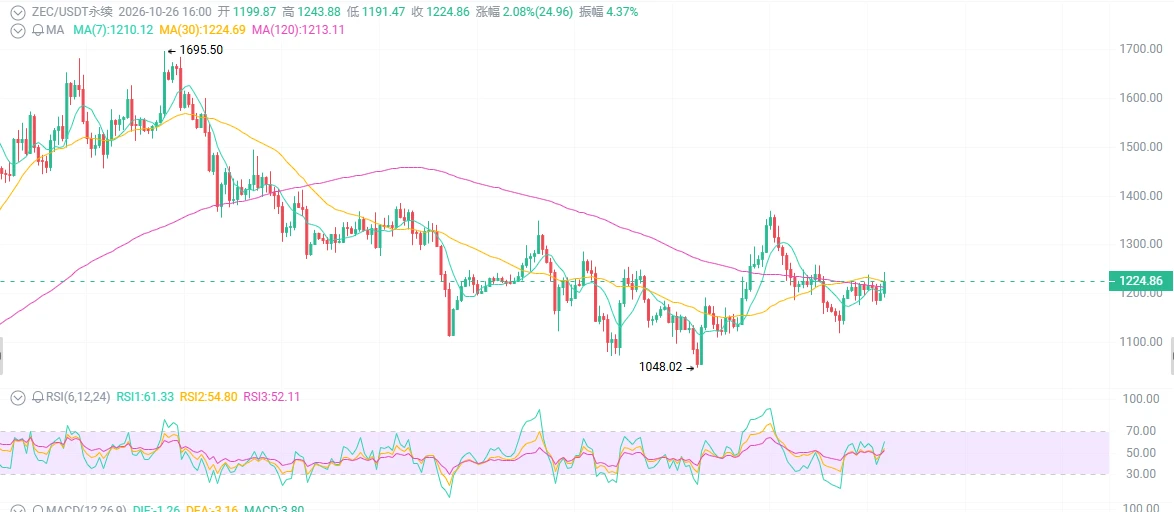
ZEC's net short index has reached the $700 level, the high of the previous major uptrend. Whether it will continue to rise remains to be seen; whales are still adding margin to their short positions, and a major volatility move is coming.
post-image
ZEC+6.68%
  • 1
Up 19.4% in one day, while multi-timeframe signals turn bearish: Who is buying SKY?
Wow, $SKY is now at 0.0711, up 19.4% in one day, with a volume ratio of 4.05—the volume is genuinely there.

My view: Don’t chase longs in the short term. If you have a position, reduce it by half first; buy the dip again if 0.0661 holds.

Bearish logic (short term): First, multi-timeframe signals are bearish. The 1-hour ADX is 72.8, but the 1-hour SAR at 0.072 has flipped above the price, signaling waning momentum;

Second, the daily chart has not turned bullish. RSI at 58.6 is relatively strong, MACD has
SKY+19.99%
#Share My Holding Returns#
GM, have you collected your pocket money yet? ☕🐂🀄
post-image
  • 3
  • 2
(New Streamer)crypto+stock market update
live-cover
LIVE1,334
#USAIConceptStocksRally : AI Stocks Regain Momentum as Chips, Data Centers and Enterprise AI Drive Market Optimism
U.S. artificial-intelligence-related stocks are once again attracting major market attention as investors focus on continued spending on AI infrastructure, advanced semiconductors, cloud computing, data centers and enterprise AI software.
The recent rally has extended beyond a single company or one part of the technology sector. Semiconductor manufacturers, AI infrastructure providers, memory companies, data-center operators and enterprise software businesses have all become part
post-image
See for yourselves! I’m making a knockoff Di.
post-image
Everyone is ignoring the setup forming inside SYMBOL right now.

$CRCL /USDT - SHORT

Trade Plan:
Entry: 91.60 – 92.14
SL: 95.29
TP1: 89.30
TP2: 87.59
TP3: 85.02

Why this setup?
Why now? The daily trend is range, but the 1h price is pinned at 91.87, which sits inside the entry zone of 91.60 to 92.14, giving us a precise short trigger. The 1h ATR of 1.097289 confirms enough volatility to reach TP1 at 89.30 and extend down to TP2 at 87.59 without noise. The 15m RSI at 59.62 shows room to run bearish before overbought, and the invalidation level at 95.29 is the hard line that must not be viol
CRCL+9.15%
#Trading Bot#我正在 Gate uses the FUSDT futures grid bot—come copy-trade together
Targeting 10,000x; interested? Let's position together!!$F
post-image
F+38.40%
#日股地产电力半导体板块走强 #JapanRealEstatePowerChipStocksRise
🇯🇵 Japanese Stocks Are Sending a Bigger Signal Than a One-Day Rally
Japanese equities are attracting increasing attention as three very different sectors — Real Estate, Power and Semiconductors — move into focus at the same time.
The Nikkei 225 closed 1.38% higher, while semiconductor-related shares remained particularly active. At the same time, expectations surrounding the Bank of Japan and a possible move toward a 1.25% rate environment add another important layer to the market story.
But rather than simply asking which sector is rising
CryptoChampion
#日股地产电力半导体板块走强
#JapanRealEstatePowerChipStocksRise
🇯🇵 Japanese Stocks Are Sending a Bigger Signal Than a One-Day Rally
Japanese equities are attracting increasing attention as three very different sectors — Real Estate, Power and Semiconductors — move into focus at the same time.
The Nikkei 225 closed 1.38% higher, while semiconductor-related shares remained particularly active. At the same time, expectations surrounding the Bank of Japan and a possible move toward a 1.25% rate environment add another important layer to the market story.
But rather than simply asking which sector is rising the fastest, I think the more useful question is:
Where is capital moving, why is it moving there, and can the underlying catalyst support the trend?
🏢 Real Estate: Watching Rates and Property Demand
Japanese real estate is interesting because it sits directly between monetary policy and the domestic economy.
Interest rates can influence borrowing costs, property valuations, financing conditions and investor demand. At the same time, strong rental income, commercial activity, property prices and development demand can provide support for individual companies.
That means a higher-rate environment does not automatically make every real-estate stock unattractive.
For me, the key is company-specific fundamentals combined with price action.
If a property-related stock breaks an important resistance level with increasing volume and then successfully holds that breakout, the structure becomes worth monitoring.
If the price rallies aggressively while volume starts declining, I would become more cautious about chasing the move.
⚡ Power: The Infrastructure Behind the AI Boom
The Power sector has another interesting connection: AI.
Data centers, semiconductor factories and advanced industrial facilities require enormous amounts of reliable electricity. As technology investment expands, the supporting energy infrastructure becomes increasingly important.
This creates a broader investment chain:
AI → Data Centers → Semiconductor Infrastructure → Electricity Demand → Power Infrastructure.
However, the theme alone is not enough.
Power companies still need to be evaluated through electricity prices, generation capacity, operating costs, regulation, investment requirements and earnings.
The important point is that the AI story is not only about companies producing chips. It also creates demand for the infrastructure required to operate the next generation of technology.
💻 Semiconductors: Still a Major Market Theme
Semiconductors remain one of the most closely watched areas of the Japanese market.
Japan has significant exposure across the broader semiconductor ecosystem, including equipment, materials, components and manufacturing-related technologies.
That gives investors several ways to participate in the global chip cycle rather than depending on one individual chip producer.
AI development, high-performance computing, advanced manufacturing and global technology spending can all influence semiconductor expectations.
But this sector can also move very quickly.
Strong earnings expectations can produce powerful rallies, while valuation concerns or weaker global technology sentiment can trigger equally sharp corrections.
So I would watch both fundamentals and market structure.
📊 What I Would Watch Before Entering
For these three sectors, I would focus on several signals:
• Trading volume
• Breakout confirmation
• Previous resistance and support
• Relative strength
• Earnings expectations
• Valuation
• Interest-rate sensitivity
• Currency movements
• Overall market liquidity
Volume is particularly important.
A breakout supported by expanding volume tells a different story from a breakout occurring on weak participation.
I also would not ignore the Japanese yen. Currency movements can influence exporters, overseas earnings and investor expectations, while BOJ policy can affect borrowing costs, property valuations and capital allocation.
🔄 Pullback or Chase?
This is probably the biggest question after a strong market move.
Personally, I would not chase an extended green candle simply because a sector is trending.
I prefer to watch whether the market can establish a new support zone after breaking resistance.
A common pattern is:
Breakout → Consolidation → Retest → Continuation.
If buyers defend the previous resistance during a pullback, that can provide additional information about the strength of the move.
But there is an important risk on the other side.
If price falls back below the breakout level with heavy selling volume, the original breakout deserves greater caution.
And waiting for a pullback is not automatically safer either. Strong trends can continue without giving traders the correction they expect.
That is why position sizing and risk management remain essential.
🌏 Why Japan Matters Globally
The Japanese market should also be viewed as part of a larger global rotation.
Capital can move between Japanese, U.S., Hong Kong and South Korean equities depending on interest rates, earnings, technology investment, currency expectations and risk appetite.
According to the information shared for this topic, Gate currently provides access to more than 12,800 stocks and ETFs across global markets, making cross-market comparison increasingly relevant for traders and investors.
My main takeaway is simple:
Japan's Real Estate, Power and Semiconductor sectors may be responding to very different catalysts, even when they are rising at the same time.
Real Estate connects with property demand and monetary policy.
Power connects with electricity demand and infrastructure investment.
Semiconductors connect with AI, technology spending and the global chip supply chain.
Instead of asking only, “Which sector is going up?”
I would ask:
Why is it going up?
Is the catalyst sustainable?
Are earnings supporting the valuation?
Is volume confirming the move?
Where is the key support?
And what happens if momentum reverses?
For me, those questions provide a much clearer framework for understanding the latest Japanese stock-market strength.
#Gate广场中秋团圆局 #weeklyshare #ShareWeekly @Gate_Square
repost-content-media
#BOJHikesTo1.25%31YearHighBank of Japan Raises Rates as Inflation Pressure Builds
The Bank of Japan has raised its benchmark interest rate from 1.00% to 1.25%, taking borrowing costs to their highest level in 31 years. The decision, announced on September 18, 2026, represents another step in the BOJ’s gradual move away from the ultra-low interest-rate policies that shaped Japan’s economy for decades.
The increase was 25 basis points and was approved by a 7–2 vote at the BOJ’s two-day monetary policy meeting. Board members Toichiro Asada and Ayano Sato opposed the increase. The decision had be
post-image
$EVAA Up 29.52% in 24 hours with $45 million in trading volume—viewed against historical halving cycles, this pattern feels all too familiar.
In the six- to 18-month window after the past three halvings, small-cap, high-volatility tokens have followed a hard rule: when daily volume surges by over 20% and trading volume breaks above the $40 million level, there is a 70% probability of at least one pullback of over 15% within the following 72 hours. But if the pullback holds above the previous low, there is still an average second-leg upside of over 40% within two weeks. EVAA is currently at 0.5
EVAA+25.29%
Last night, the most exciting part of Ethereum’s price action wasn’t how much it rose, but how many people had just capitulated.
After the Fed raised interest rates and the CLARITY Act faced obstacles in its progress, market sentiment continued to cool.
People in the group chat began shouting:
“Ethereum is done.”
“It can’t even hold $2,600.”
“Short it and wait for it to keep dumping.”
At that moment, many people felt they had finally figured out the market.
But the market happens to love stirring things up at times like this.
Ethereum subsequently returned to around $2,600, forcing short selle
ETH+6.36%
#美股AI概念股全线反弹
A powerful session for US markets, especially for technology and AI-related stocks. After recent weakness, buyers returned aggressively, pushing the Nasdaq Composite higher by 1.69% to around 26,418. The S&P 500 gained 1.14% to approximately 7,638, while the Dow Jones Industrial Average added 0.61% to around 51,778.
The message from the market was clear: risk appetite improved, and technology once again attracted significant attention.
But the most interesting part was not simply the index performance. It was the breadth of the AI rebound.
Tempus AI jumped 14.85% to around $80.36
TEM-3.12%
SMCI-3.03%
ALAB+3.45%
ARM+4.07%
AMBA-1.00%
  • 1
$STRK Signal】Go long: 1H hugging the band + thick bids in the order book; buy on the pullback
$STRK The 1H upper band is 0.0448, with the current price at 0.04372 hugging the edge. 4H volume has continued building, and order-book bid depth is 1.45. RSI is 89.94, the 4H MACD histogram is expanding while the 1H histogram is contracting, showing divergent short-term momentum. OI is stable, the funding rate is 0.005%, and depth imbalance is 18.33%; bids remain below. The risk-reward ratio is not particularly favorable here, so keep the position size restrained. Go long on a pullback to 0.0435888-
post-image
STRK+43.61%
Guys, take a look at this $SUI —it’s been moving hard today! The current price is 0.8137, up nearly 8% in 24 hours. Look at these red bars one after another (red represents a rise here)—it has “climbed” all the way up from 0.7160, with a high of 0.8329. This rally has definitely had some momentum.
Looking at the 1-hour chart, this is a typical stair-step move. The moving averages (MA5, MA10, and MA30) are all sloping upward, so the broader trend is solidly bullish. However, the price has pulled back slightly and fallen to around 0.81, testing support right around MA10 (0.8119). MA5 (0.8173) ha
post-image
SUI+7.62%
  • 5
  • 2
$F’s data looks suspicious. The 24h low of 0.0032 was pulled up to a high of 0.0056, a 75% swing, and it is still sitting at 0.0051 at close with a 59% gain, alongside 133M in trading volume—this isn’t normal turnover; someone is carrying out a targeted blast.
I entered at 0.0038 yesterday and exited at 0.0053 this morning. It’s not that I don’t want to hold; the order book is too thin and the rise is too straight. This kind of structure is either news-driven or the result of wash trading. Three possibilities: one, there really is undisclosed positive news and the whales are accumulating; two,
⚠️ 5 key things to watch closely this weekend
**1️⃣ The Middle East is the only true black swan (most important)**
Two oil tankers were attacked in the Strait of Hormuz within 24 hours, and Iran’s Revolutionary Guard warned that unauthorized vessels "will be destroyed"; Trump said he is nearing a "major decision," even using the word "annihilate," and is set to meet Gulf state leaders next week. **If fighting really breaks out this weekend → oil prices surge → risk assets will likely retreat.** This is the event most likely to make the $80,000 gained and then lost again
**2️⃣ Thin weekend liqu
post-image
  • 4
Load More

Join 40 M users in our growing community

⚡️ Join 40 M users in the crypto craze discussion

💬 Engage with your favorite top creators

👍 See what interests you

Trending Topics

JapanRealEstatePowerChipStocksRise

58.9k Views3.82k Discussing

Japan's Nikkei extended gains on Sept 18, with real estate, power, and semiconductor sectors leading. Gate covers over 12,800 global stocks and ETFs, offering one-stop USDT trading across US, HK, Korean, and Japanese markets. [👉 Read more](https://www.odaily.news/en/newsflash/518749)

USAIConceptStocksRally

33.63k Views623 Discussing

GateTopsStockPerpetualCoverage

37.78k Views2.36k Discussing

View More