Share your thoughts
placeholder
Article
Starting with 50u—watch me turn it into 1000u in three days.
post-image
IRAN says it’s relaying three conditions to Washington via Qatar, including a full ceasefire, unfreezing assets, and lifting maritime blockades. Awaiting Trump’s response; Tehran notes US/Israeli actions push Iran toward reconsidering NPT commitments.
post-image
$JTO has rebounded strongly from the $0.40 region and is currently testing the $0.50 area with strong bullish momentum. The latest candlesticks show sustained buying pressure, keeping the upward structure active.
Long trade setup Entry: $0.4920 – $0.4990TP1: $0.5080TP2: $0.5200TP3: $0.5320Stop-loss: $0.4780Buy and trade $AK
ONE
post-image
JTO+6.69%
Watching the market until I got annoyed, I actually saw things more clearly after turning it off; once my eyes stopped staring at it, my heart stopped panicking too.

A few days ago, I glanced at $WAL before bed. WAL buying pressure was strengthening and funds were quietly entering. I only gave one reminder at the time: don’t chase; follow after a pullback.

From 0.02709 to 0.03319, an unrealized gain of +1085.18%—feels amazing. Those already on board should have laughed themselves awake.

Put the bulk into my pocket first, cut 70%, and leave 30% set at the cost basis. The market specialize
post-image
WAL+7.00%
BTC0.00%
ADA+0.44%
I'm making a risky bet!
I put $500 each into $RVN and $NOM .
RVN experienced network issues in recent weeks, bottomed out like $ONE , and some Korean exchanges delisted it; if they don't delist it, maybe it will run.
I made a clean 2x on $NOM in recent months, and now they've entered the watchlist; the price has bottomed out and the market cap has fallen to ridiculous levels, so maybe an exit pump will come before delisting.
I'm making these purchases with profits from SKL; it doesn't matter if I lose.
If you don't have money to risk like I do, please don't buy.
Wishing you big gains.
post-image
RVN+2.97%
NOM+3.81%
SKL+16.21%
$SNDK /USDT is range-bound on the daily, but a 1h setup is hiding in plain sight.

$SNDK /USDT - SHORT

Trade Plan:
Entry: 1781.83 – 1784.93
SL: 1802.70
TP1: 1768.89
TP2: 1759.23
TP3: 1744.74

Why this setup?
Why now? The daily trend is range, which means a directional move is overdue and the 1h bias is SHORT. The 1h ATR of 6.19 shows average candle size, so the entry zone between 1781.83 and 1784.93 is tight enough for a clean rejection. The 15m RSI at 52.36 is neutral, suggesting the 1h price at 1783.38 is about to test the lower target. TP1 sits at 1768.89, TP2 at 1759.23, and TP3 at 174
SNDK-0.25%
I need a #1000x.
Shill me.
post-image
Why everyone is about to get trapped shorting $ZAMA /USDT right now

$ZAMA /USDT - SHORT

Trade Plan:
Entry: 0.08110 – 0.08388
SL: 0.09581
TP1: 0.07250
TP2: 0.06585
TP3: 0.05586

Why this setup?
Why now? The daily trend is range, but the 1h price is pinned at 0.08249 and the 15m RSI sits at 46.78, hinting at exhaustion rather than a fresh leg down. The 1h ATR of 0.005548 shows volatility is compressed, which often precedes a sharp directional move when range breaks. With entry_ref at 0.08249, the setup targets TP1 at 0.07250 and TP2 at 0.06585, but the real line in the sand is the invalidat
ZAMA+29.84%
#BOJHikesTo1.25%31YearHigh A 31-Year High and a Major Turning Point for Japan’s Monetary Policy
The Bank of Japan (BOJ) has taken a significant step by raising its policy interest rate to 1.25%, marking a level not seen in roughly 31 years. The move represents another important chapter in Japan’s long-running shift away from an era of exceptionally low and negative interest rates.
For decades, Japan’s economy was characterized by extremely low inflation, weak wage growth, and persistent concerns about deflation. In response, the BOJ maintained extraordinarily accommodative monetary conditions
post-image
Volume ratio 9.128, up to 0.0927 before falling back to 0.0827: ZAMA’s watershed playbook
Who could have seen this coming? $ZAMA is now quoted at 0.0827, up 37.5% in 24 hours. It touched 0.0927 overnight before being pushed back below 0.083, with volume settling at 9.128 times the 30-day average.
I’m not chasing here—favoring buying dips on a pullback, with the playbook ranging widely between 0.0683 and 0.0927.
Bullish case: genuine volume—24-hour trading volume of 52.74 million U, with a volume ratio of 9.128, which wash trading cannot fake; the market is also supportive—50 gainers versus 22
ZAMA+30.46%
To be honest, I’m surprised this trade has made it this far—I got pretty lucky. A few days ago, in the early hours, I saw that the $SONIC key level had held, the bottom was moving sideways, and buying pressure was gradually strengthening, so I suggested cautiously trying a small long position.
Entered at 0.01888, current price 0.0239, unrealized profit +652.49%—there’s your answer. Take profit on 80% of the position first, and protect the remaining 20% at the entry price. Don’t get greedy for the last bit.
Market moves come with patience, and profits come from holding. Panic comes from having
post-image
SONIC+3.11%
ADA+0.44%
XRP-0.11%
This move surged from around 2480 all the way to 2672, setting sentiment ablaze,
but it has clearly started to lose steam after the spike.
Now around 2631, the price is stuck below the Bollinger midline at 2638,
with 2652 as the first resistance above and 2672 as strong resistance at the previous high.
I’m not in a rush to chase longs.
2623 is the key defense line. As long as it holds, a pullback looks more like a shakeout,
and only a reclaim of 2638 would create an opportunity to continue toward 2652 or even 2672.
But if 2623 breaks on heavy volume, don’t stubbornly hold on; focus on 2610 and
ETH+0.32%
#WeekendMarketBullishOrBearish
BITCOIN WEEKEND CHECK: THE MARKET JUST CHANGED THE QUESTION
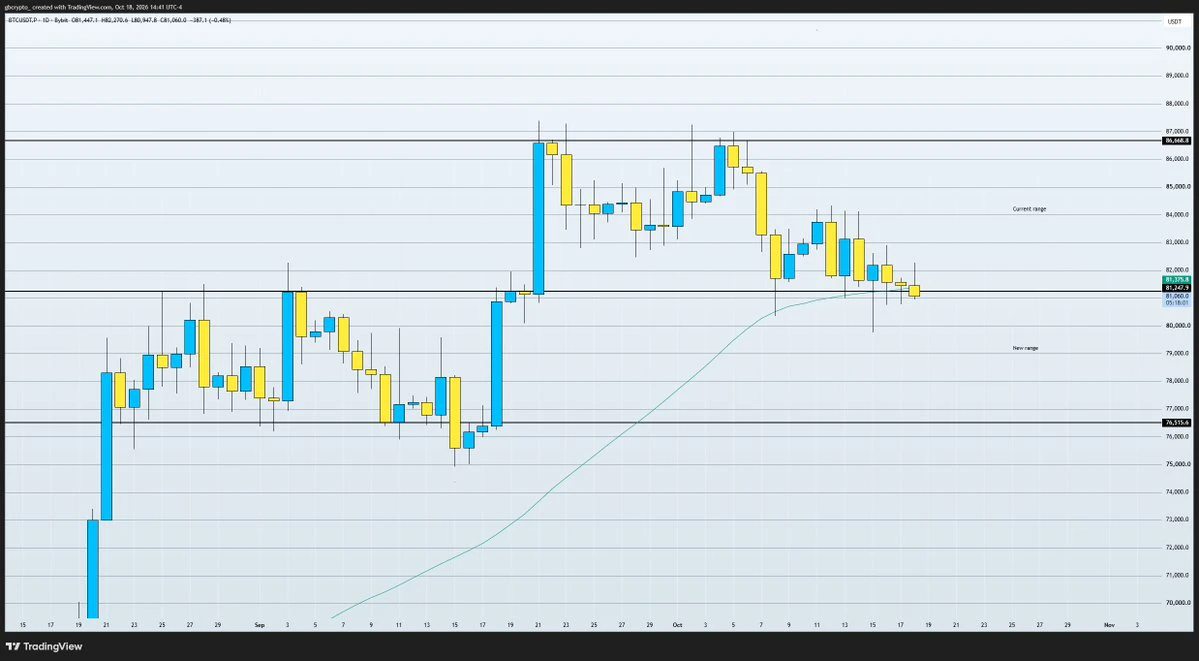
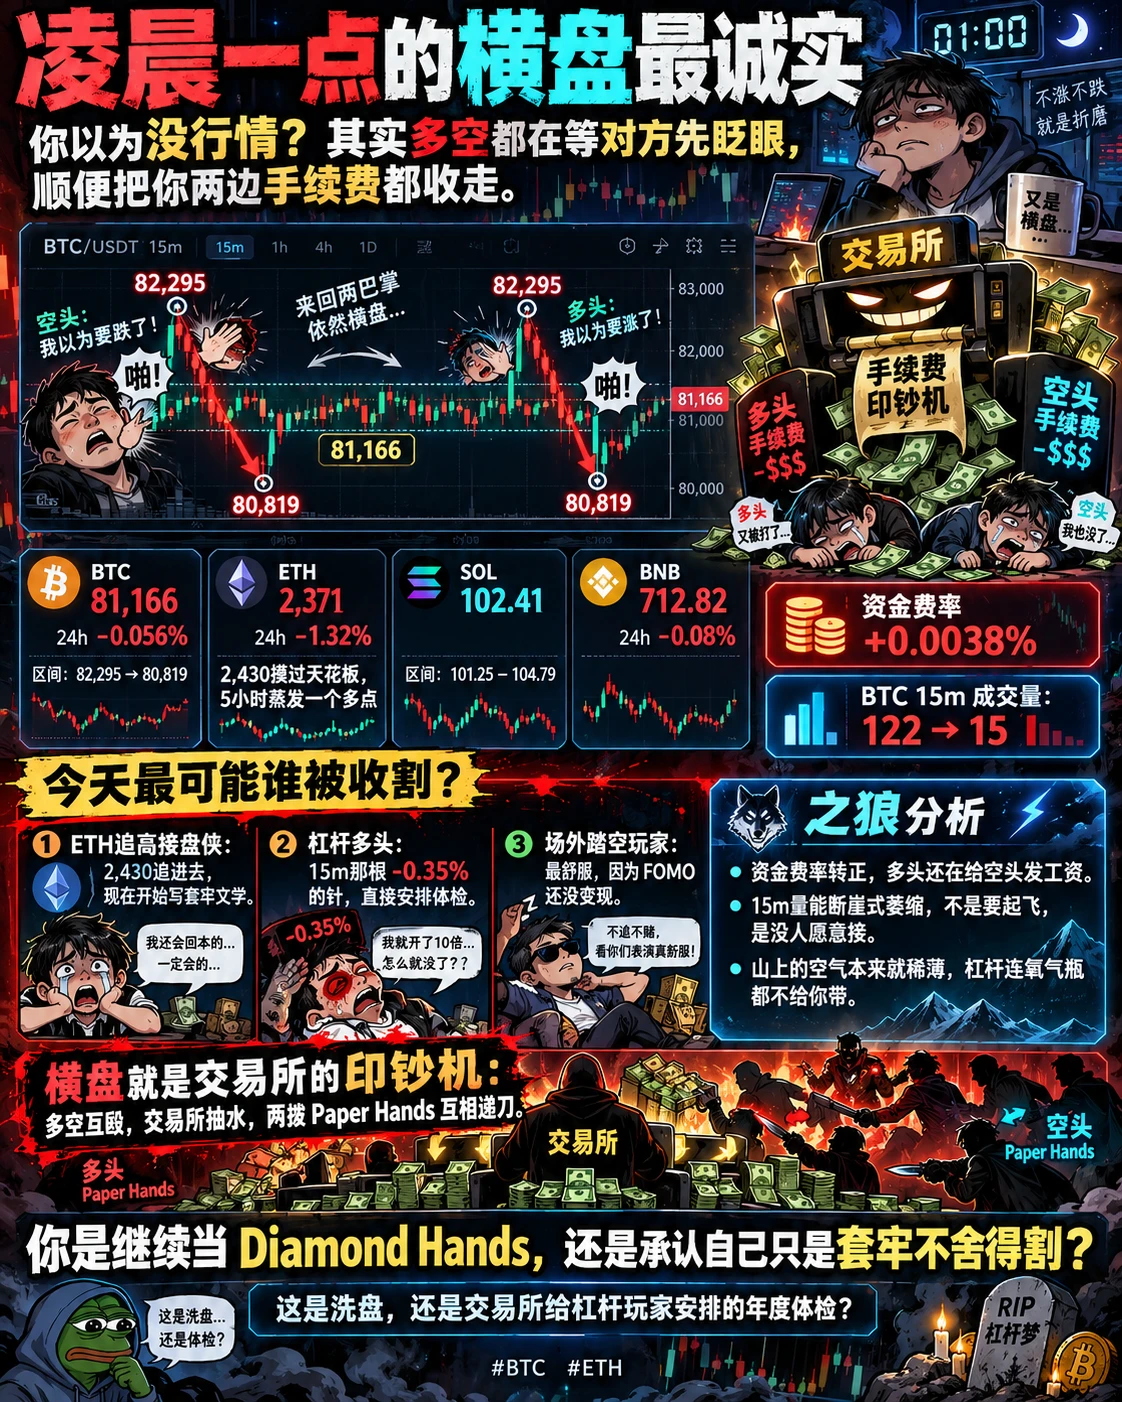
Bitcoin is entering the weekend at around $81,320, and that price changes the entire structure of this week's discussion.
A few days ago, the market was fighting to hold $75,000 after a sharp liquidation event, a failed U.S. crypto legislation vote, and the Federal Reserve's first rate hike since 2023. Now Bitcoin is back above $81,000.
That is not just a price recovery. It is evidence that the market absorbed several negative catalysts without allowing sellers to maintain control.
The weekly path tells
BTC-0.01%
  • 1
HEI is showing a constructive rebound on the 15m chart, accompanied by rising local trading volume and reclaiming the MA7 and MA25 lines. The current price is testing the 0.1612 level; if it can form a sustained breakout above this consolidation zone, it should target around the recent high of 0.1740. Open a large LONG position: $HE ! 🚀
Entry range: 0.1576 - 0.1611Main target: 0.1740Secondary target: 0.1857Stop-loss: 0.15130Click here to trade 👇👇👇Other tokens: $B : Current price 1.1151 - 24-hour change: +38.65%
$SO : Current price 110.85 - 24-hour change: -1.61%
post-image
HEI+10.94%
The Fed Hikes Rates for the First Time in Three Years! Warsh says “inflation is the problem” as mark
live-cover
LIVE910
I didn’t make any particular judgment—I just held it a little longer and didn’t expect it to actually play along.
When the early-session dump first started, $GRVT had strong bull-trap vibes. Every push higher came with no volume, and the resistance above was obvious. I opened a short at 0.2933 and waited for it to collapse on its own.
Current price: 0.1924, +669.97%. Feels good, guys. It was really sluggish earlier, but seeing the move play out was genuinely satisfying.
Take profit on 80% first, and protect the remaining 20% at the entry price. Hold as long as the trend remains intact; run if
post-image
GRVT+6.87%
ZEC-6.47%
LAB+9.02%
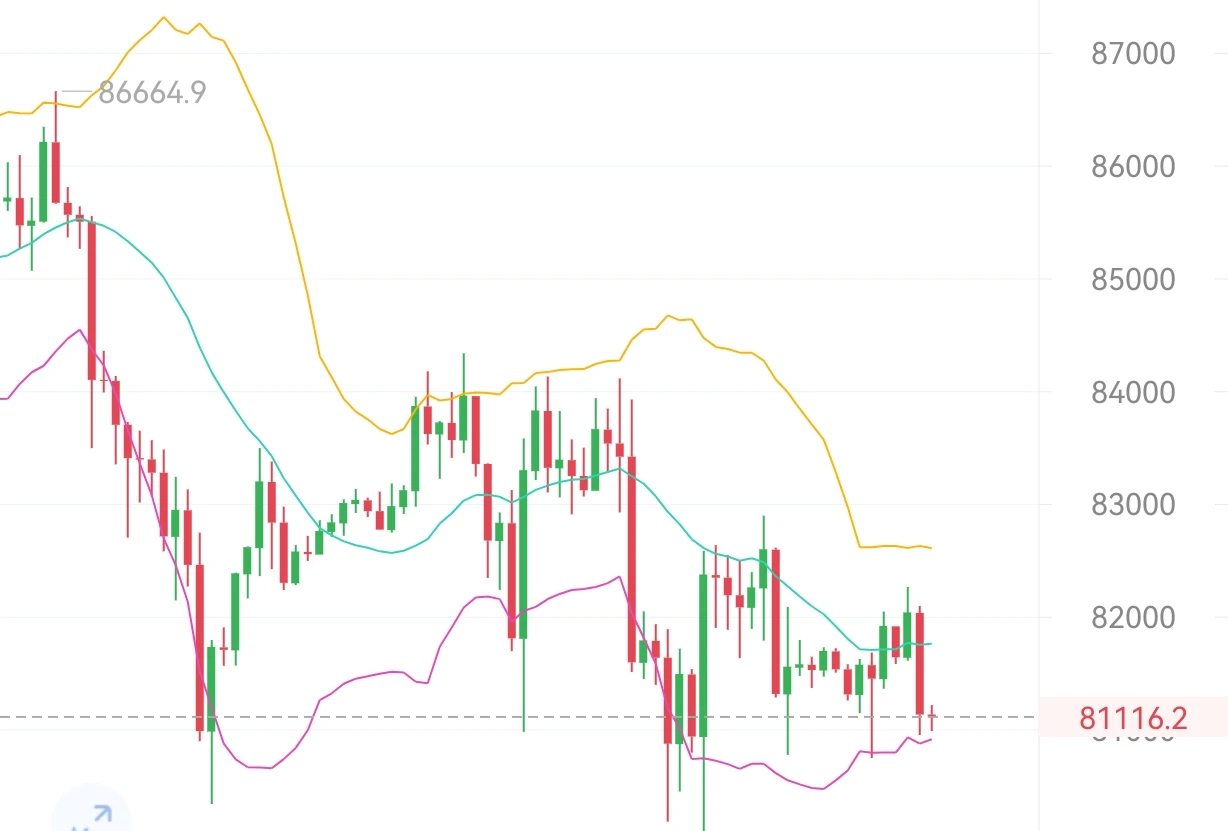
BTC continues to consolidate at high levels on declining volume, and there are still no clear conditions for going short.
1. The long-to-short account ratio continues to decline and is now below 1, indicating that retail traders are rushing in to open short positions, while institutional holdings have not moved for now. When the long-to-short ratio becomes imbalanced, BTC may push higher to set a new high and leave all the retail short positions hanging;
2. Most of those currently trapped in short positions will set their stop-losses around the previous high of 82,200. There is too much liquid
post-image
BTC0.00%
$BR Short 10x | Testing intraday, the path is clear.
BR is moving into the position I want for a strategic entry, rather than an impulsive one. This position is valid; let the zone determine its validity. Trading plan: - Entry: 1.07817 – 1.10570- TP1: 0.94330 (R:R 1:0.8)- TP2: 0.84422 (R:R 1:1.3)- TP3: 0.69559 (R:R 1:2.0)- SL: 1.29010Why this setup? - This is primarily a “position” trade: a 4-hour bearish structure, a bullish daily backdrop, and price reacting from the 1.07817–1.10570 range. - RSI15 is 46, leaving room for sellers to push lower, provided they continue to dominate. - Volume is
post-image
BR+38.73%
#ZECKeepsRisingBreaking1500
There are moments when a number becomes more than just a number. It becomes a milestone, a signal of momentum, and a reminder of how quickly things can change when confidence, determination, and consistent progress come together. The idea behind ZEC keeps rising and breaking 1500 represents that kind of momentum — the feeling of watching something move beyond expectations and continue pushing toward new levels.
Breaking a major level is never simply about reaching a particular number. The real story is the journey that leads there. Every step forward reflects the p
post-image
ZEC-6.36%
Load More

Join 40 M users in our growing community

⚡️ Join 40 M users in the crypto craze discussion

💬 Engage with your favorite top creators

👍 See what interests you

Trending Topics

JapanRealEstatePowerChipStocksRise

59.86k Views4.56k Discussing

Japan's Nikkei extended gains on Sept 18, with real estate, power, and semiconductor sectors leading. Gate covers over 12,800 global stocks and ETFs, offering one-stop USDT trading across US, HK, Korean, and Japanese markets. [👉 Read more](https://www.odaily.news/en/newsflash/518749)

USAIConceptStocksRally

34.54k Views1.02k Discussing

GateTopsStockPerpetualCoverage

38.94k Views2.61k Discussing

View More