Share crypto content and earn up to 60% commissions through content mining.
placeholder
gatefun
$PI Whose long position is that? Ouch, so pitiful.
PI-2.70%
View Original
post-image
  • Reward
  • 1
  • Repost
  • Share
GateUser-7cb00b6e:
A fence-sitter
#股票交易分享挑战 Valuation Opportunity or Early Reflection of Profitability Model Risk?
CBRS is currently trading at $231.01, down approximately 40% from its 52-week high of $386.34, but still up approximately 44% from its 52-week low of $160.81. Has the market created a valuation opportunity through this decline, or has it prematurely priced in concerns about the immaturity of its profitability model?
Positive factors include: core revenue grew 103% year over year, cloud business revenue grew 287% year over year, full-year core revenue guidance was raised to $880 million-$890 million, core gross mar
CBRS-5.31%
View Original
post-image
  • Reward
  • 4
  • Repost
  • Share
SoominStar:
To The Moon 🌕
View More
Some of this week’s Shi Pan records, with a stable 90% win rate➕, all have corresponding posts and are available for review!#GateLaunchpool瓜分141万枚DOS $XAUT
XAUT0.08%
View Original
post-image
post-image
post-image
  • Reward
  • Comment
  • Repost
  • Share
I’m increasingly starting to hate the concept of TDD (test-driven development).
5 minutes of development, 10 hours of testing.
You have to write a hash verification test file just to calculate what 1+1 equals.
I’m already using a skill to force it to specify how it develops and how it tests.
Codex, listen to me, thank you...
View Original
post-image
  • Reward
  • Comment
  • Repost
  • Share
$NOT ‌is showing a bullish structure with momentum at 60/100, which is decent. Higher lows are forming, and resistance at $0.000402 is the key level to watch. A breakout above that could trigger a move higher. However, volume is very weak, which raises questions about the sustainability of the move. I'd wait for stronger buying pressure or a confirmed breakout before considering a position.
Entry zone: $0.000371 – $0.000402 (breakout required)
Targets: TBD after confirmation
Stop loss: TBD
Decent structure — but needs volume. Always DYOR.
#GateLaunchpool141MDOS #GateTop1GrowthInJuly
NOT1.93%
post-image
  • Reward
  • 18
  • Repost
  • Share
L2Farmer:
Momentum is only at 60, so it’s not particularly strong. Rising lows are a good sign, but without volume, it still feels like a paper tiger.
View More
BTC is really done for; liquidations are only around 100 million now.
Continue resting over the weekend#btc $BTC
BTC-0.02%
View Original
post-image
  • Reward
  • Comment
  • Repost
  • Share
Standard Chartered bullish on UNi at $ 100!
gate liveLIVE
1,474
  • Reward
  • Comment
  • Repost
  • Share
#我的七夕交易分享
Little God of Wealth’s Tesla Trading Analysis
‌Market Summary‌
Tesla continued its rebound this week, with its share price climbing from around $311 at the end of July to around $334, a weekly gain of approximately 7%. The stock closed higher consecutively on August 7 and 11, with intraday fluctuations ranging from $329 to $336. Trading volume increased from the previous period, and market sentiment clearly improved. Driving factors included multiple positive developments, such as the Cybertruck remaining the best-selling vehicle in the United States priced above $100k, Morgan Stan
TSLA0.65%
View Original
post-image
LittleGodOfWealthPlutus
#我的七夕交易分享
Little Fortune's Tesla Trading Analysis
‌Market Summary‌
Tesla continued its rebound this week, with its share price climbing from around $311 at the end of July to around $334, a weekly gain of approximately 7%. Tesla closed higher on August 7 and 11, with its intraday trading range between $329 and $336. Trading volume increased somewhat from the previous period, and market sentiment clearly improved. Driving factors included multiple positive catalysts, such as the Cybertruck remaining the best-selling model priced above $100k in the United States, Morgan Stanley raising its second-quarter delivery estimate to 413.2k vehicles, and the groundbreaking of the Terafab chip superfactory. The current P/E ratio is around 278, with a market capitalization of approximately $1.32 trillion, leaving considerable room compared with the 52-week high of $498.
‌Technical Indicator Analysis‌
The share price has held above $330, with short-term moving averages in a bullish alignment and the MACD running above the zero line. Volume is reasonably supportive, but no surge has occurred. The RSI is in the relatively strong 50–60 range and has not entered overbought territory. However, it should be noted that the current share price remains in the lower-to-middle portion of the 52-week range of $297–$498. Pressure from medium-term moving averages remains, and overhead selling pressure should not be underestimated.
‌Key Support and Resistance Levels‌
The first support below is around $320, the area of the early-August low. The second support is at the round-number level of $300 and the 52-week low of $297. The first resistance above is around $350, while the second resistance lies in the $380–$400 range, a previous high-volume trading zone. A breakout could then lead to a challenge of $415, Morgan Stanley's target price.
‌Outlook‌
In the short term, favorable delivery data and the AI chip strategy will provide catalysts for the share price. If second-quarter earnings exceed expectations, $350 is within reach. In the medium to long term, however, investors should remain alert to pressure from high valuations, uncertainty surrounding the macro interest-rate environment, and a decline in overall market risk appetite. Investors are advised to monitor whether the $320 support holds; a high-volume breakout above $350 would warrant active follow-up, while otherwise position sizes should be controlled.
#股票交易分享挑战 $TSLA
repost-content-media
  • Reward
  • Comment
  • Repost
  • Share
$ROBO (Fabric Protocol) – Steep Decline, Out
I'm staying far away from ROBO because it is down -31.13% at $0.01374, dropping from a 24h high of $0.02025. The moving averages are bearish with EMA5 at $0.01376, EMA10 at $0.01382, and EMA30 at $0.01397. The 24h low is $0.01311, and MACD is negative. The trend is clearly down. I'm not touching this until it stabilizes. For now, I'm completely out.
ROBO-30.16%
post-image
  • Reward
  • 4
  • Repost
  • Share
HexiHoodie:
ROBO这走势,均线空头排列,MACD都负了,技术面讲就是弱势,等阴跌完再看吧,别急着抄。
View More
GM fam! ☕
What’s your 1 crypto goal this year?
post-image
post-image
  • Reward
  • 1
  • Repost
  • Share
NexaCrypto:
To The Moon 🌕
Director Niulai probably trades stocks on the side
Niulai — the bull is coming
Baola — a violent pump
View Original
post-image
  • Reward
  • Comment
  • Repost
  • Share
hot topic prediction
gate liveLIVE
2,047
live-coin
  • Reward
  • Comment
  • Repost
  • Share
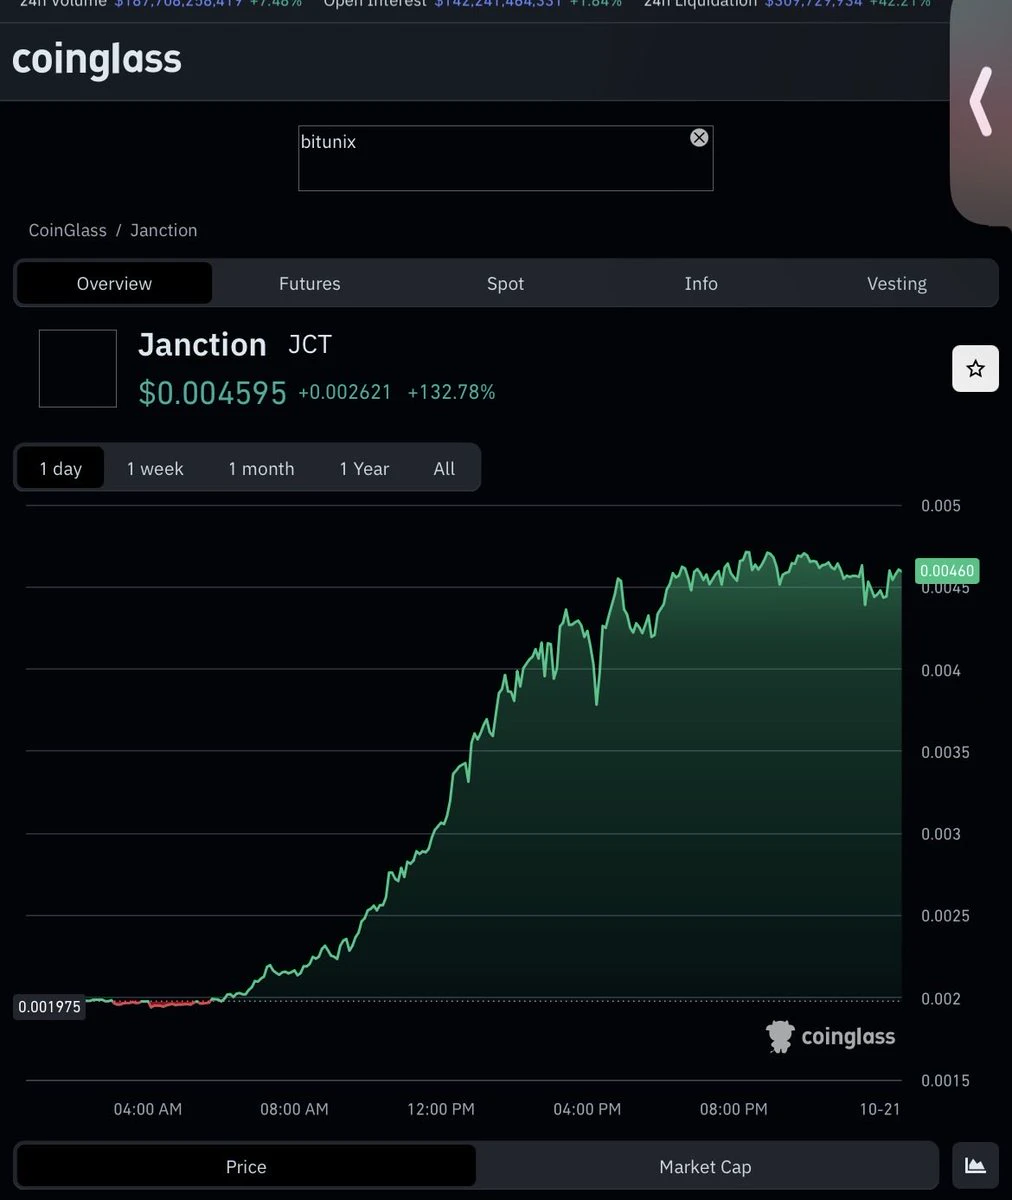
$JCT (JCT) – Brutal Breakdown, Out
I'm staying far away from JCT because it has crashed -32.12% to $0.002265, dropping from a 24h high of $0.003338. The moving averages are heavily bearish with EMA5 at $0.002272, EMA10 at $0.002281, and EMA30 at $0.002308. The 24h low is $0.002143, and MACD is deeply negative. The trend is clearly down. I'm not touching this until it stabilizes. For now, I'm completely out.
JCT-33.29%
post-image
  • Reward
  • Comment
  • Repost
  • Share
At the 63k level for BTC, many people are panicking, but what I see is the “demystification” of the asset.
BTC is increasingly resembling a macro asset, and is even being somewhat “drained” by US stocks. Gold is fluctuating at highs, US stocks are recovering, while BTC is eating dust.
On top of that, the continuous ETF outflows and Coinbase’s premium index showing negative values for 90 consecutive days indicate that domestic US buying power is indeed in a vacuum.
Citigroup has conducted research showing that ETFs can determine 45% of crypto market volatility. Now that institutional spot buyin
BTC-0.67%
ETH-0.36%
COING0.34%
C0.43%
GLDX0.19%
View Original
post-image
  • Reward
  • 3
  • Repost
  • Share
BondRebel:
That makes sense. It really isn’t the time to chase shorts right now.
View More
#股票交易分享挑战 Valuation Opportunity or Early Reflection of Profitability Model Risk?
CBRS is currently trading at $231.01, down approximately 40% from its 52-week high of $386.34, but still up approximately 44% from its 52-week low of $160.81. Has the market created a valuation opportunity through this decline, or has it priced in the immaturity of the profitability model ahead of time?
Positive factors include core revenue growth of 103% year over year, cloud business growth of 287% year over year, full-year core revenue guidance raised to $880 million–$890 million, core gross margin guidance rai
CBRS-5.31%
View Original
post-image
ThisIsTranslateContent:
#股票交易分享挑战 Valuation Opportunity or Early Reflection of Profitability Model Risk?
CBRS is currently trading at $231.01, down approximately 40% from its 52-week high of $386.34, but still up approximately 44% from its 52-week low of $160.81. Has the market created a valuation opportunity through this decline, or has it prematurely priced in concerns about the immaturity of its profitability model?
Positive factors include: core revenue grew 103% year over year, cloud business revenue grew 287% year over year, full-year core revenue guidance was raised to $880 million-$890 million, core gross margin guidance was raised to 41%-43%, and $25.4 billion in remaining performance obligations provides long-term revenue visibility. Strategic partnerships with OpenAI, AMD, and others are broadening the customer base and ecosystem reach.
Risk factors are also significant: GAAP net loss was $450.5 million, hardware revenue fell 23% year over year and its growth path remains unstable, core gross margin declined from 46.5% in the first quarter to 40.6% in the second quarter, and the capital expenditure and cost pressures resulting from data center expansion may continue to weigh on near-term margins. The analyst consensus price target is approximately $292.55, with 64% of the 11 analysts rating it a “strong buy” and 27% rating it a “buy,” but this optimism is based on the premise that high growth will continue to materialize.
From a valuation perspective, the company does not yet have a positive price-to-earnings ratio (P/E ratio is “-”), meaning investors are paying a premium for future cash flows. The market expectations implied by the current price are that high cloud business growth can continue, the hardware business can stabilize, and gross margin can gradually improve through economies of scale toward management’s long-term target of 60%.
Follow-up Framework and Key Validation Milestones
Management expects core gross margin to bottom in the third quarter (38%-40%), improve significantly beginning in the fourth quarter, and continue moving toward the 60% target in 2027. This forecast will become an important validation window for the stock price.
The follow-up framework can focus on the following dimensions: cloud business growth is the primary indicator. Whether the current 287% year-over-year growth can be sustained, as well as the trend in cloud revenue as a share of total revenue, will directly reflect the sustainability of AI inference demand. Whether hardware revenue can stop falling and stabilize is equally critical—if GAAP hardware revenue returns to positive growth in subsequent quarters, it will ease concerns about the company’s business model transition. The trajectory of core gross margin and core operating margin is central to assessing earnings quality. If gross margin bottoms as expected in Q3 and improves in Q4, while the core operating loss margin continues narrowing from the current -16%, the closed loop of “AI cloud revenue growth → gross margin improvement → narrowing operating losses” will be taking shape.
The delivery pace of orders from major customers such as OpenAI, changes in remaining performance obligations, and the degree of alignment between data center capacity and capital expenditures are all key variables for validating, from the perspectives of order visibility and cost structure, whether the company can deliver on its growth guidance.
Cerebras’ post-earnings decline was fundamentally not about “AI demand being inadequate,” but rather about the market shifting from simply chasing AI revenue growth to examining the quality of that growth and its profitability costs. Nearly fourfold growth in the cloud business proves that AI inference demand is creating a new revenue curve for Cerebras, but declining hardware revenue, margin pressure, and massive GAAP losses also show that the company remains in a high-investment expansion phase and is still some distance from stable profitability.
Cerebras has chosen a technological path entirely different from NVIDIA’s GPU route. As AI inference demand continues to account for a larger share of the computing market, whether this differentiated architecture can translate into a sustainable competitive advantage still requires validation through data from multiple quarters.
The approximately 11.85% decline after this earnings report reflects the market’s discount for short-term uncertainty, but the medium- to long-term value assessment still depends on whether the company can prove over the next several quarters that “high growth” and “high quality” can coexist$CBRS
repost-content-media
  • Reward
  • 1
  • Repost
  • Share
ThisIsTranslateContent::
Just send it 👊
8.11 10,000 American students, fixed at 0.5👋. Shout-basket summary: arrange chrysanthemum 8 dan, bamboo shoot 1 dan, receive goods 45 dian 2213🔪$XAUUSD
XAUUSD0.58%
View Original
post-image
  • Reward
  • Comment
  • Repost
  • Share
$SNDK ‌ Up 7.48% – Is JPMorgan's $2,250 Target Realistic?"
$SNDKUSDT is on fire! Up another 7.48% today to $1,641.99. After-hours it's pushing $1,658.40. This stock has gained over 35% in just one week.
But here's the big question: JPMorgan just upgraded SNDK to "Outperform" with a $2,250 price target for December 2027 – that's 37% upside from Friday's close. Wedbush, however, isn't fully buying the investor day pitch.
My Analysis:
· Support: $1,565 (today's low)
· Resistance: $1,667 (today's high) – if it breaks, $1,700 is next
· MA5: $1,553, MA10: $1,554, MA30: $1,492 – price is well above
SNDK0.82%
post-image
  • Reward
  • 17
  • Repost
  • Share
Ilyas_Ganwani:
Up 35% in a week and still chase the rally? I choose to wait and see for now, and reconsider when it pulls back to around 1550.
View More
$ETHFI ‌ is quietly building a bullish case. The price is forming higher lows, and momentum is moderate, with resistance at $0.4973 serving as the key barrier. Support at $0.4458 is holding firm, and the structure suggests accumulation. In similar past setups, a breakout above resistance has often led to strong rallies. However, the setup is not yet confirmed — two requirements are still missing. I'm keeping this on my watchlist, but I'll wait for a confirmed breakout before pulling the trigger.
Entry zone: $0.4458 – $0.4973 (watch for breakout)
Targets: TBD after confirmation
Stop loss: TBD
ETHFI5.79%
post-image
  • Reward
  • 12
  • Repost
  • Share
DAppPermissionChecker:
Wait for confirmation before entering; don't chase the highs.
View More
$ACE Casually placed an order and took another small profit.
ACE-38.44%
View Original
post-image
  • Reward
  • Comment
  • Repost
  • Share
Ethereum has been moving sideways on declining volume for a week. Since the high-volume drop on August 10, there has been no renewed high-volume move, indicating that acceptance of the current price remains low and that there is little willingness among funds to enter. Without a high-volume engulfing reversal, an effective breakout is impossible. Therefore, the next move is bearish on the four-hour timeframe—boldly short any low-volume rebound! #Gate7月增长Top1
ETH-0.04%
View Original
post-image
  • Reward
  • 1
  • Repost
  • Share
NexaCrypto:
To The Moon 🌕
Load More

Join 40 M users in our growing community

⚡️ Join 40 M users in the crypto craze discussion
💬 Engage with your favorite top creators
👍 See what interests you
  • Pinned