Square
Following
Hot
News
Profile
Share your thoughts
placeholder
Article
Today's Trading Outlook [10.31-11.1 Weekend Plan]
[Market Analysis]
$BTC Weekend liquidity has weakened noticeably, and there has been no strong volume expansion. The market is currently range-bound, recovering steadily but slowly. Market depth indicates that buyers have the upper hand, while concentrated selling pressure overhead is likely.
Long entries: 764-774-780-788-796
Short entries: 784-774-768-760-754
$ETH This asset is strongly correlated with BTC and has now broken above the 2260 target. Its recovery is faster than BTC’s, and market depth continues to favor buyers.
Long entries: 22
BTC-0.65%
ETH-1.23%
ZEC+1.29%
The level it gave was decent. I checked it with Fibonacci; though convenient, this thing can't predict a trend reversal. The human brain is still a bit better.$LSK #量化
LSK-5.22%
Trenches
KIM
K
bade
b
KIM
8pjf...pump
Market Cap
$.
Change
.
24h Vol
$.
Holders
.
Q
Q
bade
b
Q
0xc0...0589
Market Cap
$.
Change
.
24h Vol
$.
Holders
.
GTA6
G
bade
b
GTA6
4kjr...zDnz
Market Cap
$.
Change
.
24h Vol
$.
Holders
.
ZIG
Z
bade
b
ZIG
0x8c...1145
Market Cap
$.
Change
.
24h Vol
$.
Holders
.
DESSA
D
bade
b
DESSA
npz2...pump
Market Cap
$.
Change
.
24h Vol
$.
Holders
.
#Gate24HNetInflowsRankTop2 #ShareWeekly
Gate Attracts $57.97 Million in 24 Hours: What Its Global No. 2 Ranking Reveals About Growing Market Confidence
In the cryptocurrency industry, an exchange's strength is not measured only by trading volume or the number of listed tokens. Capital movement, liquidity, security, user confidence, and the ability to provide diverse financial services are equally important indicators of long-term development.
According to DefiLlama data, Gate recorded approximately $57.97 million in net inflows over 24 hours, ranking No. 2 among global centralized exchanges (
BTC-0.67%
ETH-1.26%
#PI Pi Network released four developer updates ahead of its ecosystem summit; the price remains around $0.078 after falling about 13% this month, with PiVerify pricing and customer numbers undisclosed; the summit will take place November 17–19, featuring app showcases and a hackathon.
Pi Network released four developer updates covering app management, hosting, trial token pricing charts, and identity verification. The token is trading around $0.078, down about 13% this month, with PiVerify pricing and customer numbers undisclosed. The online summit, scheduled for November 17–19, will include a
PI-0.60%
[NEW SREAMER] market update
live-cover
LIVE1,121
Weekend trading pros all have this risk-management playbook!
What’s the most exhausting part of trading? It’s not analyzing the market—it’s when the market has closed, but your mind is still playing a never-ending candlestick-chart drama!
If I don’t want to watch the market over the weekend, I get the work done in advance. First, I check whether the assets I hold still fit my original trading rationale; next, I identify key support and resistance levels; finally, I set take-profit and stop-loss levels and position sizes based on my risk tolerance.
For assets with relatively stable trends and u
INTC-28.49%
  • 13
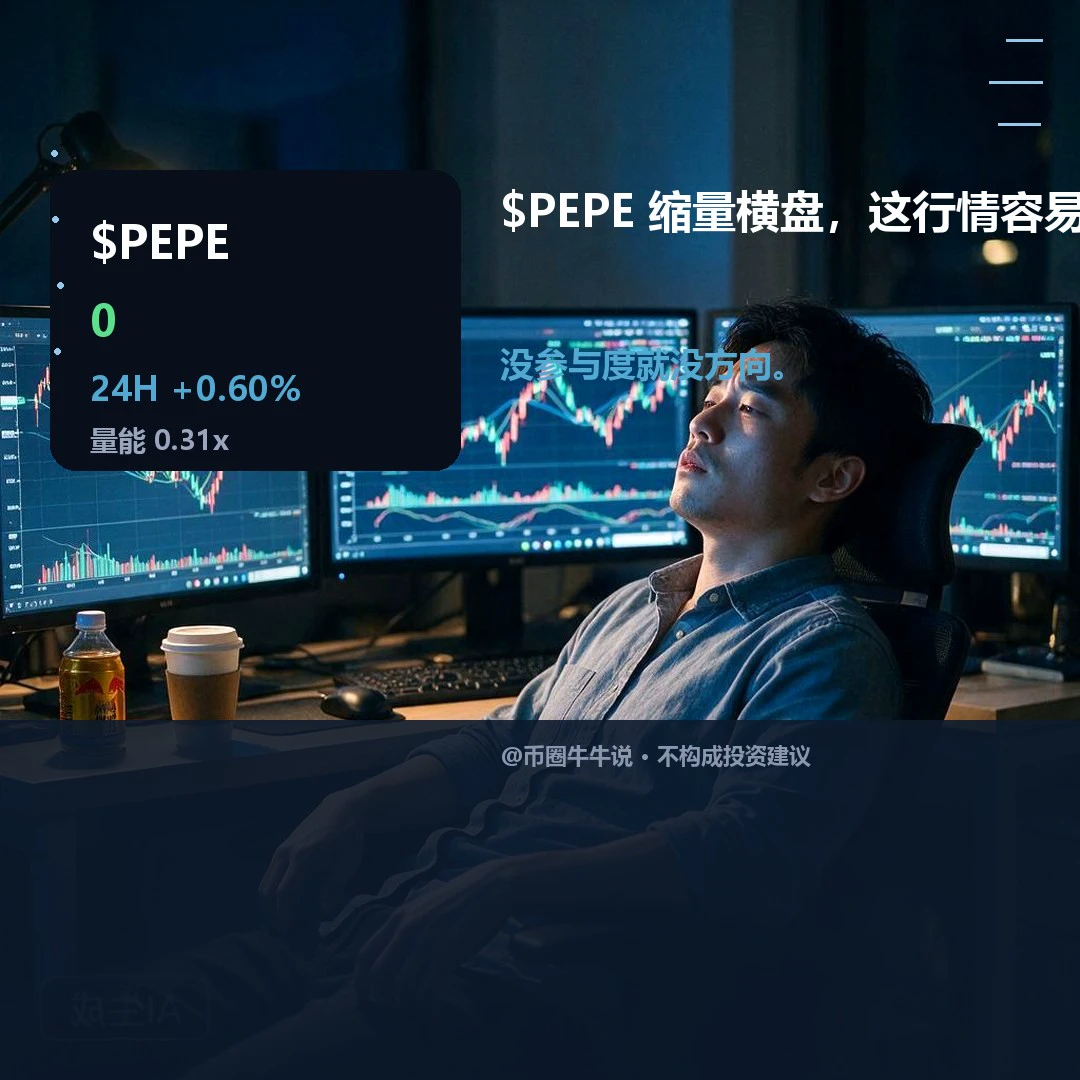
Bullish, but lacking volume confirmation. $PEPE is currently at 0.00000504, with both one-hour and four-hour trends looking strong, but one-hour trading participation is still less than a third of average. The price is already near resistance at the 24-hour high, yet there’s no volume confirmation; if the market is truly willing to chase, why is volume still below 30% of average? A volume-backed break above 0.00000515 and a hold there would strengthen the bullish case; a pullback after a spike would be just appearances. Treating a low-volume rise as trend continuation is most likely mistaking
post-image
PEPE+0.97%
$PEPE After carefully studying its daily chart, the more I look at it, the more I feel there’s significant opportunity here. Its current pattern suggests it could be poised for a major move. It’s not the kind of asset for quick in-and-out trades, but one worth positioning in for the long term. That’s why I’m willing to share it with my fellow traders. This isn’t something to rush into; only those who hold patiently may capture the upside ahead.$PEPE
Risk warning: The above is only my personal opinion and does not constitute investment advice. The crypto market is highly volatile, so please be
post-image
PEPE+0.97%
OpenAI announced that starting in December, Plus, Pro, and Business users will share a unified usage allowance across ChatGPT and Codex, with usage measured in tokens. Real-time conversations won’t count toward the allowance. Once it’s used up, users can wait for it to reset, upgrade, or purchase credits.
This combines ChatGPT and Codex’s two separate budgets into a single pool. People who use Codex heavily may find their ChatGPT allowance runs out faster. OpenAI says most users won’t need to wait for a reset more often, but in practice, it still depends on how demanding each person’s tasks ar
BTC-0.67%
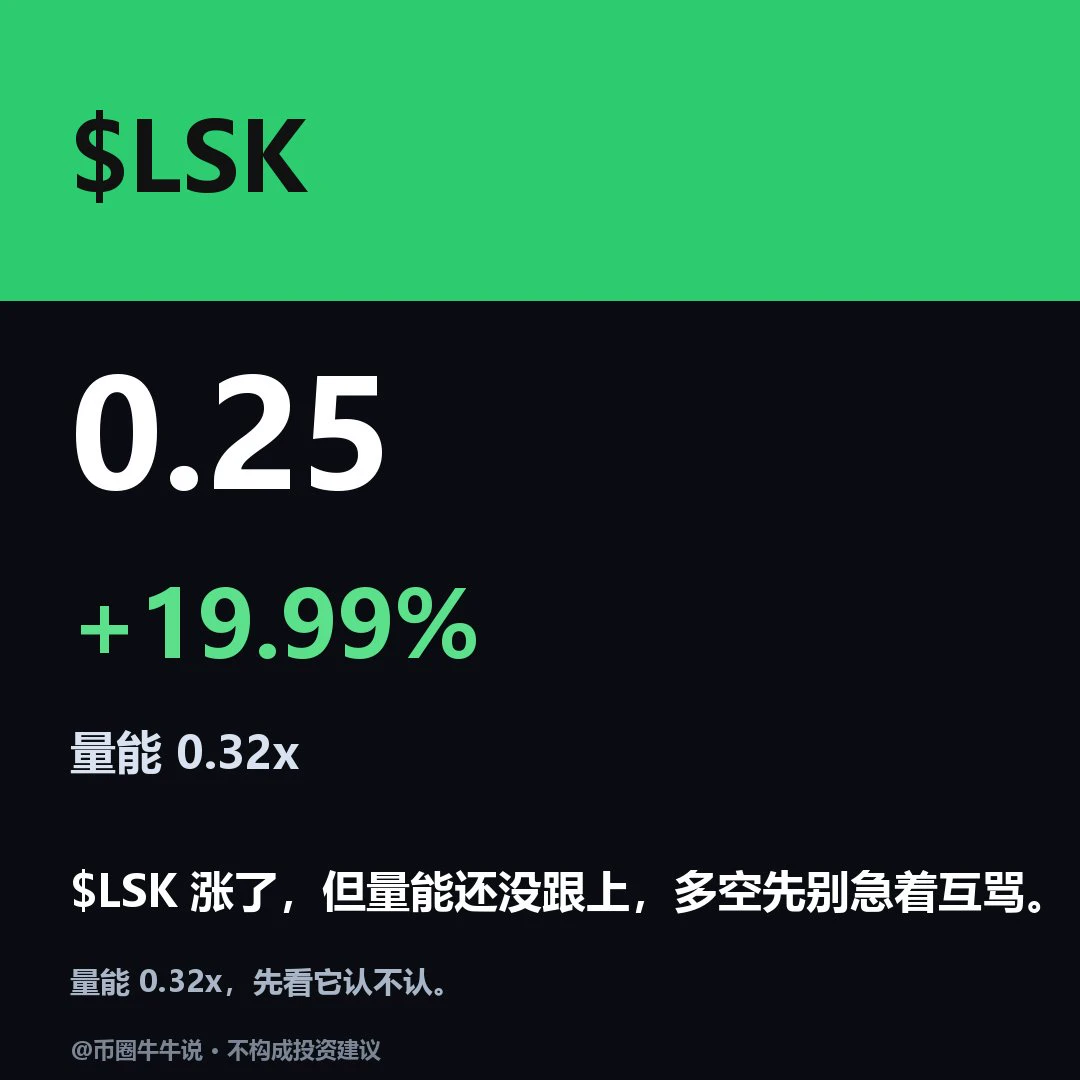
$LSK is currently at 0.2485, up 19.99% in 24H. The 1H timeframe is weak (RSI53.57), while the 4H timeframe is strong (RSI58.85), indicating a divergence. If it holds above the 0.3189 resistance level, continuation may be worth watching; if it breaks below the 0.206 support level, a pullback is possible. Going forward, watch whether it can hold above 0.3189 and whether it can reclaim 0.206 after losing it. The two timeframes remain divergent, and short-term moves do not necessarily signal a trend reversal. The market is volatile; for observation only.
post-image
LSK-5.32%
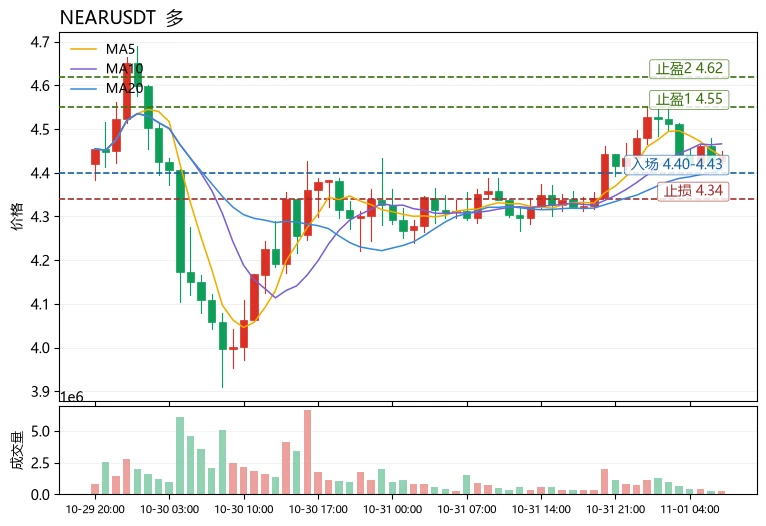
$NEAR Current price: 4.438. Key short-term levels are support at 4.40 and resistance at 4.55, with the price caught in a narrow range between them. The funding rate is +0.0067%, meaning longs are paying to maintain their positions and leveraged capital is skewed bullish. However, the MACD histogram remains at -0.001815, so bullish momentum is unconfirmed and chasing the price carries considerable risk. On the moving-average front, MA5=4.438 is above MA20=4.4071, and RSI=54.4 is neutral to warm. The upper Bollinger Band at 4.55149 is the first resistance. The Fear and Greed Index is at 30, in
post-image
NEAR+1.17%
ADA-1.48%
LSK-5.32%
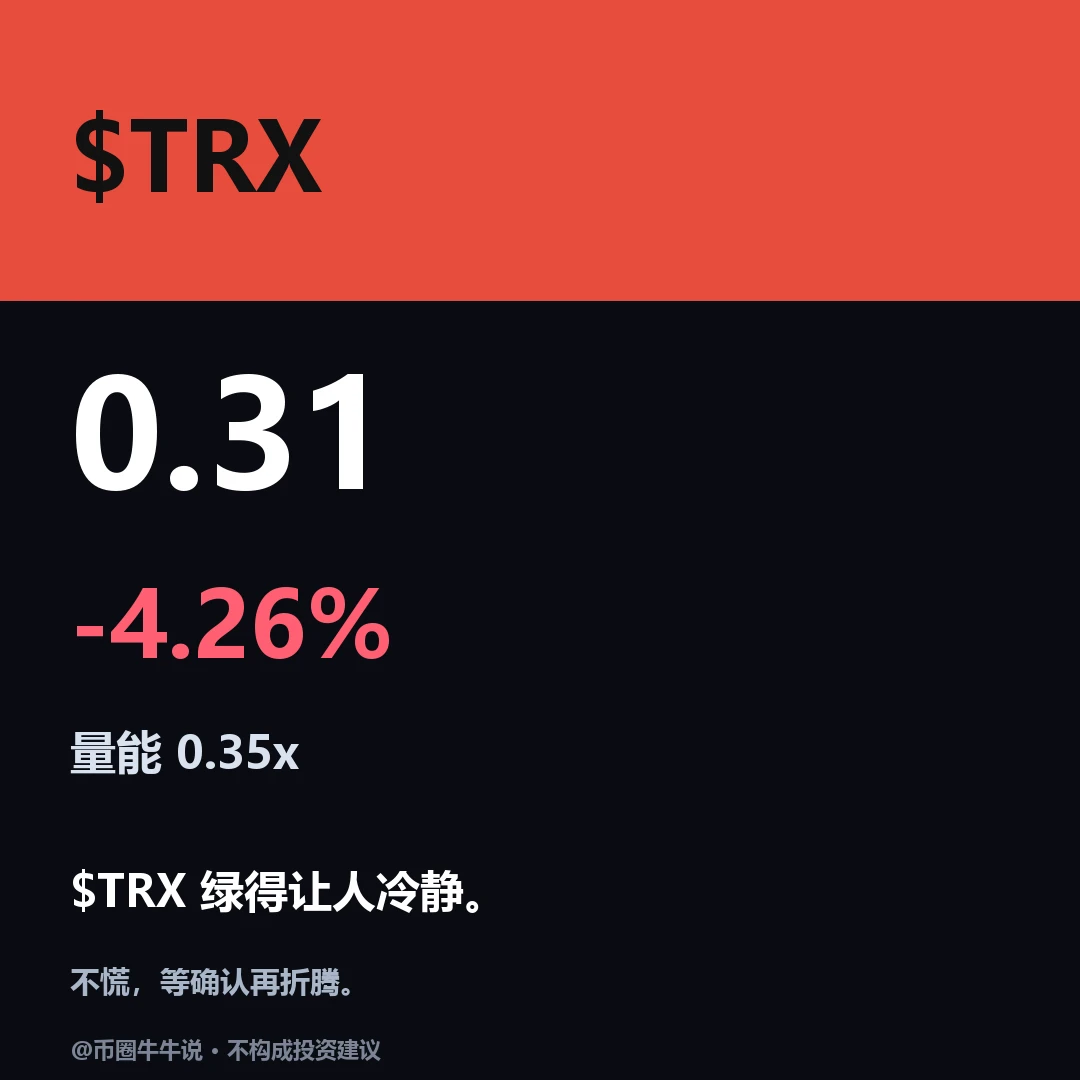
Weakness persists; oversold does not mean a bottom is in. $TRX is currently at 0.308. The one-hour RSI has entered oversold territory, but the one-hour and four-hour trends remain weak, with trading activity below 40% of the average. If buyers are really willing to step in at this level, why hasn’t volume picked up? The price is close to the daily low of 0.302. Oversold only means the price has fallen a lot; it doesn’t mean anyone is defending support. A genuine stabilization requires a surge in volume to break above resistance and hold; until volume confirms it, treating oversold conditions a
post-image
TRX+0.42%
$SOPH Down nearly 50% in a day, from 0.0022 straight to 0.0014. A -34.7% drop like this isn’t a shakeout—it’s a wipeout. Think of it like opening a bubble tea shop: yesterday, orders were pouring in; today, you realize everyone in line was hired by the shop next door. The 73.5M in trading volume looks lively, but with the price crashing like this, real money is behind the selling pressure—it’s not the kind of volume retail panic alone can produce.
The bearish case is straightforward: the 24h low is the current price, which means bears are fully in control and there’s no buying support. With th
SOPH-3.83%
  • 9
  • 2
$NVDA PEPE‏ i m not a pro trader i m bigner but I suggest you please dont hold memes coins @pepe and another memes coin just hold few days and take profit than buy again hold few days and again sell.
NVDA-4.16%
  • 2
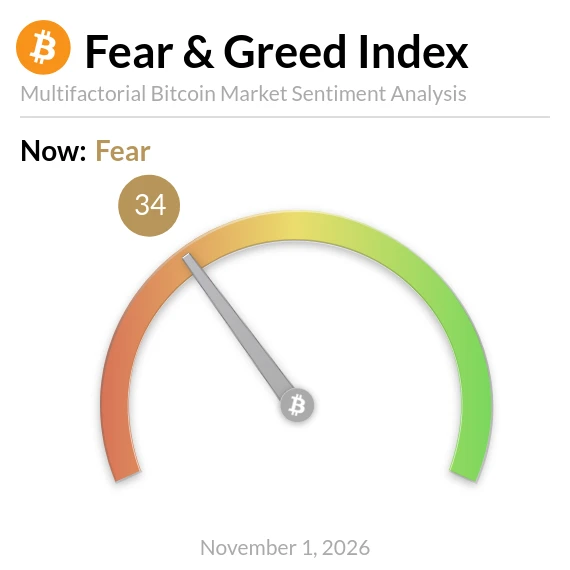
Bitcoin Fear and Greed Index is 34 - Fear
$BTC Current price: $77,530
post-image
BTC-0.67%
  • 1
The decline in US technology stocks in recent months signals not just a price correction, but a deep unraveling in the market structure. The TMT momentum factor, an indicator tracking the fastest-rising technology, media, and telecommunications stocks in recent times, has fallen 62% from its peak. This decline is even sharper than the losses seen during the bursting of the Dot-Com bubble in 2000 and the 2008 Global Financial Crisis.
What's behind this decline?
There's no single reason behind this picture. Over the past two years, investors have approached growth in the artificial intelligence
NAS100-2.31%
EURUSD-0.12%
US30-1.08%
  • 10
  • 1
$WET Looks like another rally may be starting. Long setup—entry: 0.0590 – 0.0596; first take-profit: 0.0615; final target: 0.0640; stop-loss: 0.0555 (tentative). WET has pulled back from 0.0674 and is now rebounding after a healthy correction. Buyers are showing strength again, but need to break through resistance at 0.0600. If bulls break above that level, 0.064 could become the next target. Before trading on $WET using this setup, please confirm the stop-loss.
post-image
WET-8.59%
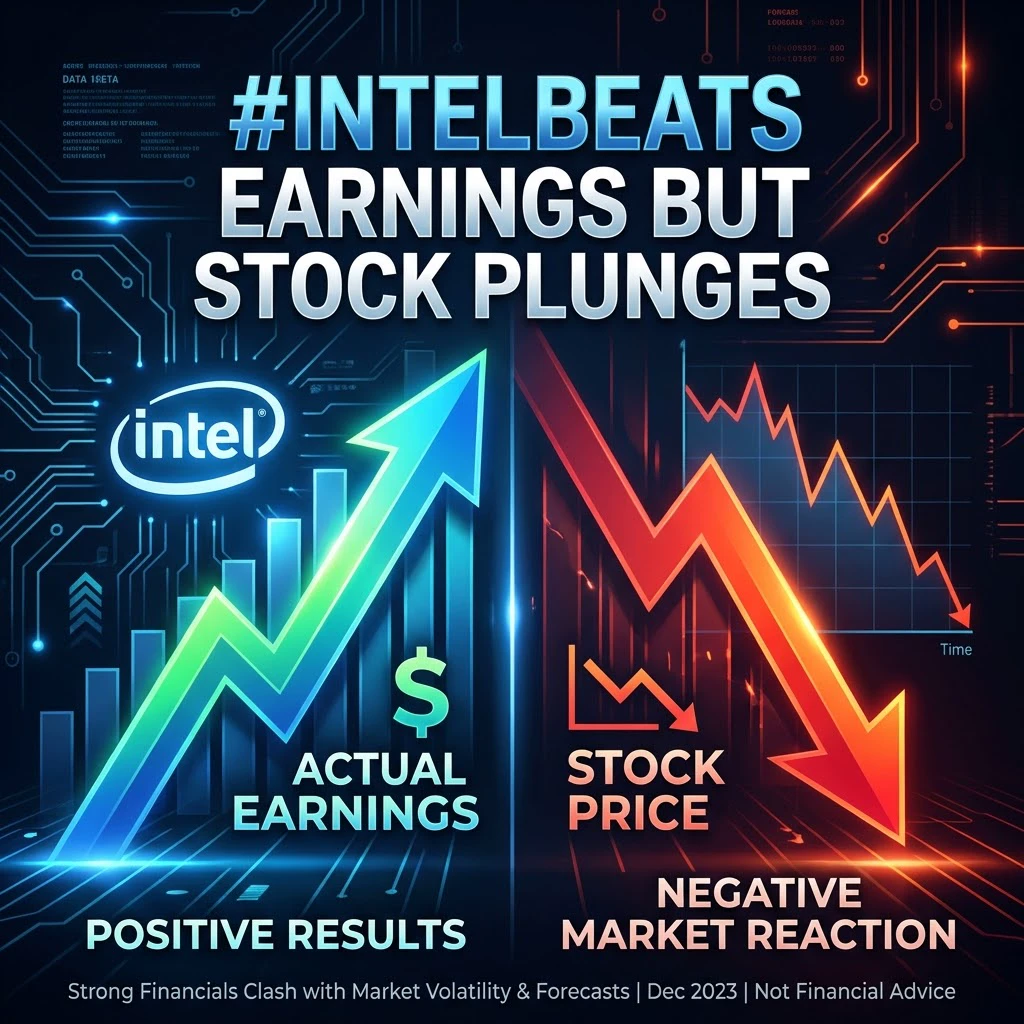
#IntelBeatsEarningsButStockPlunges

Intel Beats Earnings, Yet Its Stock Crashes Nearly 29%: What Did Investors See That the Headlines Missed?
Imagine a company walks into an important exam, scores higher than expected, and still receives a failing reaction from the people watching. That sounds unfair. Yet something remarkably similar happened to Intel after its third-quarter 2026 earnings announcement.
The chipmaker delivered better-than-expected earnings, increased revenue, and reported impressive growth in its data center business. But instead of celebrating the results, investors rushed t
post-image
Iran
USD x Iranian rials End of October?
2.7-2.8M
99%1.01x
2.6-2.7M
2.8%35.71x
$16.65K 24H+5 more
AMZN-1.55%
Load More

Join 40 M users in our growing community

⚡️ Join 40 M users in the crypto craze discussion

💬 Engage with your favorite top creators

👍 See what interests you

Trending Topics

BTC大跌

372.44k Views39.7k Discussing

$BTC briefly fell below $77,000 and remains under pressure around the $77K zone, with its 24-hour decline still above 4%. With risk appetite weakening and Fed uncertainty rising, where is the next key support after losing $80K?

IntelBeatsEarningsButStockPlunges

29.47k Views928 Discussing

StrategySTRCNears100ParValue

35.8k Views4.12k Discussing

View More