Share your thoughts
placeholder
Article
A few days ago, I was still calculating whether I had enough money for instant noodles this month; this morning, I was already wondering whether to add a sausage.
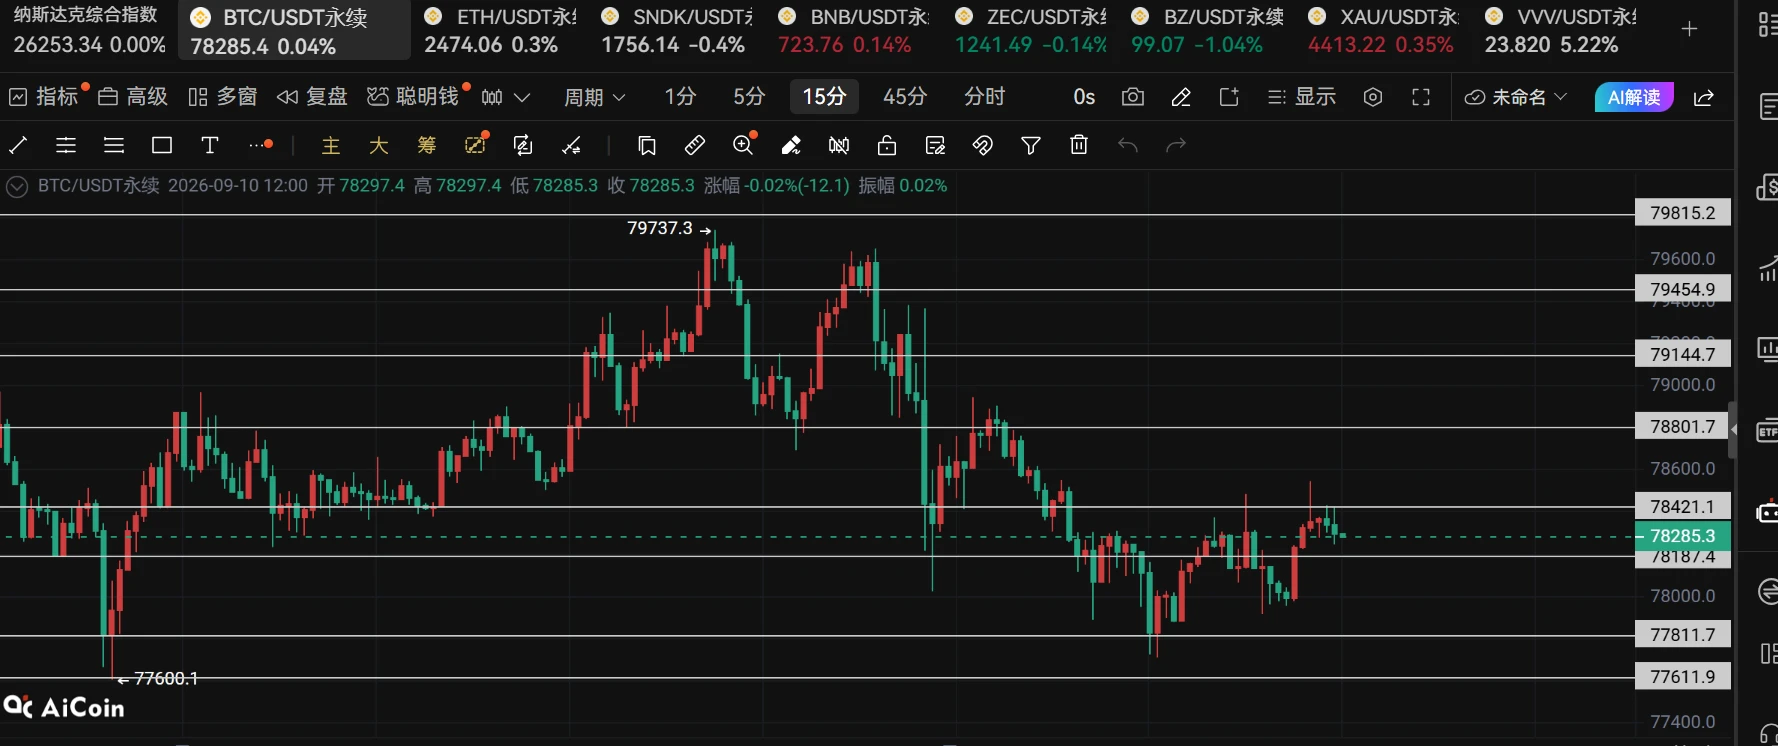
I took one last look at the chart before bed, and the $BTC trend was incredibly steady. It was bottoming without breaking down, getting steadier the longer it consolidated, while large orders were also slowly testing the waters. Before going to sleep, I placed a 77967.8 long position. My expectations weren't high—if it could run, I'd let it run.
As soon as the market opened this morning, the profits came knocking. The price hit 7860
post-image
BTC-0.32%
SNDK-0.01%
SOL+0.33%
Simple and easy, nailed it!!!
Nobody is talking about this SYMBOL setup yet.

$HYPE /USDT - LONG

Trade Plan:
Entry: 84.07 – 84.51
SL: 82.18
TP1: 85.87
TP2: 86.92
TP3: 88.50

Why this setup?
Why now? The daily trend is bullish and the 1h price is sitting right at the entry zone of 84.29, which means momentum is stacked for a long. The 15m RSI at 58.62 shows room to run before overbought, while the 1h ATR of 0.877238 confirms enough volatility to reach the first target of 85.87 and push toward 86.92. The invalidation level at 83.52 is the hard line in the sand that protects this thesis.

Debate:
Are we hitting TP2 or ge
HYPE-1.47%
Above 78800, open a small short position! In the short term, first look for a pullback to around 78300! $BTC
post-image
BTC-0.29%
#Gate用户突破6000万
I joined Gate in January 2025, mainly because I was curious about crypto and wanted to understand how trading actually worked. At that time, charts looked exciting, but honestly, half the candles felt like they were moving just to confuse me. 😂
MY FIRST TRADE
I still remember the nervous feeling before placing my first trade. I entered without fully understanding how quickly price could move against me. My first position was less about making money and more about getting my first real lesson from the market. The moment I saw the position move into loss, I understood something
post-image
BTC-0.29%
  • 1
  • 1
Crypto Market Updates
live-cover
LIVE2,261
zcash:native Crossed first target, High 1256.98 so far. #ZECUSDT
post-image
ZEC+2.52%
[New Streamer] Whales Move in Sync!
live-cover
LIVE2,639
the moment you realize basecat:native is not trading like a dex/onchain coin anymore (makes sense considering BASE chain is not active) but more like a CEX coin
perfect listing wick touch. rebought whatI had sold here
at this point I keep trading it just to flame Coinbase and Base
COIN-2.40%
Everyone watching SYMBOL long just got blindsided by the real setup.

$SKHY /USDT - SHORT

Trade Plan:
Entry: 187.77 – 188.85
SL: 195.10
TP1: 183.21
TP2: 179.82
TP3: 174.72

Why this setup?
Why now? The daily trend is range, meaning the market is coiling for a directional break and the short bias has a 77.4 percent confidence score behind it. The 1h ATR at 2.177804 shows enough volatility to reach the targets without a squeeze, while the 15m RSI at 69.85 proves we are not yet overbought on the shorter timeframe. The entry zone between 187.77 and 188.85 around the 1h price of 188.31 gives a
SKHY+3.56%
What’s hardest about trading isn’t understanding the market, but acting decisively once you do.

The BTC short trade was completed from start to finish: resistance was mapped out in advance, the rebound provided an entry window, the position was followed during the session, and exited when the target was reached.
A partner followed with 23,000U and made 8,407U on one trade.

I notify, you execute. No empty talk—only the actual results in your account. #Gate上线打金狗限时免Gas费 $BTC
BTC-0.32%
$INTC +10.20% 🍀🎉
My Intel long is printing. Shared live with subs 📈
post-image
INTC+10.44%
𝗜𝗠𝗢𝗘𝗫 𝗠𝗮𝘆 𝗛𝗼𝗹𝗱 𝗔𝗯𝗼𝘃𝗲 𝟱𝟬-𝗗𝗮𝘆 𝗠𝗼𝘃𝗶𝗻𝗴 𝗔𝘃𝗲𝗿𝗮𝗴𝗲
🇷🇺 Market experts see a stronger chance for the IMOEX to maintain levels above its 50-day moving average this time, compared with last month when the index failed to hold that level.
A sustained move above the 50-day MA could improve the short-term technical outlook and signal stronger buyer confidence. Traders will be watching whether IMOEX can turn this key level into lasting support.
$TSLA
#IMOEX #RussiaStocks #StockMarket #Trading
post-image
TSLA+4.18%
  • 7
Only green candles for #DROVERINU , $CKOM , #HYDRACHAIN #DOGS #PEPE , $DROVER , $DOGE , $KAS , $ICE , $FLOKI , $PI , $CORE , $BNB , $PEPE , ripple:native , #DOGS
Any Other ⁉️👇 this week‼️
#HODL
post-image
DOGS+14.99%
PEPE+1.02%
DOGE+0.51%
KAS-0.77%
FLOKI+1.59%
  • 2
$PFE First target done, High $29.21 so far.
PFE-1.91%
I only meant to freeload on breakfast, but the market ended up making me the dumpling for half a year 🥟 No trades, no analysis, just surviving on sheer luck? No—it was intuition plus discipline, and I seriously reviewed this whole move.
When the market plunged intraday, $ORDI was dumped straight down to 3.466, and many people panicked, cut their losses, and fled. But what I saw was that the key level had held, while trading volume kept shrinking as the price fell, which showed that the holders weren't actually shaken out—it was just panic selling feeding on itself. I bought in on the rebound
post-image
ORDI+1.53%
ZEC+2.51%
SOL+0.33%
Everyone calling $USELESS /USDT a buy is about to get wrecked.

$USELESS /USDT - SHORT

Trade Plan:
Entry: 0.29159 – 0.30067
SL: 0.35280
TP1: 0.25363
TP2: 0.22529
TP3: 0.18279

Why this setup?
Why now? The 4h structure is stacked for a short play with 84% confidence, even though the 1D trend is still bullish. The 1h ATR of 0.018163 shows momentum is expanding enough to fuel a leg down from the entry zone around 0.29613. Meanwhile the 15m RSI sitting at 75.23 signals overbought exhaustion at those exact prices, setting up the reversal. The invalidation level is 0.20396, and anything above it
USELESS+29.32%
#MarscoinDropsOver10%
My comment: This looks more like a sharp correction than a confirmed trend reversal; however, the risk of a reversal has increased significantly.
It shows a dramatic rise in early September, reaching an all-time high of around $0.263 on September 5th, followed by a pullback.
Why is a correction possible?
* The movement was extremely rapid: Even after the pullback, it increased by approximately 70% in 7 days.
* A spot listing on another exchange was a significant catalyst, reportedly causing an increase of approximately 73% in 24 hours.
* After a weekly move of over 100%,
post-image
MARSCOIN-6.74%
  • 5
  • 1
$SPCX 4H
Breaks above a high
Strong upward momentum
Bullish
post-image
SPCX+2.98%
$MU /USDT is about to break range and nobody is watching.

$MU /USDT - SHORT

Trade Plan:
Entry: 1017.54 – 1022.74
SL: 1045.06
TP1: 1001.45
TP2: 988.99
TP3: 970.31

Why this setup?
Why now? The daily trend is range, but the 1h price at 1020.14 is sitting at the upper edge of the entry zone between 1017.54 and 1022.74, and the 15m RSI at 44.86 shows momentum is already fading. The 1h ATR of 10.38 tells us this asset moves roughly ten dollars per hour, so any push above 1020.14 is likely to be short-lived. Targets sit at 1001.45 and 988.99, with the invalidation level at 1005.28 acting as the
MU-2.09%
Load More

Join 40 M users in our growing community

⚡️ Join 40 M users in the crypto craze discussion

💬 Engage with your favorite top creators

👍 See what interests you