Square
Following
Hot
News
Profile
Share your thoughts
placeholder
Article
crypto market update
live-cover
LIVE1,958
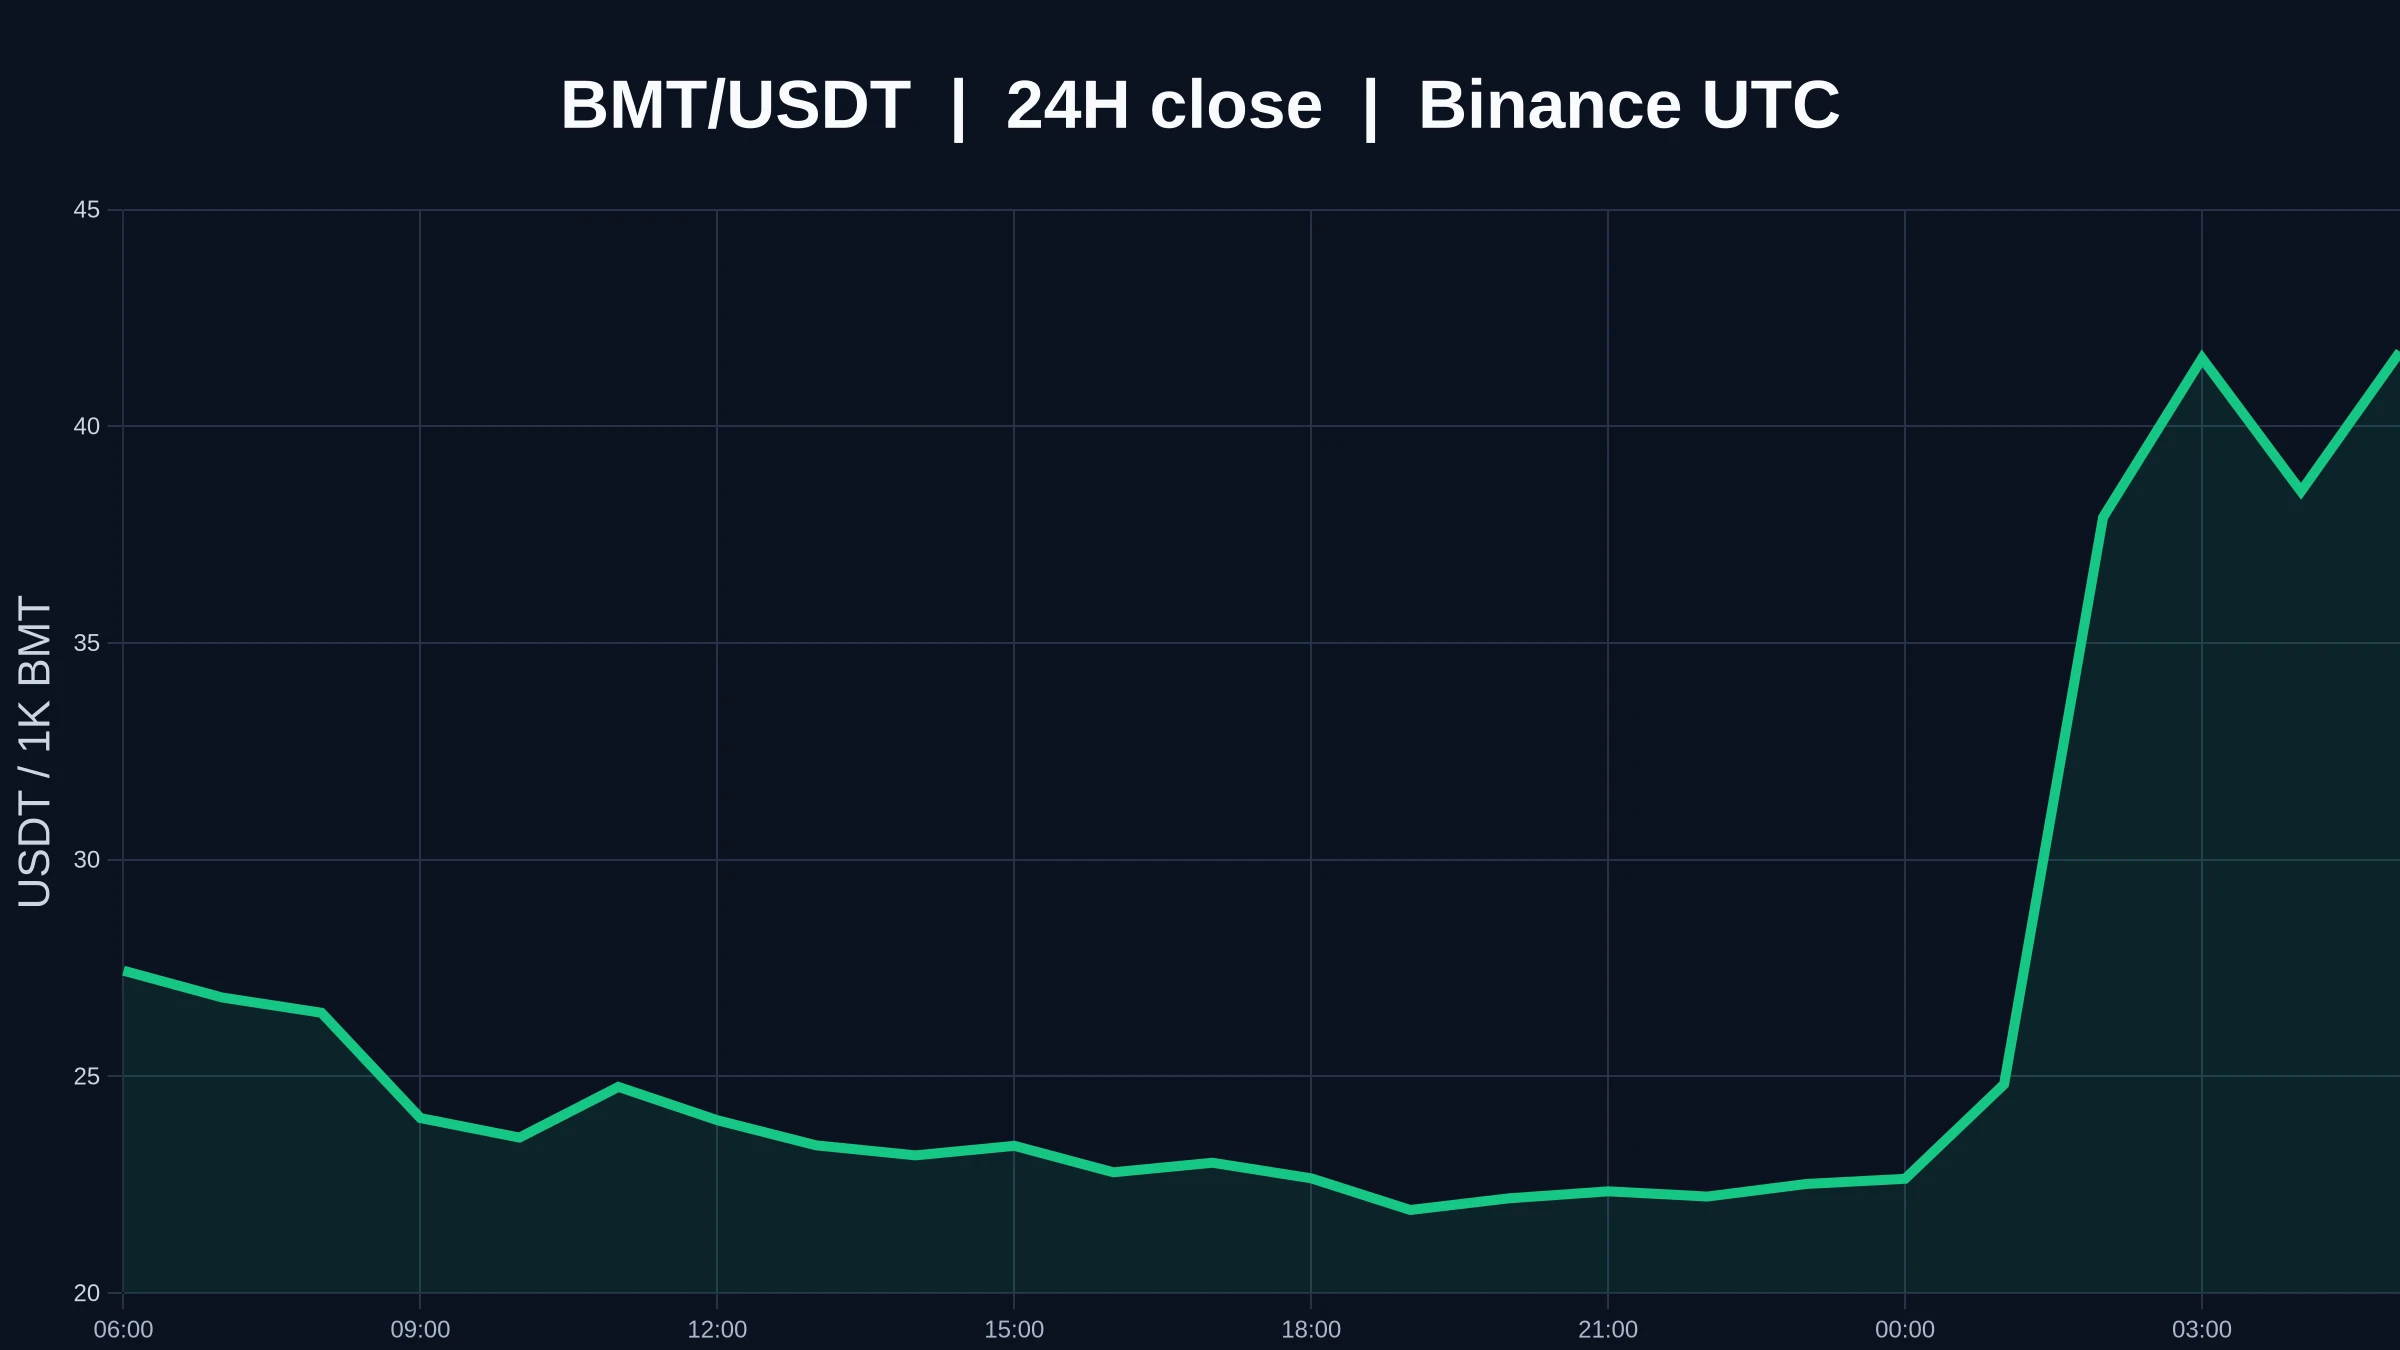
What’s most worth watching on this $BMT chart isn’t the 47.38% gain over 24 hours itself, but that the 1-hour and 4-hour signals are both strong yet haven’t given the same answer.
$BMT is currently at 0.04156 USDT, up 47.38% over 24 hours, but it has stalled at resistance around 0.05144, while support at 0.02183 is still holding. Both the 1-hour and 4-hour signals are marked strong, and trading participation is 2.04x, suggesting plenty of buying, but the strength of the latest activity near the highs is worth questioning.
Strength often comes with crowded positioning, and $CRCLB also posted an
post-image
BMT+55.04%
PEPE-3.03%
WLD-13.58%
Trenches
ZIG
Z
bade
b
ZIG
0x8c...1145
Market Cap
$.
Change
.
24h Vol
$.
Holders
.
YMB
Y
bade
b
YMB
2TKD...pump
Market Cap
$.
Change
.
24h Vol
$.
Holders
.
AGT
A
bade
b
AGT
0x5d...e274
Market Cap
$.
Change
.
24h Vol
$.
Holders
.
CNPY
C
bade
b
CNPY
0xc6...ddd2
Market Cap
$.
Change
.
24h Vol
$.
Holders
.
BIRB
B
bade
b
BIRB
G7vQ...KNwG
Market Cap
$.
Change
.
24h Vol
$.
Holders
.
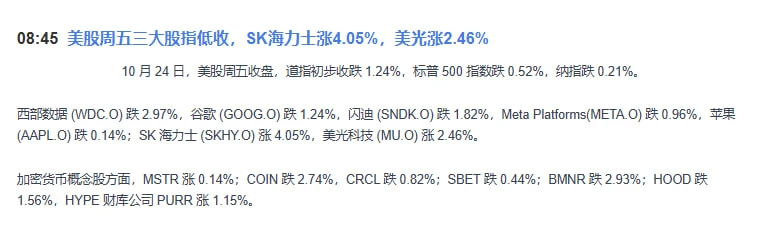
The strangest thing is: $SKHYNIX funds are pouring out, yet the price is holding firm at 950
100 million in funds flowed out over 3 days, while bears kept adding to their 280 million position.
By normal logic, this should have crashed straight through.
But it just won't fall.
More importantly, a massive short liquidation zone has already built up above 960. If the price is pushed higher, those short positions could instead become fuel for the bulls.
So what I’m most suspicious of now isn’t “whether it will rise,” but: who are the big players waiting to see crack first?
My thinking is simple:
post-image
SKHYNIX-1.21%
  • 4
  • 2
You act like telling you to read more was such a hardship.
See? It came in handy right when it mattered. 🤣
post-image
$CT This -17% bearish candle flattened the bulls. From 0.2298 to 0.1862, nearly 19 points of volatility in 24 hours, with 29.6M in trading volume. This isn't a low-volume drift downward; it's a heavy-volume sell-off, and the signs of capital fleeing are all too obvious.
Looking at the candlestick structure, 0.2298 was a previous high-volume trading zone. Today, a large bearish candle with a solid body cut straight through it, with no lower wick to offer resistance—a classic breakdown pattern. 0.1862 is the 24-hour low and the first test of a potential low in this current decline. Note that aft
CT-14.97%
#SpotGoldFallsBelow$4000
Spot Gold Falls Below $4,000: Inflation Fears, Oil Prices, and Interest Rates Shake the Market
Gold has experienced a significant setback after spot prices fell below the psychologically important $4,000-per-ounce level on October 23, 2026. The metal touched an intraday low near $3,975, marking its weakest level in approximately three months. Gold also faced a weekly decline of around 4%, its sharpest weekly loss since June. This move has raised an important question for investors: is the market experiencing a temporary correction, or is the pressure signaling a deepe
#GateQ3ReportReleased #ShareWeekly
Gate: Delivering Record Growth Across Every Dimension of a True Multi-Asset Financial Ecosystem
Gate continues to set the standard for what a modern, connected financial platform can achieve. In Q3 2026 the platform delivered outstanding results across trading, wealth management, traditional finance access, and overall ecosystem strength, proving once again why it stands among the industry leaders
September derivatives trading volume reached an impressive $396 billion, marking a powerful 38.2% month-over-month increase. This performance placed Gate firmly am
Handwriting it all out must be quite a bit of work for one day, huh
How about we use proper paper next time
post-image
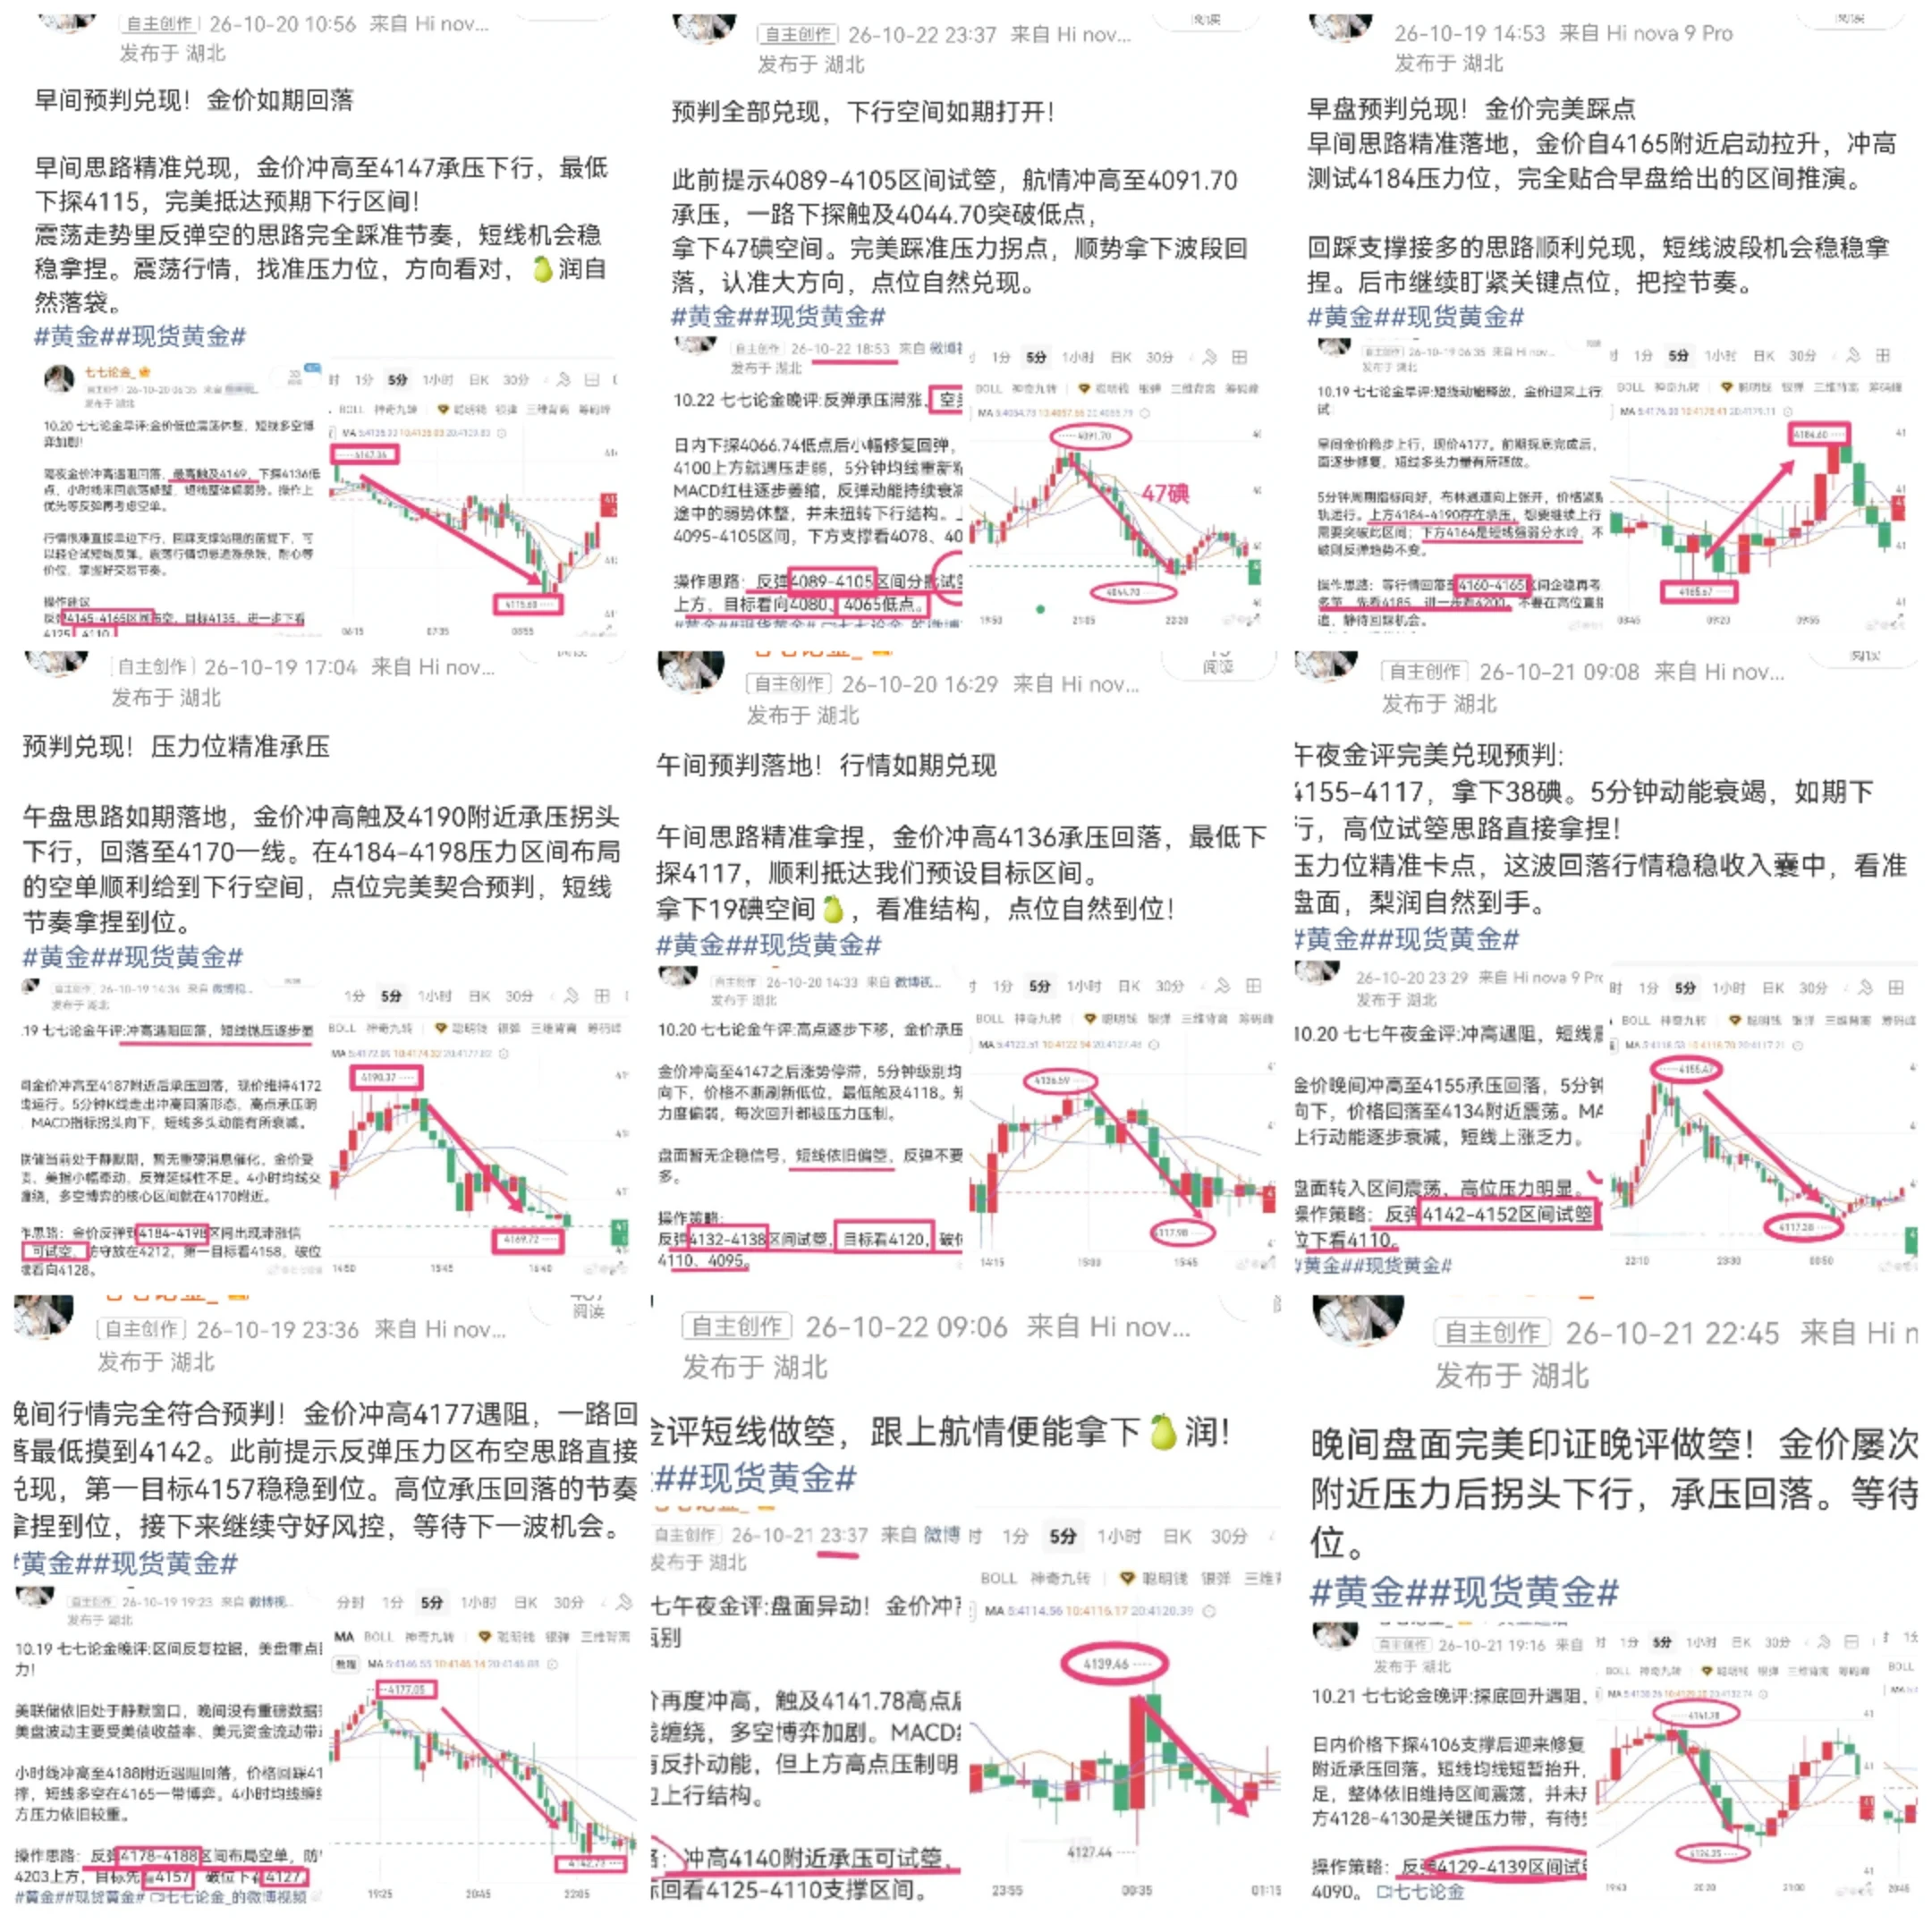
Golden Silk Road Summary (10.19-10.23)
This week, our forecasts stayed in sync with market movements, with strategies across multiple timeframes repeatedly paying off. The entry and exit levels in our morning, midday, and evening reviews precisely captured swing highs and lows. Despite repeated intraday shakeouts, we remained firm on the main direction, capturing swings around key levels and steadily building gains amid volatile market conditions!
The market surged before pulling back. The rebound early in the week met resistance, followed by wide-range choppy trading and shakeouts midweek. Mo
post-image
XAU-0.60%
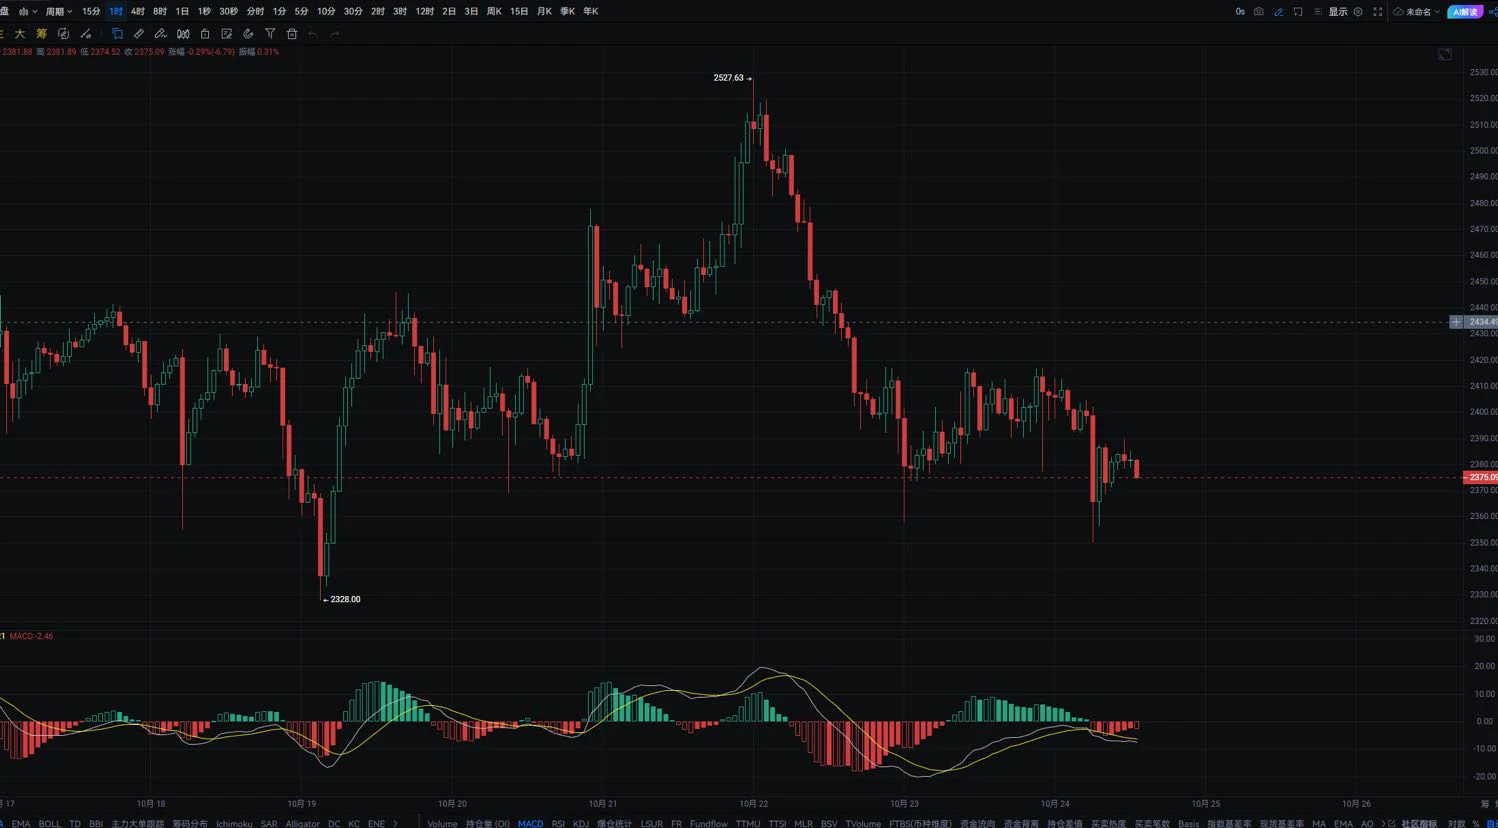
$ETH ETH is currently at 2375, and its price action continues to weaken in tandem with BTC, with very limited independent buying and generally weak resilience. It remains under sustained pressure on the daily timeframe, with the moving averages forming a resistance band that makes it difficult for rebounds to sustain a move higher. On the four-hour timeframe, near-term support sits around 2350, a key level in the recent tussle among market participants. If BTC continues to decline, ETH could easily follow with a high-volume breakdown, potentially moving toward the 2280 area. The nearest resist
post-image
ETH-1.06%
Which path should I take, and how should I make money? Ten years, one dream; one dream, ten years
$MAGMA Down 45% in a day, and at 0.2784, I’d advise you not to rush into buying the dip, because the real bottom could be at 0.18. With $164 million in 24-hour trading volume, what does such a high turnover rate tell you? Panic selling isn’t over yet, and the longs have just been through the first round of liquidations. Technically, 0.2755 is today’s low and support at the previous daily-chart high; if it breaks, the next area to watch is 0.18–0.20. But note that this kind of brutal shakeout is often accompanied by a V-shaped reversal. If the 4-hour candle closes above 0.30, short covering cou
MAGMA-46.15%
we all feel this, we all want fast lot 😆☕☕☕🍦🍦
#BTC #btc #alt #altcoins
post-image
BTC-1.19%
ALT-6.97%
#GateQ3ReportReleased 📊 Gate Q3 Report Released! Key Highlights and Market Insights 🚀
Gate has released its Q3 report, bringing fresh insights into the platform’s performance, growth, and development in the crypto industry.
📈 Investors and crypto enthusiasts are watching closely to understand Gate’s latest progress, trading activity, ecosystem expansion, and future opportunities.
💡 Quarterly reports provide valuable information about platform performance and help the community better understand the direction of the crypto market.
🔥 What could Gate’s latest results mean for its ecosystem a
post-image
GT+0.10%
#KOSPIFallsNearly4% KOSPI Falls Nearly 4 Percent as Market Pressure Tests Investor Confidence
South Korea’s stock market is facing renewed pressure as the KOSPI index falls nearly 4 percent, putting investors on alert and highlighting the uncertainty currently affecting Asian financial markets. A decline of this size can quickly change market sentiment, especially when investors are already watching global technology stocks, interest rate expectations, currency movements, and economic signals.
The important question is not simply why the market is falling, but what this move could mean for inv
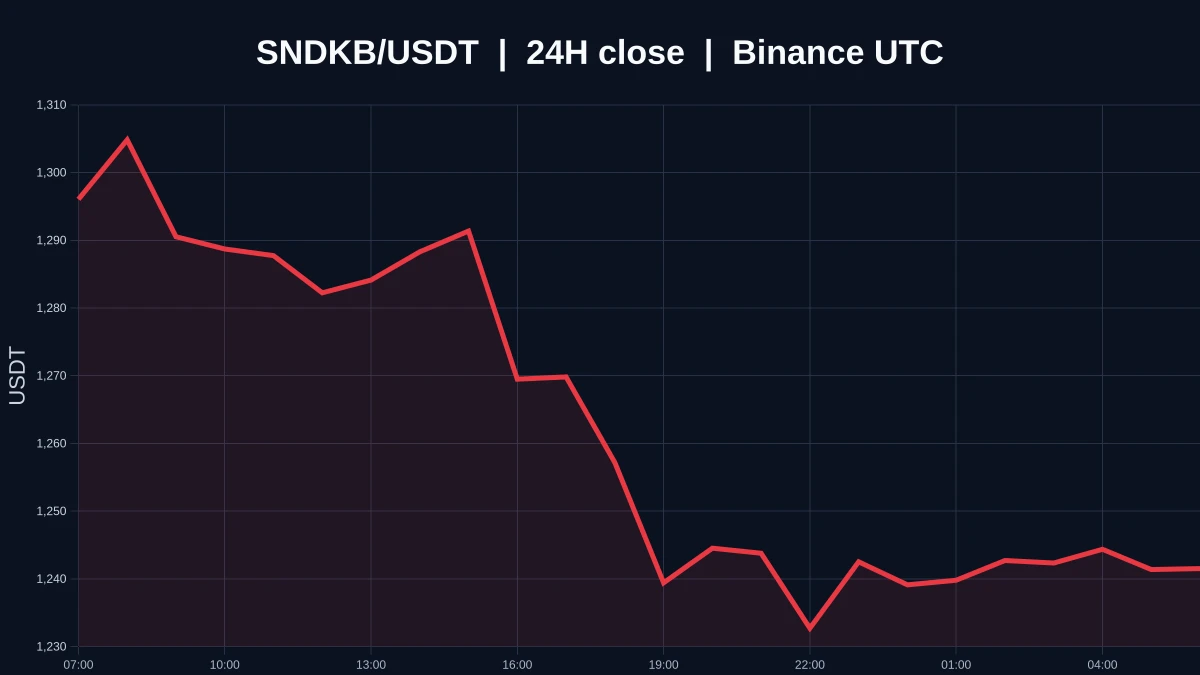
$SNDKB is currently trading at 1241.52, down 4.24% over the past 24 hours. The 1H trend is weak, with an RSI of 30 and the EMA20 at 1253.2 overhead. The 4H trend is also weak, with an RSI of 27.6 and the EMA20 at 1292.1 acting as resistance. Price is currently between support at 1228.89 and resistance at 1316.68. If it holds above 1316.68, watch for further upside; if it breaks below 1228.89, the structure may weaken. In the next review, focus on whether price can hold above 1316.68 and whether it can reclaim 1228.89 if that support fails. Market volatility is high; for observation only.
post-image
CFTC monitoring predection markets for manipulation
live-cover
LIVE2,746
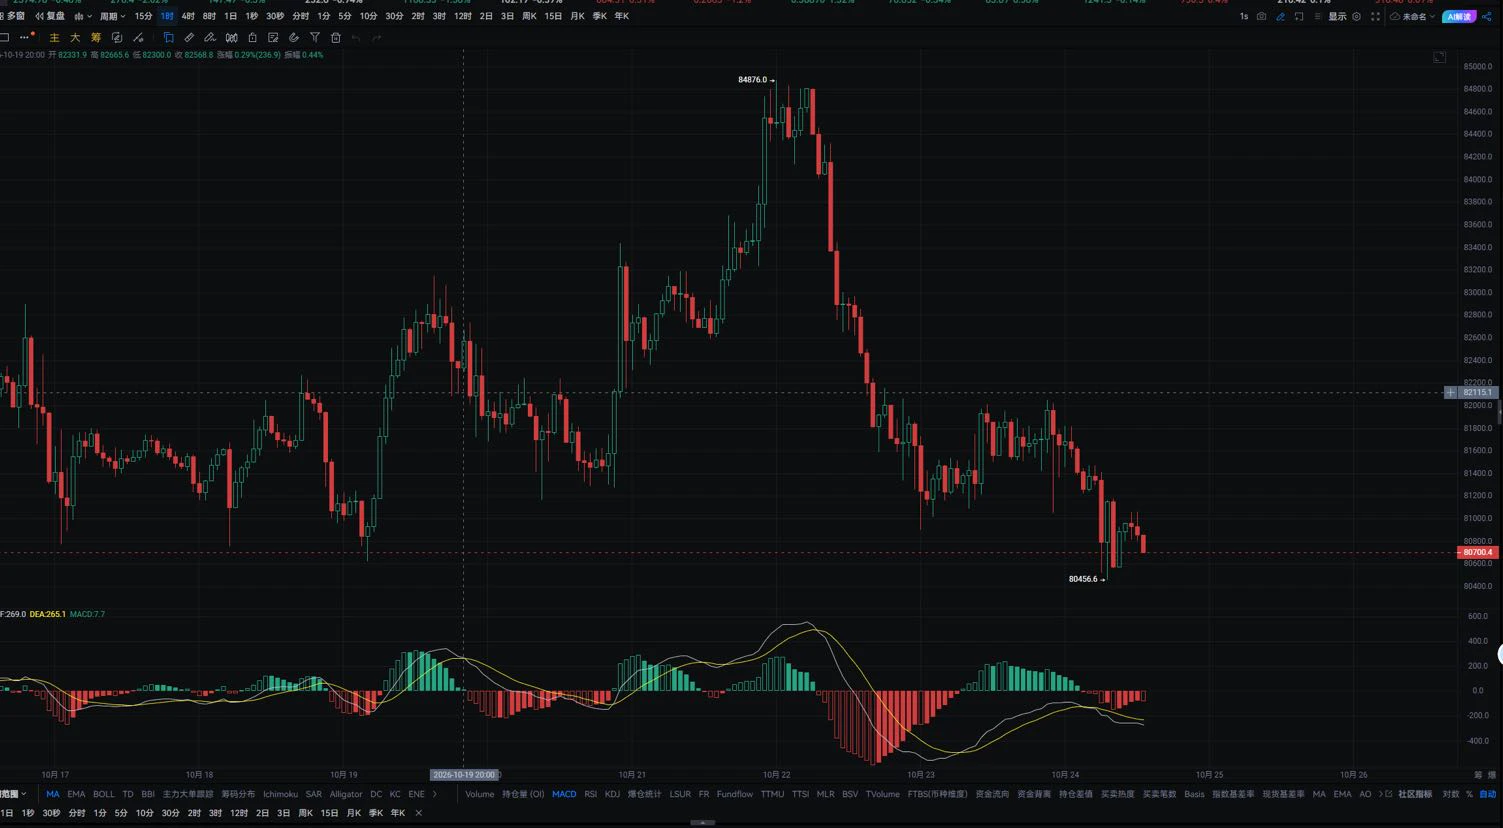
$BTC BTC is currently at 80710. The market continues to trade in a weak, choppy pattern, with the daily trend moving steadily lower. Selling pressure overhead has not eased noticeably, and short-term rebounds have been weak. On the four-hour chart, repeated attempts to stabilize have failed, while buying support remains limited and bulls currently lack the momentum to drive prices higher. Short positions account for a relatively high share of futures positions, so a break below support could easily trigger cascading stop-losses. Near-term resistance is concentrated around 81500, a key battlegr
post-image
BTC-1.19%
Yield is becoming a key metric in crypto.
Grayscale’s latest ranking puts $HYPE , $LIT and $CAKE at the top for tokenholder yield, followed by $AERO and $UNI .
On adjusted earnings yield, $CAKE, $LIT and $HYPE remain the top three, with $RAY and $AAVE next.
The interesting part: several assets rank highly across both metrics, suggesting stronger underlying yield profiles are getting more attention.
Worth watching as the market weighs fundamentals alongside price action. #RAY #AAVE #USEarningsSeason
HYPE-2.41%
LIT-8.74%
CAKE-2.08%
AERO-8.86%
UNI-4.67%
When people stop following old patterns, new opportunities emerge.
The crypto world’s attention shifted overnight, yet Pi Network continues to grow after the hype fades: 420k+ nodes support distributed computing power, SoloHost puts local AI within easy reach, and protocol upgrades move forward steadily.
It doesn’t chase the noise; it focuses on practical utility—true value never needs hype to prove itself.
post-image
PI-1.54%
  • 2
Load More

Join 40 M users in our growing community

⚡️ Join 40 M users in the crypto craze discussion

💬 Engage with your favorite top creators

👍 See what interests you

Trending Topics

USEarningsSeason

34.9k Views3.15k Discussing

The U.S. Q3 earnings season is in full swing, with major tech companies including Tesla and Meta reporting results. Market focus is shifting beyond revenue and profit toward AI spending, capital expenditure, margins and forward guidance. Which company’s earnings are you watching most closely?

GateWCTCS9GlobalTradingCompetition

507.15k Views7.75k Discussing

USConsumerSentimentNearRecordLow

348 Views138 Discussing

View More