
Share your thoughts
placeholder
Article
These returns have me feeling both thrilled and uneasy, afraid the market will catch on tomorrow and blacklist me😂
I just checked the market again, $DASH climbed from 39.86 all the way to 62.27, with current unrealized profit at +2708.27%. Honestly, the luckiest thing this round was not buying early, but being able to hold on.
While everyone else was exiting, it kept moving sideways at key levels without breaking down, with funds buying every pullback. That already says a lot. I only did one thing at the time: stay in and hold tight.
This is not the time to add to the position, and that must
post-image
DASH-0.79%
SOL-0.52%
BNB+1.58%
Stock Product Lineup · New Member — Event Contracts 🚀
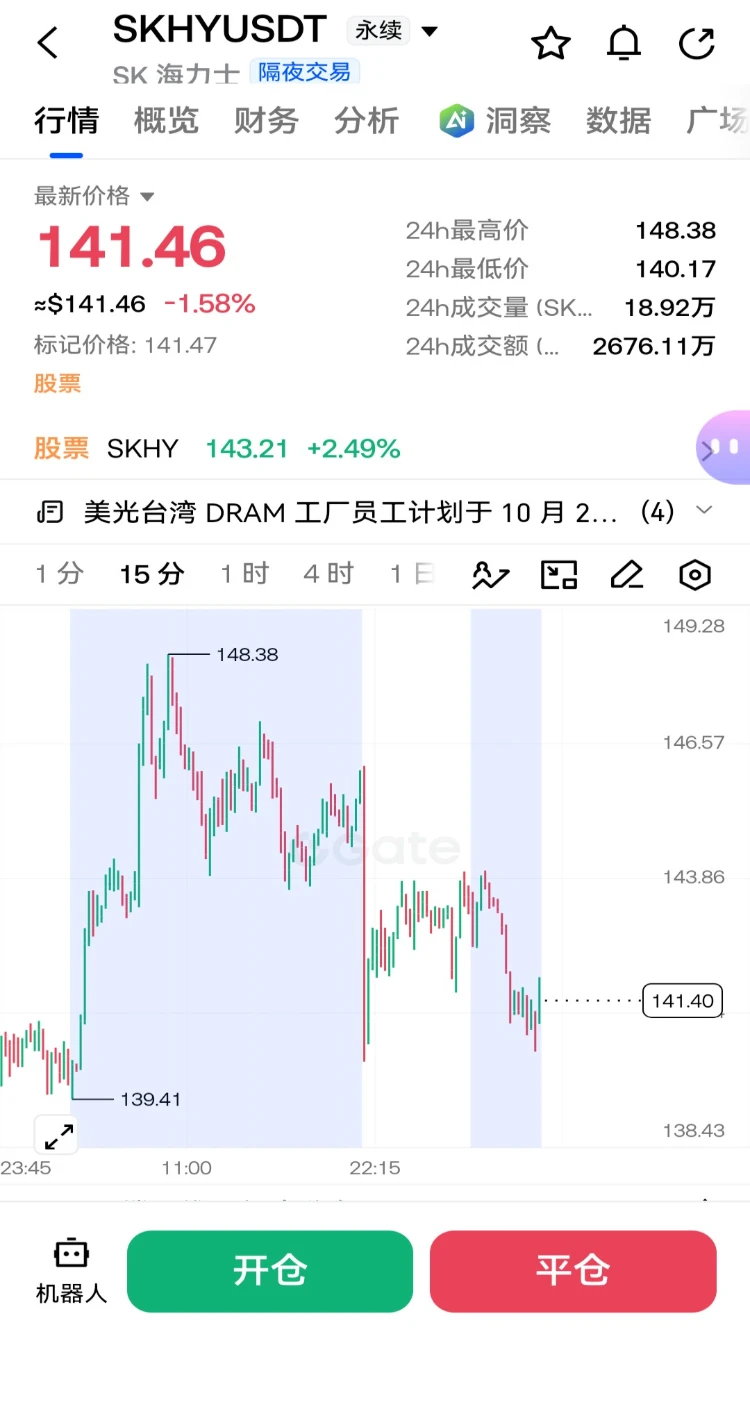
Four stock underlyings now live with 5-min / 15-min bull & bear trading:
🇺🇸 US Stocks: MU, SNDK (pre-market / intraday / after-hours) 🇰🇷 Korean Stock: SKHYNIX 🇨🇳 A-Share: Unitree Robotics
No leverage. No margin. Just predict short-term price direction: ✅ Lower barrier to entry — direction-only trading ✅ Choose Bullish or Bearish; auto-settlement at expiry ✅ Early close supported, with take-profit & stop-loss
Crypto Event Contracts also available: BTC, ETH, SOL, XRP, DOGE, HYPE, BNB
How to trade: Gate App (v8.36.0+) or website → [Futu
Gate_Square
Stock Product Lineup · New Member — Event Contracts 🚀
Four stock underlyings now live with 5-min / 15-min bull & bear trading:
🇺🇸 US Stocks: MU, SNDK (pre-market / intraday / after-hours) 🇰🇷 Korean Stock: SKHYNIX 🇨🇳 A-Share: Unitree Robotics
No leverage. No margin. Just predict short-term price direction: ✅ Lower barrier to entry — direction-only trading ✅ Choose Bullish or Bearish; auto-settlement at expiry ✅ Early close supported, with take-profit & stop-loss
Crypto Event Contracts also available: BTC, ETH, SOL, XRP, DOGE, HYPE, BNB
How to trade: Gate App (v8.36.0+) or website → [Futures] → [Event Contracts] → filter [Stocks]
Start on Web now 👉 【https://www.gate.com/zh/trade-events/us-mu-updown-5m?eventId=e16176&outcome=Up】
⚠️ Derivatives trading carries high risk. Please read the product rules carefully before trading.
#Gate #EventContracts #StockEventContracts #MU #SNDK
repost-content-media
MU-1.47%
SNDK-0.11%
SKHYNIX+0.46%
UNITREE-2.32%
BTC-0.91%
In 2004, newspapers had already written your fate: the ten most insanely profitable industries—real estate, highways, funeral services, driving schools, electricity, cable TV, healthcare, education, textbooks, and online gaming.
It is the bill for your entire life: education bleeds you dry from birth; after graduation, six wallets buy a home to bail out the rich; at work, you pay electricity and internet bills; when you get sick, exorbitant medical costs harvest you; when you drive, you pay tolls while watching him buy yachts; and after you die, funeral services take the final cut.
You handle
post-image
We are going to accelerate to the upside so much faster than most people realise.
It could not be more clear.
I have been sharing the ETH/BTC chart for a very long time, highlighting that we have been mid cycle, of a much larger cycle.
ETH/BTC has been one of the clearest charts that has shown us this.
Yet, hardly anyone has listened.
That has been how strong the 4 year cycle spell was.
I do not know how anyone can look at this chart, alongside $ETH , and not see what has been building here.
We now have the bottom confirmed for $ETH, and all of a sudden, this no longer looks like the wild take
post-image
ETH-0.28%
BTC-0.91%
September 9 $SNDK Morning Analysis
The threefold bearish factors—macro (60% rate-hike probability), fundamentals (positive news exhausted + hidden risks emerging), and technicals (breakdown imminent)—are resonating. The most dangerous scenario is that once the previous low of 1,732 is decisively breached, it will trigger algorithmic stop-loss orders and create liquidity hunting, with the price potentially accelerating toward the 1,700 round-number level. Even if there is a short-term rebound toward VWAP (1,790), as long as it fails to break through on increased volume, it remains a window for
post-image
SNDK-0.11%
BTC-0.91%
ETH-0.28%
Why is everyone suddenly watching $ADA /USDT for a move below 0.2175?

$ADA /USDT - SHORT

Trade Plan:
Entry: 0.2187 – 0.2205
SL: 0.2281
TP1: 0.2132
TP2: 0.2090
TP3: 0.2026

Why this setup?
Why now? The daily trend is range-bound, which often compresses before a decisive break, and the 1h ATR of 0.003536 shows enough volatility to reach the targets quickly. The 15m RSI sitting at 42.03 confirms bearish momentum without being oversold, meaning the slide can continue. The entry zone of 0.2187 to 0.2205, anchored at the 1h price of 0.2196, offers a precise short setup. If price pushes to TP1 a
ADA-0.63%
This was purely the market being in a good mood and casually tossing out a few gold coins—one just happened to hit me on the head.

When the market plunged intraday, everyone was running. I judged at the time that this kind of sell-off showed insufficient buying support. Every rebound was weak and feeble. It looked like the market was about to stabilize, but in reality, it was heavily baiting longs.

Sure enough, when the market retested its lows in the early hours a few days ago, the short position I flagged at 0.46953 has now moved to 0.02899, with returns of +2300.72%. Time to enjoy a goo
post-image
BNB+1.58%
LAB-1.95%
September 9 Jinman Gold Morning Review:
Spot gold continued to trade weakly in the morning session, currently fluctuating within a narrow range around 4352. Overnight, gold prices fell all the way, directly breaking below the 4400 round-number level and reaching a low of 4352.48, refreshing the recent low, with the overall market fully dominated by bears.
The hourly chart shows consecutive bearish declines, with weak rebounds and a clear short-term downtrend; the 4-hour chart is likewise in a choppy downward channel. After the large bearish candle broke down, the overall bearish pattern remain
post-image
BTC-0.91%
ETH-0.28%
I originally wanted to sell at a loss to appease the heavens, but the ritual never happened—the meat roasted itself. When $SKR plunged intraday, I simply took a second look. It held firmly in its bottom range without breaking support, with buyers stepping in every time it dipped. I know this pattern well: a classic bear trap, so I opened a small long position.
It’s now at 0.021739, while my 0.016185 is still holding firmly, with +501.96% secured. No trades, no analysis—just sheer luck? Bullshit. I simply got the timing right. This move was purely the market being in a good mood and casually sc
post-image
SKR+2.68%
XRP+1.33%
LAB-1.95%
Everyone calling this a range is missing the 1h setup forming right now.

$BTC /USDT - SHORT

Trade Plan:
Entry: 78362.69 – 78549.83
SL: 79354.58
TP1: 77782.52
TP2: 77333.36
TP3: 76659.63

Why this setup?
Why now? The 1h price sits at 78455.45, just below the daily range that has been capping moves, while the 15m RSI reads 48.47 showing neither overbought nor oversold conditions. The 1h ATR of 374.298489 confirms enough volatility to push through the entry zone between 78362.69 and 78549.83. With a SHORT bias at 55.4 confidence, the invalidation level of 79321.09 acts as the line in the san
BTC-0.91%
France ranks 13th globally in taxable crypto activity, with a whopping $9.4B projected for 2025! 🇫🇷💰 How will this impact the $BTC , $ETH markets? Let's discuss! #CryptoTax
BTC-0.91%
ETH-0.28%
One of the absolute strongest algorithmic entry functions in the market
The Unicorn setup.
If you still don’t know about this, take note.
post-image
10x Leverage vs Spot - Best for Beginners
live-cover
LIVE61
By the time I got back from a bathroom break, the candlestick chart had already wiped out my losses for me. A few days ago, $HEMI was still moving sideways at the bottom in the early hours, but funds were quietly entering. I judged that this wasn’t a breakdown but bottoming out, so I went long directly at 0.005583 and took one position, then made no further moves. The market can move on its own—the more closely you watch, the more likely you are to get itchy fingers.
I just took a glance, and the price has already reached 0.007635, with returns at +724.22%. I’ve finally gotten that earlier fru
post-image
HEMI-15.11%
LAB-1.95%
ETH-0.27%
9.9 Gold Morning Review

The midnight short-at-high strategy was perfectly executed, with the breakdown and sell-off rhythm fully hitting the mark and the support and resistance levels precisely identified. The market moved into a one-sided decline as expected, with the current gold price around 4354.

Technical analysis: The 1-hour Bollinger Bands have opened sharply downward, with gold prices running along the lower band and the bearish trend remaining strong; the 30-minute Bollinger Bands are also expanding downward in sync, while the RSI has entered the oversold range. A short-term recov
post-image
GLDX-1.32%
PAXG-1.51%
Most traders are about to get blindsided by a quiet move in $DOGE /USDT.

$DOGE /USDT - SHORT

Trade Plan:
Entry: 0.09 – 0.09
SL: 0.09
TP1: 0.09
TP2: 0.09
TP3: 0.09

Why this setup?
Why now? The 1h price is pinned at 0.09, the 1h ATR is 0.000984, the 15m RSI sits at 53.3, and the daily trend is range. This means the 1h ATR tells us volatility is compact enough for a sharp squeeze, the 15m RSI shows neither overbought nor oversold conditions so momentum can flip either way, the range-bound daily trend proves the market is coiled and waiting, and the 1h price at 0.09 is the exact pivot where
DOGE-0.64%
The battle between longs and shorts is intensifying—is this pullback in gold an opportunity or a trap?
On the four-hour chart, the price has pulled back to near the lower Bollinger Band and is currently consolidating around 4352. The lower Bollinger Band is forming a support line, while the RSI has retreated to a low range. Short-term selling pressure continues to be released, bearish momentum is gradually weakening, and the market may have potential for a corrective rebound.
On the news front, the People’s Bank of China has increased its gold holdings for 22 consecutive months, continuing to
XAU-1.52%
I wasn’t watching the charts or using my brain; it was jumping around on its own, like it was working overtime for me. I didn’t dare look during the intraday plunge, but felt relieved after the drop. Then when I checked again a while later, $MAGMA ’s 0.23771 was actually higher than my entry price. I really don’t know who to complain to.

The logic was simple at the time: it was forming a bottom without breaking down. I mentioned around 0.17163 that we could accumulate in batches at low levels and wait for a recovery. The unrealized gain is now +761.86%. Not an outrageous return, but at least
post-image
MAGMA+0.64%
SOL-0.52%
XRP+1.33%
Big gains at noon, brothers!$SNDK ‌ ‌ ‌ ‌
post-image
SNDK-0.11%
Load More

Join 40 M users in our growing community

⚡️ Join 40 M users in the crypto craze discussion

💬 Engage with your favorite top creators

👍 See what interests you