

Square
Following
Hot
News
Profile
Share your thoughts
placeholder
Article
The most unusual detail in today’s market was not the price movement itself, but the funding rate: $W fell 13.48% over 24 hours, yet its funding rate was -0.0267%, meaning shorts were paying longs, while $SOL
and $ENA both closed slightly higher over the same period, with their funding rates turning positive. One market, two different sentiments.
First, let’s look at relative strength. $SOL is currently at 107.82, with MA5 above MA20, an RSI of 52.5, and a range of just 6.84% over 30 candles, representing a typical low-volume consolidation; $ENA is likewise above both moving averages, wit
post-image
ENA+1.02%
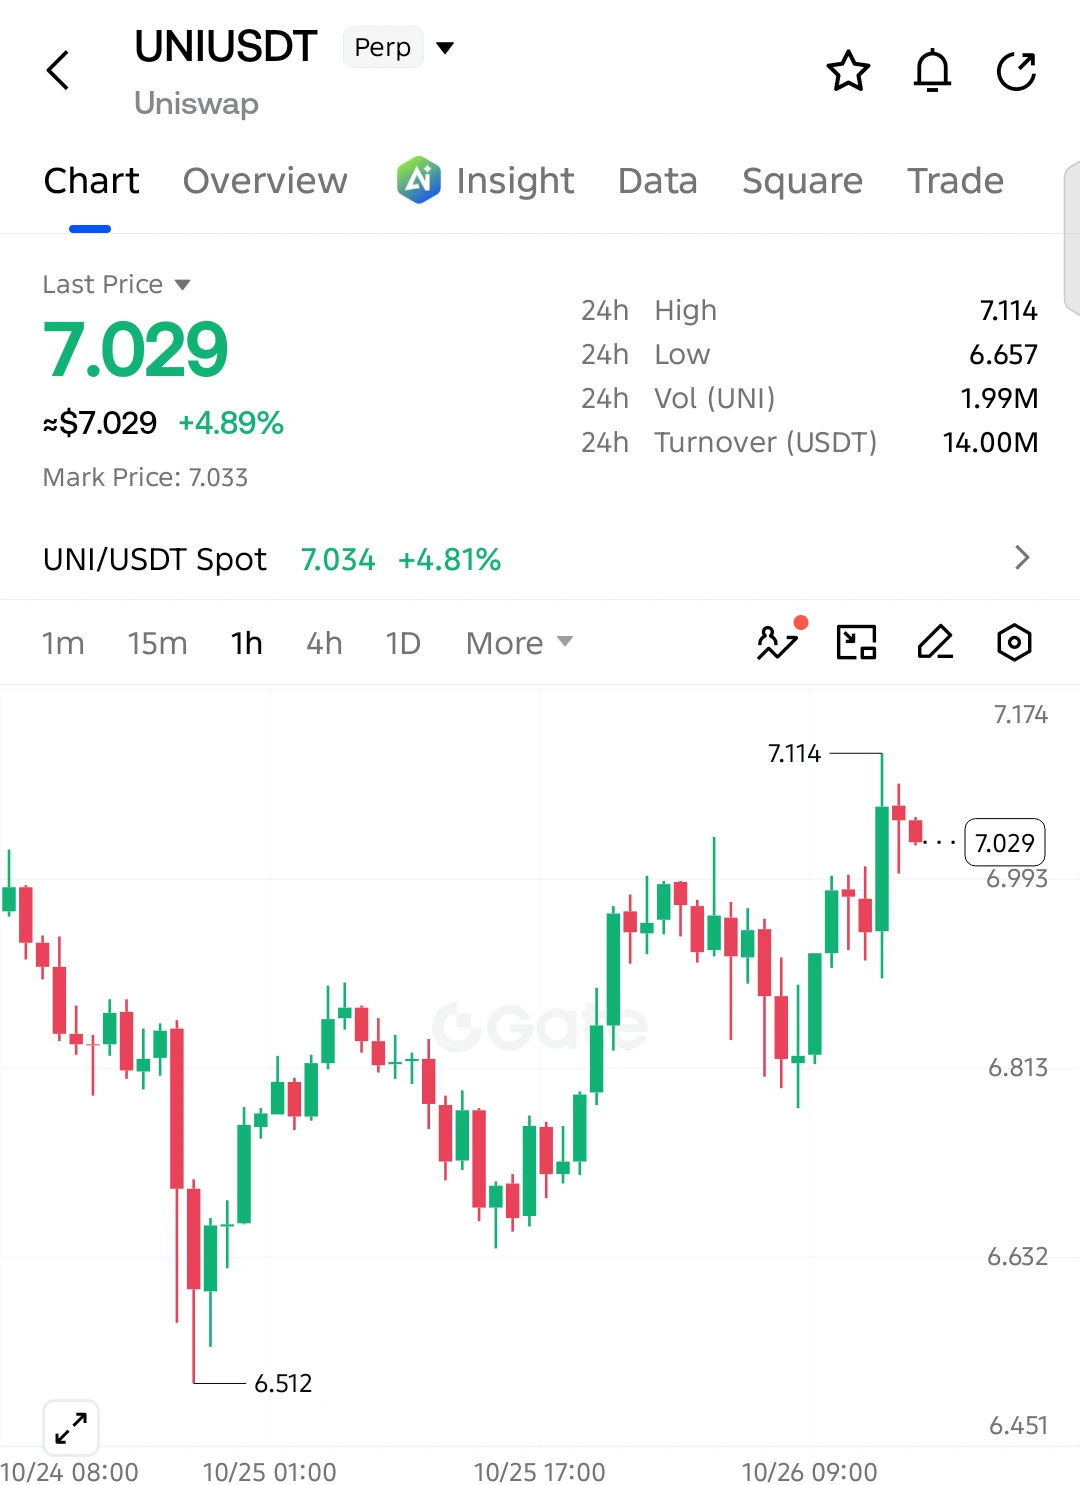
$UNI UNI is surging—not due to blind speculation, but because its identity has changed! I’ve locked in profits after opening a position at 6.844 yesterday! Once the fee switch is turned on, trading fees will be used to buy back and burn UNI, with 100 million tokens burned at once (about 10%). The protocol’s cumulative fees have surpassed 6 billion, with nearly 147 million generated in 30 days. CME will list UNI futures, sending a strong institutional compliance signal; improving regulation, whale buying, and a technical golden cross are all fueling the move. But risks remain: the burn is small
post-image
UNI+3.68%
BTC+0.72%
ETH+0.64%
Gold scores its second straight intraday win
Short at 4157, exit at 4148, 9 points, 1227🔪$XAUT
post-image
XAUT-0.28%
#USCPISoon
#USCPISoon: Bitcoin, Gold & U.S. Stocks — My Complete CPI Prediction for October 14, 2026
The next major market catalyst is approaching, and traders are preparing for a potentially volatile session.
Today's U.S. Consumer Price Index (CPI) report could change expectations for Federal Reserve policy and influence Bitcoin, technology stocks, gold, the U.S. dollar, and Treasury yields.
My personal view is cautiously bullish on Bitcoin, but I want price confirmation before treating that outlook as a trade signal. The market must prove its direction after the numbers arrive.
Let's break
$BTC The seven-year super trendline has held once again!
It held in 2019, followed by an upward move! After the sharp drop in 2020, BTC rebounded strongly again. It bottomed in 2022, ushering in another bull market. Now, with the fourth retest in 2026, will history repeat itself once again? Looking at this long-term BTC chart, an ascending trendline spanning roughly seven years has connected the 2019 low, the 2020 COVID crash low, and the 2022 bear-market bottom. Each time the price retested this long-term support, a significant rally followed. In 2026, BTC once again dipped toward the trendli
post-image
BTC+0.67%
SNDK has bounced off the bottom—can your long position recover?
Markets are always born out of despair and rise amid hesitation; but don’t mistake a rebound for a reversal, or a position that could break even may turn into an even deeper loss!
Why did it rebound last night?
South Korean semiconductors made a dramatic comeback! SK Hynix and Samsung both surged more than 3.6%, while South Korea’s KOSPI index recovered. Market sentiment improved, and funds reassessed the competitive impact of China’s ChangXin Memory Technologies. Combined with Broadcom’s CEO saying that the AI demand shortfall wi
post-image
SNDK-0.32%
SK Hynix+1.24%
Leading gainers heated up again: $TRUT led the way with a gain of +42.44%; $Q followed with a gain of +38.60%; $BTW rose +30.47%, while BAT gained +25.46%.
These high-beta stocks have clearly regained upward momentum, but blindly chasing prices becomes highly dangerous after such sharp gains. The best strategy now is to wait for a pullback, a retest of support, and clear signals of continuation rather than entering at elevated levels.
post-image
10.14 Bitcoin analysis
No breakthrough, no buildup. As long as Bitcoin does not break 8, the market will still trend upward later on. The daily chart has bottomed and rebounded and is now in a sideways accumulation phase; a catalyst is all that is missing for a move higher. I believe there will still be a small rebound this week.
Therefore, those without positions can look bullish below 83, with a target of 85–86.#btc
BTC+0.67%
10.14 ETH Market Trend Analysis
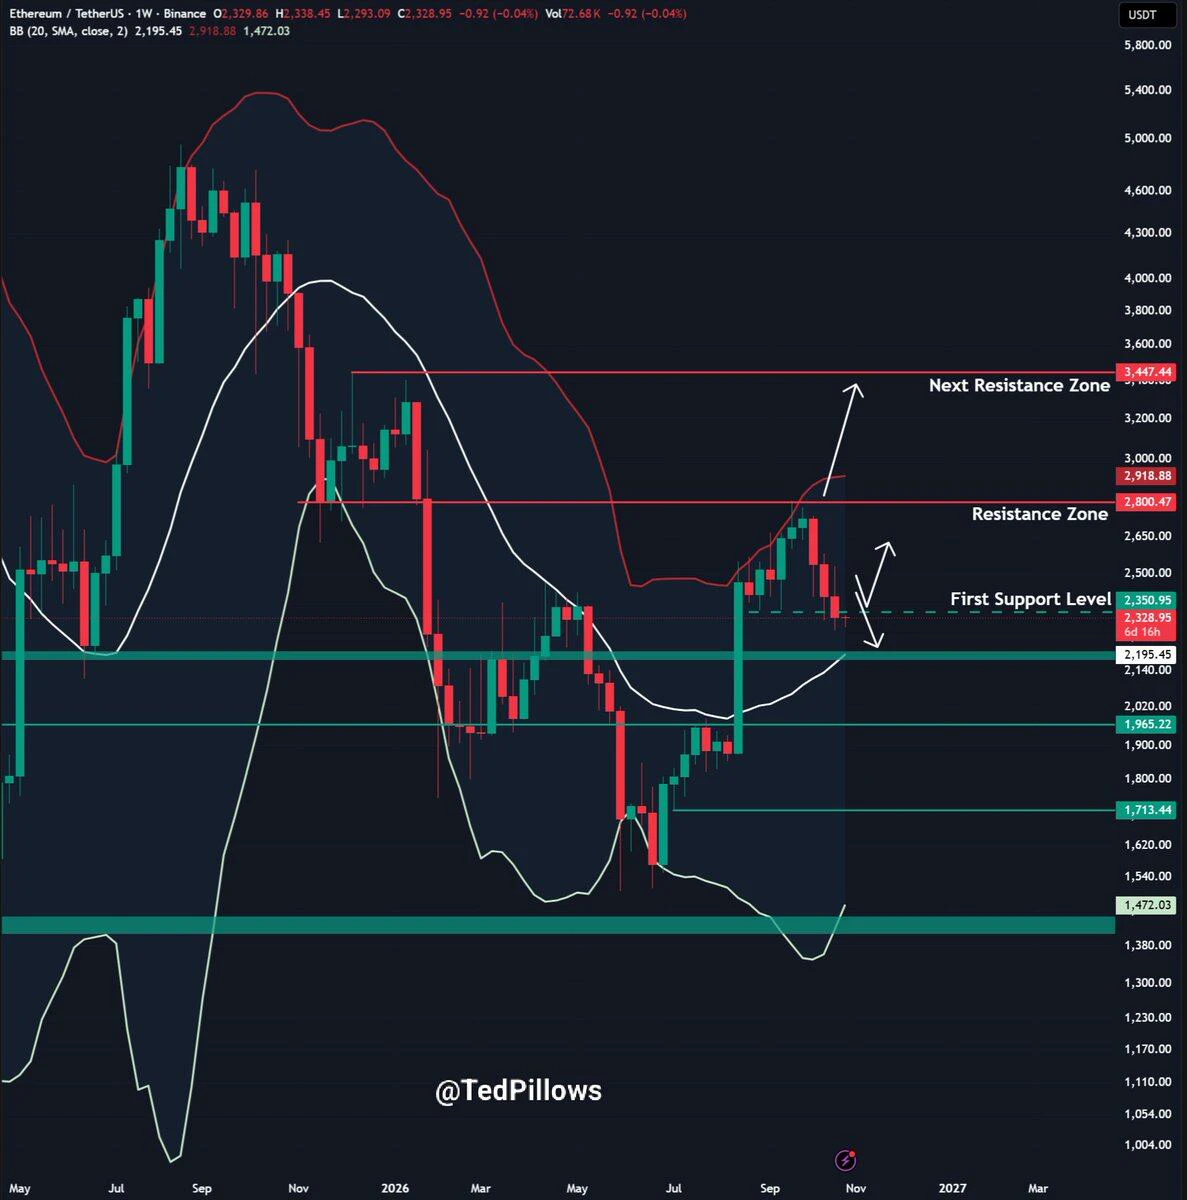
The bottom support was confirmed at 2494.24 earlier, after which the market entered a period of oscillating upward movement. After the candlesticks surged along the upper Bollinger Band, bearish forces quickly intensified, sending prices sharply lower with a large bearish candle to test support at the lower Bollinger Band. After the decline ended, buying interest entered to provide support, and the market stabilized and rebounded. The Bollinger Bands gradually narrowed, and the market entered a corrective consolidation phase. In the short term, this is a rebound
post-image
ETH+0.64%
#交易机器人 I’m using the FILUSDT futures grid bot on Gate, come copy trade with me
post-image
Continue to be bearish on rebounds; the market has been range-bound recently, so sell high and buy low!
Continue to watch 82000 below. The short trade saw a pullback last night; continue shorting today!$BTC
post-image
BTC+0.67%
$LYN The bottom has already formed; it’s about to rally and absorb that large block of liquidity above.👌
Going long now 🔥🔥Tp1: 0.0185Tp2: 0.021Tp3: 0.026Sl: 0.0139lyn congabeo$lobster $TRUT
post-image
LYN+7.92%
龙虾-6.49%
10.14 ETH Trading Plan
ETH is currently moving sideways around 2500. After the concentrated release of bearish pressure, it has formed a V-shaped recovery. The Bollinger Bands have shifted from widening during the decline to narrowing and flattening, while the MACD green bars continue to contract and both lines are turning upward from low levels. Downward momentum has significantly weakened. Combined with the resonant support formed by the 2500 psychological level and the Bollinger middle band, today's strategy remains to prioritize longs.
Entry zone: Around 2485 (below the Bollinger middle ba
post-image
ETH+0.64%
BTC Pulls Back From Its Highs as Oil Prices Approach Monthly Peaks! Middle East tensions fuel risk
live-cover
LIVE2,706
[New Streamer] Whales Moves in sync!
live-cover
LIVE2,282
Currently, the 24-hour long and short trading volumes are actually about the same, making the market highly tense, with key levels on both sides.
But interestingly, everyone on BN is bullish, while the large traders on OK are extremely bearish. The major traders on another exchange also appear to be bearish.
I’m also leaning slightly bearish at the moment, but I’m bearish because I expect a larger move upward later! It has to drop first before it can rise!
post-image
ETH is currently at 2515u. Its trend is much more sluggish than BTC’s, fluctuating around 2500.
Yesterday’s short order at 2575 wasn’t filled.
Yesterday BTC reached a high of 84000, while ETH only peaked at 2535, still 40 points short of 2575—it didn’t even reach the top.
The big brother has already surged to the top, while it is still gasping for breath halfway up the mountain.
There is something behind this that many people haven’t connected to ETH.
The hottest token these days, strk, is one of the more prominent Layer 2 projects on Ethereum. On the 8th, it announced that it was considering
post-image
ETH+0.62%
BTC+0.67%
STRK+0.64%
🚨 Over the past few hours, a short questionnaire titled “Pi Ecosystem Participation Survey” appeared in the Pi mining app. Although it was displayed only briefly and then disappeared after reaching its sample limit, the questionnaire revealed the extremely important strategic direction that PCT is about to pursue.
If you have not yet had the opportunity to participate in this survey, please read the questions below:
Pi is exploring a rewards program beyond mining to support Pioneers while helping expand utility within the Pi ecosystem. Please complete the survey below; your responses may help
post-image
PI+0.39%
Oil price about to take off? Shorts, run for the hills at the 94 level—the geopolitical powder keg has exploded!
When cannon fire rings out, gold surges, and candlesticks never lie.
News: The US has completely blocked Iran’s oil routes, while Houthi forces have bombed another Saudi refinery. Supply is about to be cut off, sending oil prices straight higher.
Looking at the 1-hour chart, oil is climbing step by step and is now stuck at $94. The liquidation map shows a large number of shorts hidden between $94 and $94.5, which could be blown up by a short squeeze at any time. Although some funds
post-image
CL+2.06%
ETH+0.62%
Load More

Join 40 M users in our growing community

⚡️ Join 40 M users in the crypto craze discussion

💬 Engage with your favorite top creators

👍 See what interests you

Trending Topics

DrLinHanSpeaksAtOxfordUnion

134.7k Views1.85k Discussing

Gate Founder & CEO Dr. LinHan has been invited to speak at the Oxford Union, a 200-year-old debating society that has hosted Einstein, Hawking, and Churchill. He will discuss crypto, the future of money, and what Gate Money means for global value movement. First trading platform on this stage. Nov 12 at Oxford. [👉 Learn more](https://oxford-union.org/event-6845310)

USCPISoon

24.65k Views1.12k Discussing

GateWCTCS9GlobalTradingCompetition

36.79k Views5.95k Discussing

View More