
Square
Following
Hot
News
Notifications
Profile
Share your thoughts
placeholder
Article
I’ve come into this world twice, and both times I chose to defend my homeland.
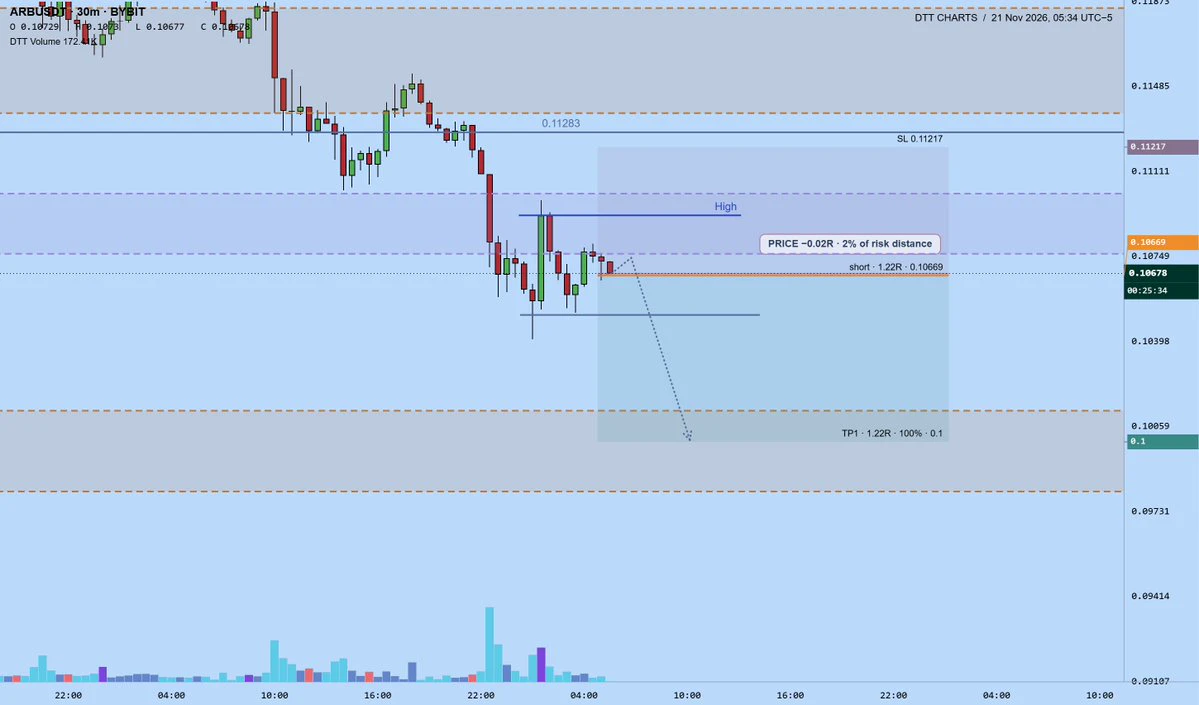
$arb scalp short
sl: $0.11217
Tp: $0.1
1.22R
— DTT
post-image
ARB+1.20%
Trenches
FIONA
F
bade
b
FIONA
B34n...pump
Market Cap
$.
Change
.
24h Vol
$.
Holders
.
PIEVERSE
P
bade
b
PIEVERSE
0x0e...25a9
Market Cap
$.
Change
.
24h Vol
$.
Holders
.
mihao
m
bade
b
mihao
4Cxj...pump
Market Cap
$.
Change
.
24h Vol
$.
Holders
.
IDOL
I
bade
b
IDOL
0x3b...ab07
Market Cap
$.
Change
.
24h Vol
$.
Holders
.
CLAUDIA
C
bade
b
CLAUDIA
2j5S...W2ZM
Market Cap
$.
Change
.
24h Vol
$.
Holders
.
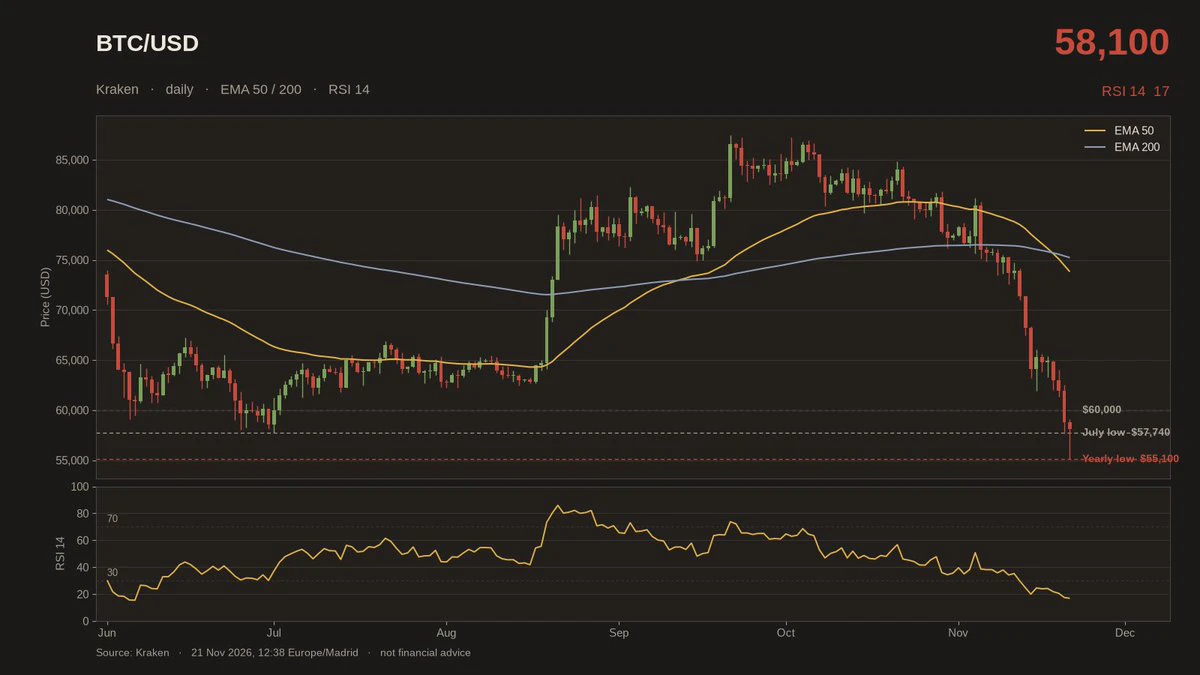
Bitcoin wicked to $55,100 this morning and bounced back to $58,000.
Daily RSI is sitting at 17, and both the 50 and 200 day EMAs are still way overhead. Does $55,100 hold, or do we go test it again?
post-image
BTC-0.67%
[New Streamer] Market Prediction
live-cover
LIVE1,756
BTC-0.67%
$AIOT The short idea is on the table.
Entry range: 0.06862 – 0.07013 Take-profit targets: 0.0654 – 0.0622 Stop-loss: 0.0729
AIOT is now clinging desperately to its daily low, like trapped holders refusing to admit defeat. A breakdown and sharp drop are likely just around the corner. But keep in mind—the 1-hour RSI is already oversold, so a sharp mean-reversion bounce could happen at any time.
Don't get carried away and go all in; size your position according to what your account can afford. (The above is only my personal opinion and does not constitute investment advice. Please assess market
post-image
AIOT-2.28%
hey @grok what do you think about this graph?
bitcoin:native
BTC-0.67%
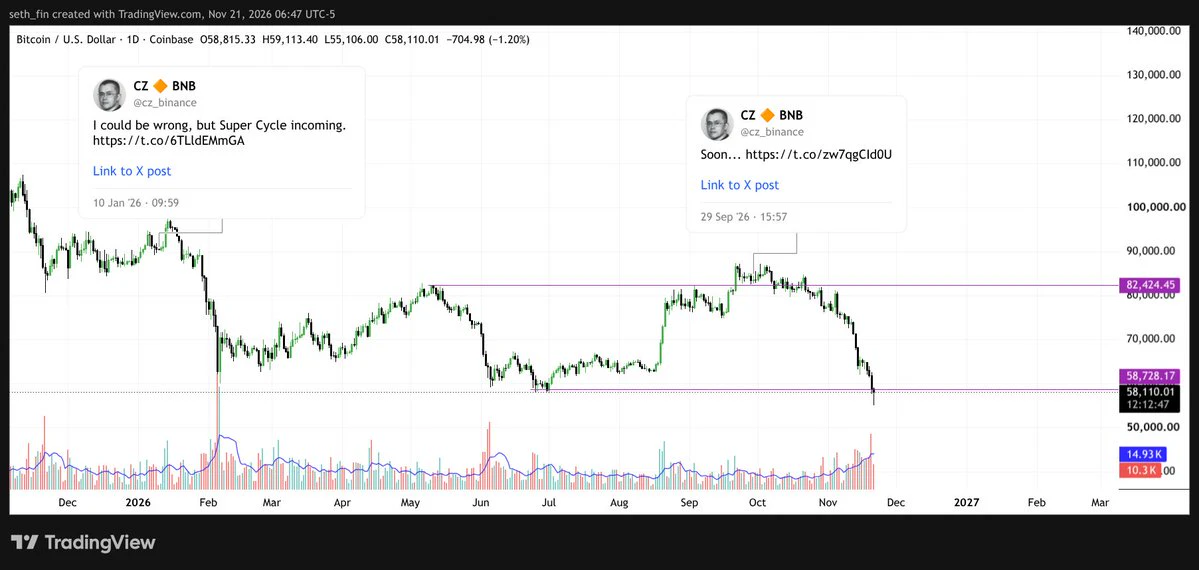
I can't believe MM managed to do this.
Pump $BTC above May high to $87K and make a higher high before dumping it back down to make a lower low to $55K.
CZ posts to his 12 million followers are spectacular.
"Super Cycle" "Soon..."
post-image
BTC-0.67%
Should I ask him to say, Kim Jong Un is a fat pig?
post-image
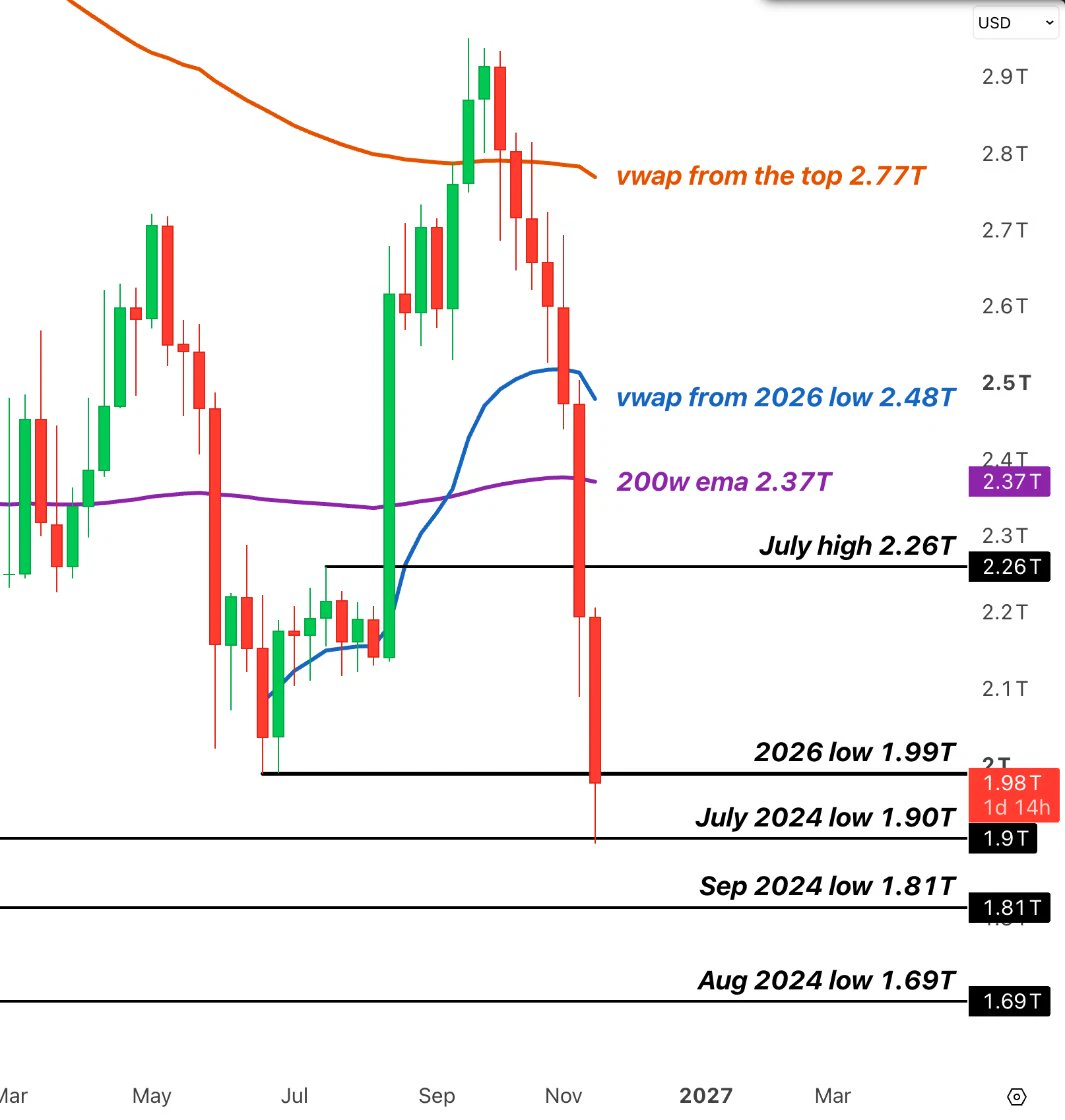
crypto lost about 900b since late september. total market cap is testing the 2026 low into the sunday close
post-image
Is the market losing confidence in ETH?

Ethereum is facing another difficult period.

Spot ETH ETFs recorded nearly $2B in net outflows over the past 30 trading days.

That's worth watching.

Price drops happen, but sustained capital outflows tell us investors are still cautious.

For now, I'd rather watch the money flow before making big assumptions.

Are you still confident in Ethereum's long-term growth?

$ETH $ETH
post-image
ETH-1.26%
ETH-9.05%
Arbitrum One’s Stablecoin Market Cap Increased by $327.4 Million Over the Past 7 Days
live-cover
LIVE3,336
ETH-1.26%
BTC-0.67%
SOL-0.77%
ZEC+1.16%
HYPE+0.24%
Weekend treasury needs don't wait for Monday.
In a 7-day live pilot, Lloyds settled $750K in USDC obligations with Visa. Funds arrived in under an hour, including over the weekend.
Useful progress for cross-border settlement—not a market-wide service.
#Stablecoins #Payments
post-image
USDC+0.01%
V-0.07%
Thanksgiving is in 5 days btw
post-image
  • 1
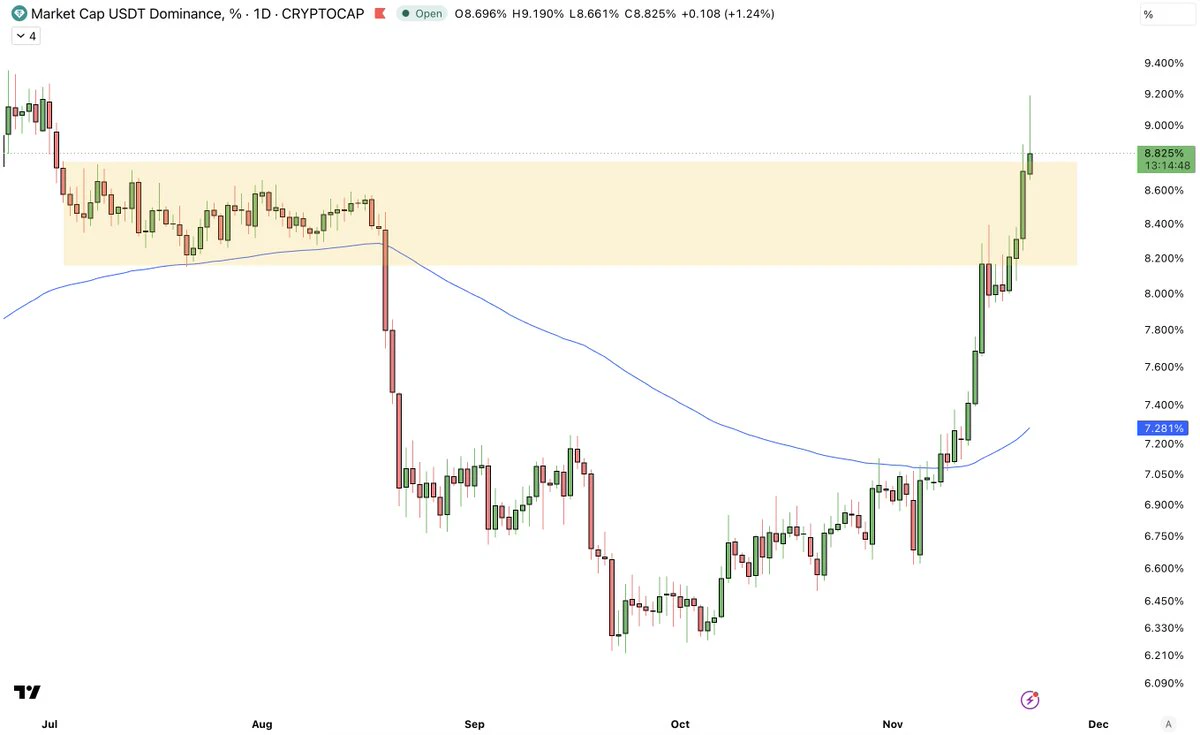
USDT.D made a liquidity sweep of the previous summer highs.
normally, we see similar chart patterns on manipulated tickers like $RAVE , $LAB and others. now the same thing has printed on USDT.D
a very very very rare move
the market has been so unpredictable lately, smashing through every zone, that can't tell whether it will reverse here or not
still a gamble, but there's a small chance USDT.D drops a bit from here, at least giving all of us some room to breathe
bitcoin:native ethereum:native solana:So11111111111111111111111111111111111111112
post-image
RAVE+0.76%
LAB-4.47%
BTC-0.67%
ETH-1.26%
SOL-0.77%
#BTCBreaksBelow60K #ShareWeekly

Bitcoin at $58,252: Selling Pressure Intensifies as ETF Outflows Continue and Rate Expectations Shift

Bitcoin is facing another important test as its price remains below the psychologically significant $60,000 level. At the latest market snapshot, BTC is trading around $58,252.10, with a 24-hour high of $62,183.40 and a low of $55,123.00. This wide trading range reflects considerable volatility and suggests that market participants are still struggling to establish a clear direction.

In my view, the current situation is more complicated than an ordinary pric
This Week’s Live Trading Summary
33 trades this week: 29 wins and 4 losses, capturing 252 points of profit!

This week, I mainly followed the trend and took short positions. I accurately gauged intraday highs and lows, and successfully banked profits on every swing trade. I strictly followed risk controls and take-profit rules, with no aggressive, impulsive entries. Trading remained steady, and overall returns grew consistently this week. $XAU #黄金 #BTCETFOutflowsExtendTo3Days
XAU+0.38%
#英伟达单日重挫近14% If I could choose just one metric to judge whether AI stocks are worth repositioning in, I’d look at AI investment returns and free cash flow. It best answers the question: “Has the money burned turned into real cash?”

Why this metric
· Revenue growth can be misleading: Nvidia’s third-quarter revenue grew 103% year over year, yet its stock still fell for consecutive days. No matter how many orders there are, they have to translate into profits and cash.
· Free cash flow is the most honest measure: it’s the money earned from operations, minus spending on data centers and equipment
post-image
NVDA-13.84%
  • 7
  • 1
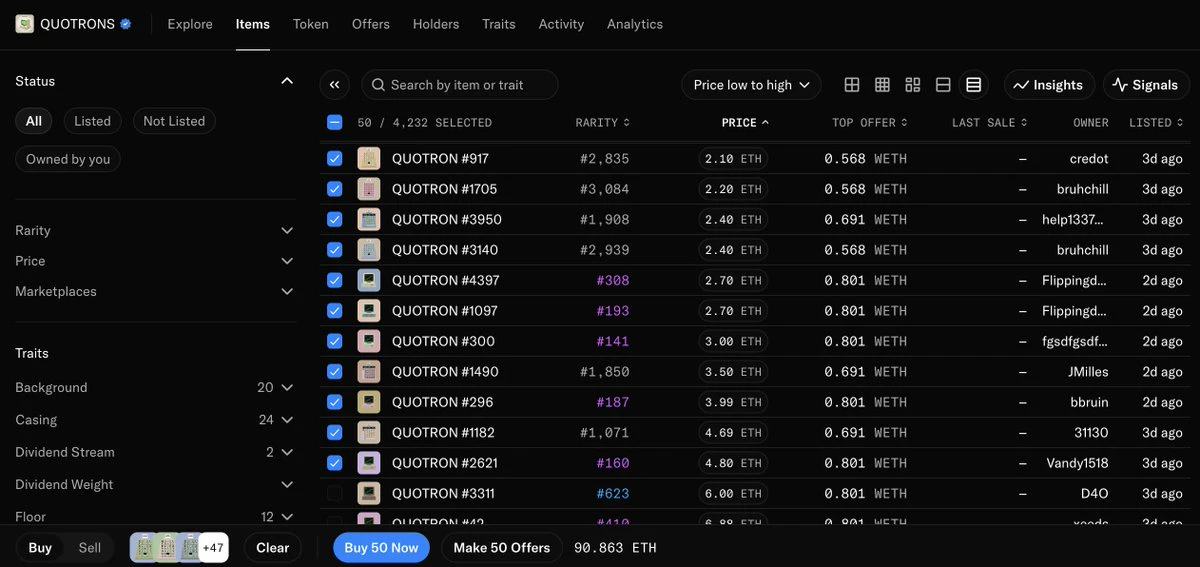
The Quotrons depth is ridiculous btw
It only takes 50 Quotrons to flip 4.8e
Yet no one wants it
Token sits at $2k while the nft is at 1.3k$ with highest offer below 600$
post-image
What do you call precision? Do you understand the value? After BTC broke above 58000 overnight and confirmed the move, another short on the rebound to 59300 targeted below 55500! It precisely surged to 59370 in the morning, then selling pressure poured in, taking it to a low of 55100—the anticipated 4200-point move was banked!
ETH was also targeted in sync: short at 1640 resistance, target 1510. The pullback reached 1536, banking more than 90 points. Every step stayed ahead of the market!#BTC跌破6万美元关口 $BTC ‌$ETH ‌
BTC-0.65%
ETH-1.23%
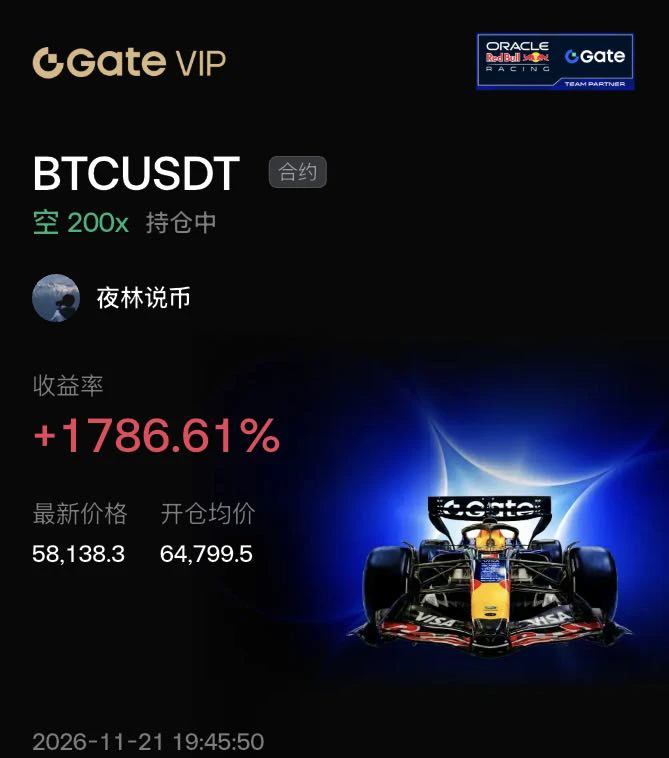
$BTC Does a rising wedge forming at a high price and breaking downward confirm a definitive trend reversal?
In-depth analysis: BTC formed a standard rising wedge near 64799.5. The highs moved higher, but the lows rose faster, indicating that bullish momentum was steadily fading. The subsequent violent downside breakout marked a complete trend reversal. I decisively opened a short at the moment of the breakout, using 200x leverage to precisely capture the plunge that followed the wedge breakdown!$ETH $ZEC
post-image
BTC-0.65%
ETH-1.23%
ZEC+1.29%
  • 1
Load More

Join 40 M users in our growing community

⚡️ Join 40 M users in the crypto craze discussion

💬 Engage with your favorite top creators

👍 See what interests you

Trending Topics

BTCBreaksBelow60K

2.1M Views29.5K Discussing

BTC fell below $60,000 on November 20 for the first time since July, alongside a tech stock selloff and broader pressure on risk assets. Will $60K become resistance, or can BTC quickly reclaim it? What price or volume signals would convince you that selling pressure is easing?

GateDirectIPOPhase3ANTAllocates92100Shares

758.6K Views4.8K Discussing

NvidiaDropsNearly14Percent

318.4K Views7.5K Discussing

View More