




Square
Following
Hot
News
Notifications
Profile
Share your thoughts
placeholder
Article
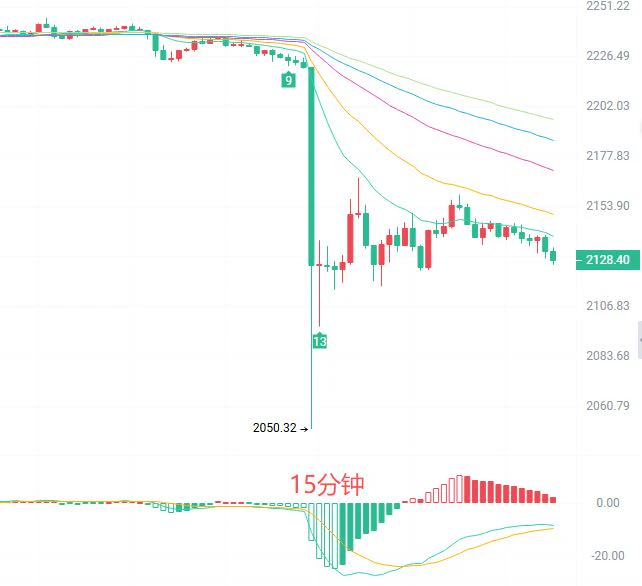
Guys! ETH has crashed again!
It plunged straight from 2235 to 2100, and is catching its breath at 2127 now. Yesterday we were still saying 2166 would hold, but today one big bearish candle broke through. How many people bought the dip at 2170 and got buried?

In plain English:
On the 2-hour chart, all five moving averages are overhead; the bearish alignment is intact
MACD green bars have expanded to -20.52. Bears are still accelerating; this isn't a decline that's running out of steam
BOLL is opening downward, with the lower band at 2119 and price hugging the edge of the band
The 15-minute cha
post-image
ETH-1.23%
This morning, I wrote about Musk in China: officials yelled at him, criticism was flying everywhere, and he still refused to back down. Thinking about it more deeply today: for someone to dare to bang the table like that, it takes fierce confidence in their own cars.

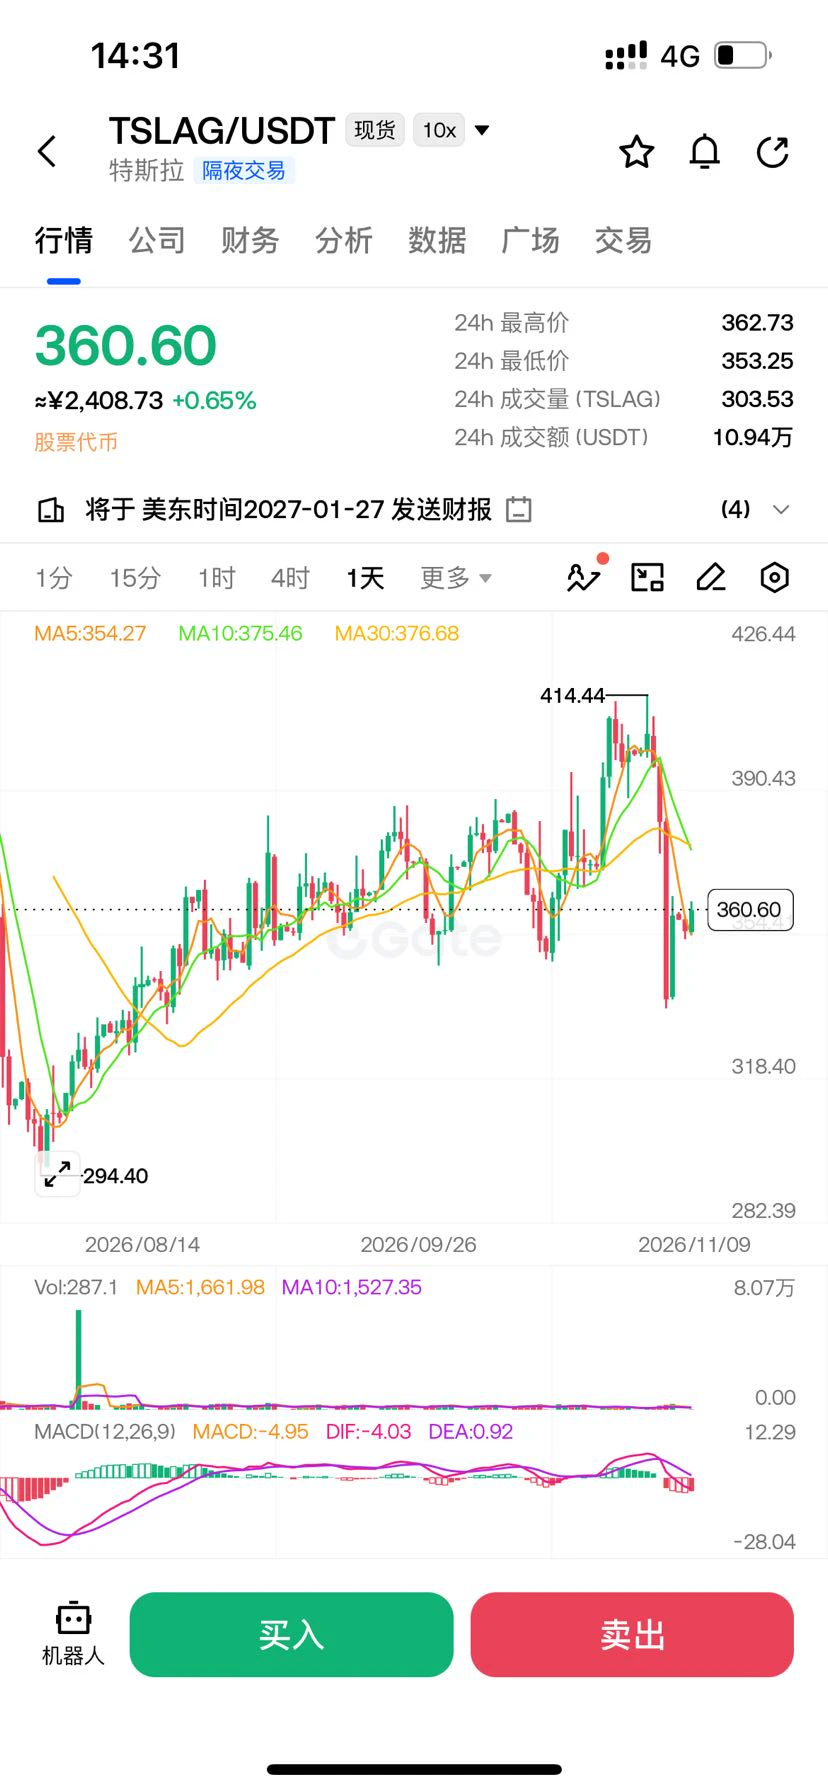
As for $TSLAG ‌, it’s weakened by nearly 11% this week, and trading volume is down to just one-tenth of normal. It looks unloved, but really everyone is waiting for major news to land. Whoever jumps in first is the fool.

The broader market backdrop is the same: semiconductors are shaky, and real buying will have to wait for an
post-image
TSLAG+1.28%
Trenches
ZIG
Z
bade
b
ZIG
0x8c...1145
Market Cap
$.
Change
.
24h Vol
$.
Holders
.
牛逼
牛
bade
b
牛逼
0x96...7777
Market Cap
$.
Change
.
24h Vol
$.
Holders
.
BTC
B
bade
b
BTC
C5xp...pump
Market Cap
$.
Change
.
24h Vol
$.
Holders
.
STONK
S
bade
b
STONK
6GmA...UNgx
Market Cap
$.
Change
.
24h Vol
$.
Holders
.
ANSEM
A
bade
b
ANSEM
9cRC...pump
Market Cap
$.
Change
.
24h Vol
$.
Holders
.
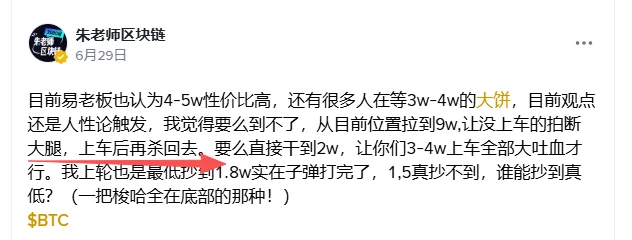
This market isn’t really going to do what I predicted in June and crash back down, is it? I’m scared as hell. $BTC
post-image
BTC-0.67%
Sudden flash crash before BTC’s weekly close! A wick down to $73,510, with $715 million in long posi
live-cover
LIVE1,867
Gave a short trade idea on ETH this morning, entering at 2148
Price reached the target as expected this afternoon, and I exited smoothly with profits
40 points safely pocketed, banking 2154.78U
Trading isn't about making frequent moves; catching one solid trend is enough#美国10月CPI即将公布 $ETH ‌ ‌
ETH-1.26%
$AIA ‌

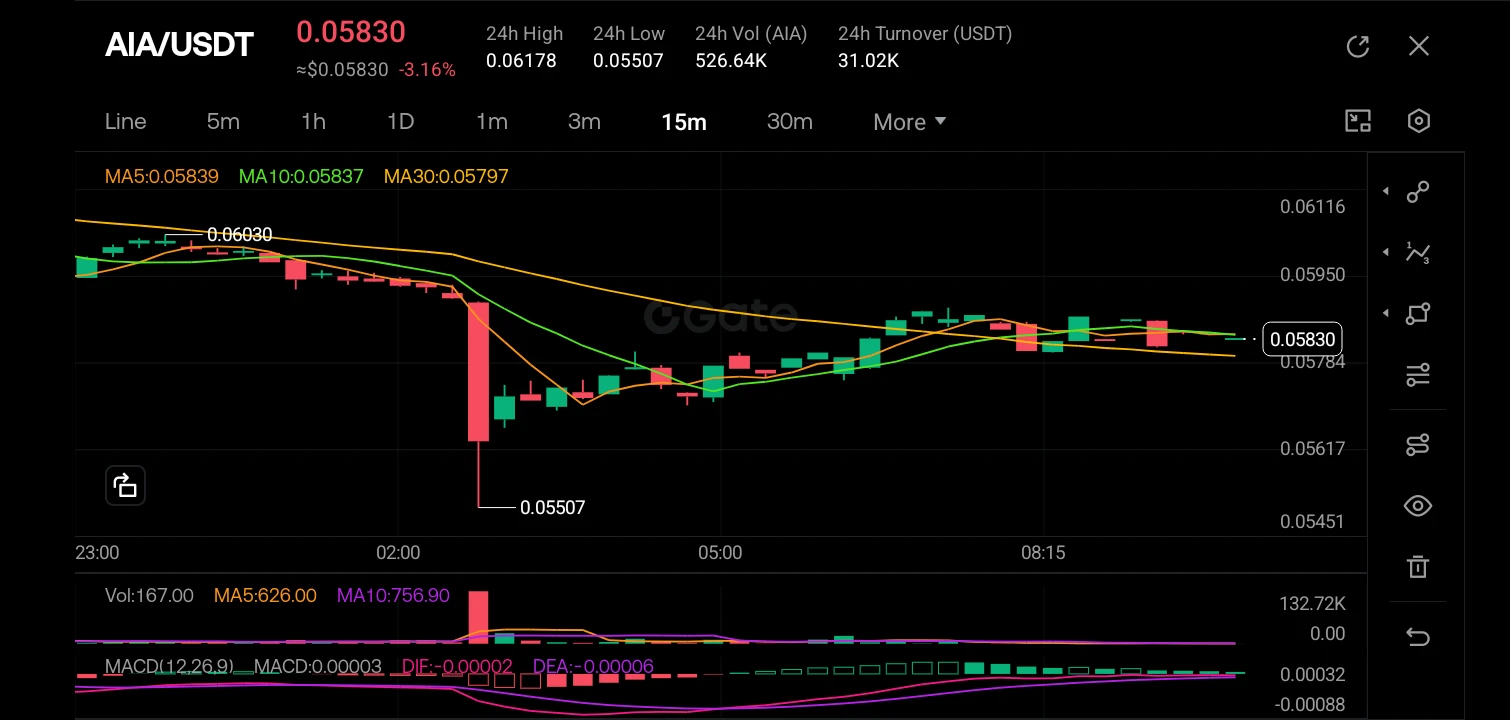
Looking at the 15-minute timeframe for AIA/USDT, we can see a period of high volatility followed by consolidation. The price suffered a sharp drop from the local high of 0.06030 down to a low of 0.05507. Since that drop, the market has entered a sideways accumulation phase, with price action compressing and the moving averages (MA5, MA10, MA30) beginning to converge and flatten out around the 0.05830 level, indicating a loss of immediate bearish momentum and a potential buildup for the next move.

Candlestick pattern: The dominant candlestick feature is the massive red marubozu (or lo
post-image
AIA-4.03%
  • 2
Sudden flash crash before BTC’s weekly close! A wick down to $73,510, with $715 million in long posi
live-cover
LIVE2,582
Bitcoin long positions have already been opened
post-image
BTC-0.65%
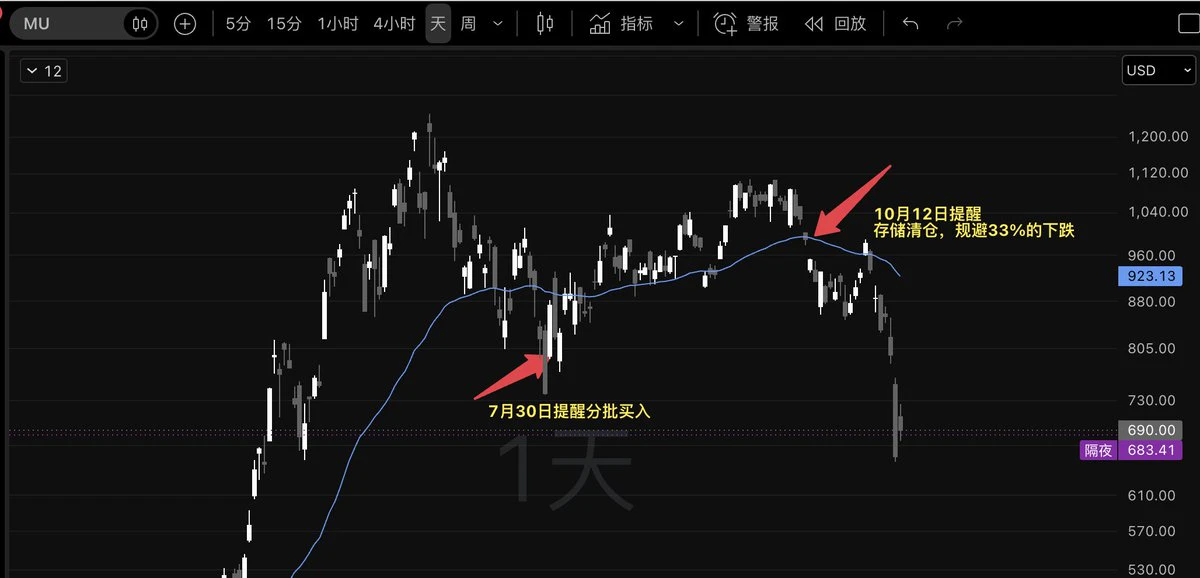
The storage sector is absolutely brutal...
You can still participate in the hype,
but only during the first cool-off after it boils over
After the second rally, the odds of success drop sharply if you join during the subsequent cool-off #交易思考
post-image
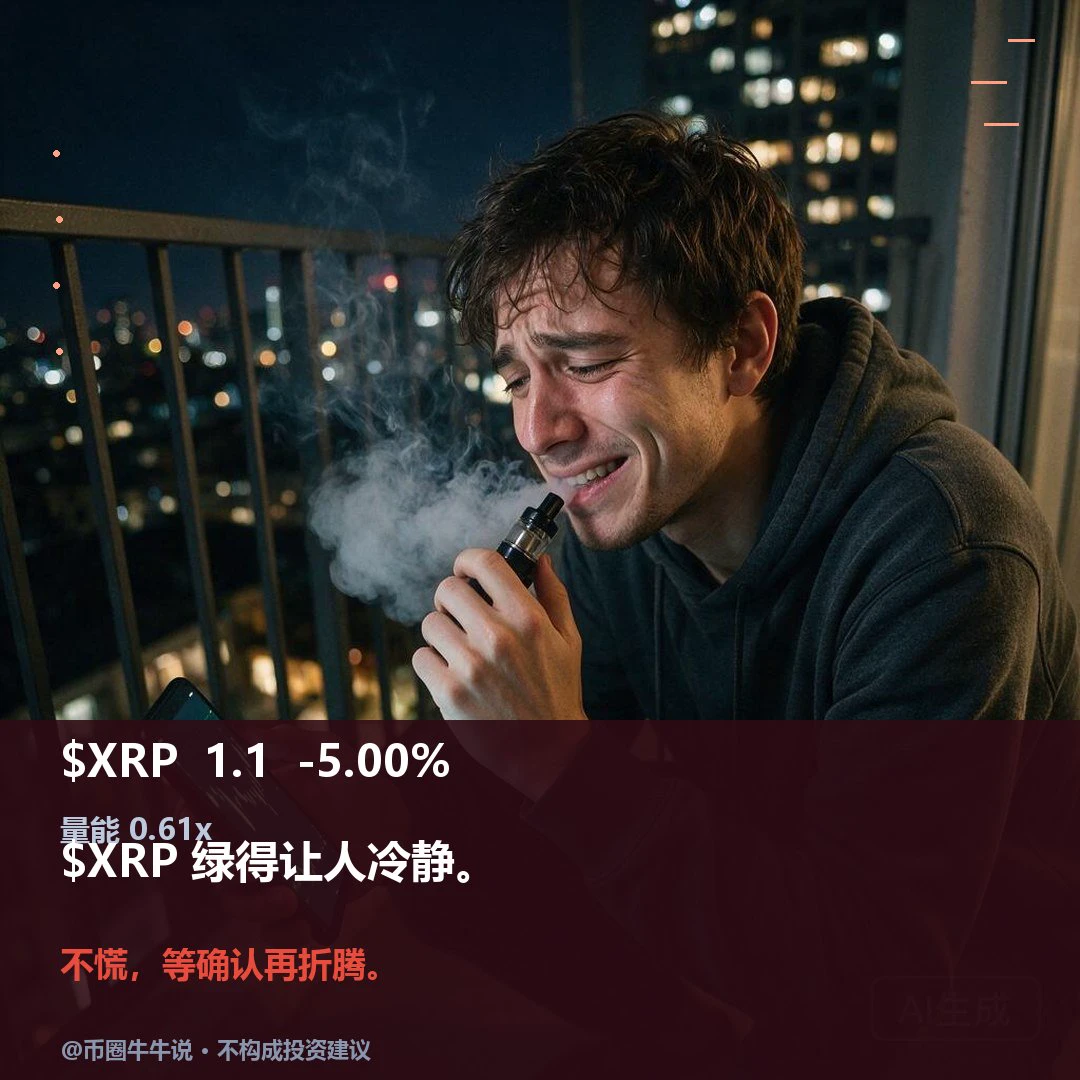
$XRP Currently trading at 1.1046, down 5.0% over 24H. The 1H trend is weak, with RSI at 17.4, EMA20 at 1.1304, resistance at 1.1699, and support at 1.093; the 4H trend is weak, with RSI at 19.8, EMA20 at 1.1661, resistance at 1.3271, and support at 1.093. Volume is only 0.61x the average. To the upside, price needs to hold above the 1.1699 resistance; a break below the 1.093 support would weaken the structure. In follow-up reviews, check whether 1.1699 can hold and whether price can reclaim 1.093 after losing it; a break below 1.093 with no recovery invalidates the setup. Markets are volatile;
post-image
XRP-1.15%
What Is Out-of-Sample Testing? Why Can’t You Use the Same Historical Data Over and Over to Prove Your Strategy Works?

In cryptocurrency trading, some strategies perform exceptionally well in backtests but frequently fail in live markets. One reason is that traders repeatedly use the same historical data to adjust parameters, ultimately coming up with a set of trading rules that fit the past very well but may not work as well in the future.

To reduce this risk, it’s important to understand a key concept: Out-of-Sample Testing.

First, what is in-sample testing?

In-sample data refers to the h
post-image
BTC-0.67%
A 73% bloodbath still isn’t enough! $SOXL This “fake short squeeze” is setting up the slaughter—retail traders, don’t catch a bloodied falling knife

A rebound during a plunge is just the big players handing you a rag to wipe their knives.

My take: Don’t be fooled—this is a classic fake short squeeze and real long liquidation. Look at the chart: 7D fund flows show net outflows of over 80 million; whales hold 141 million in short positions, with over 20 million in unrealized profits, while longs hold just 27 million. Retail traders are frantically buying the dip as the price falls 73%, while
SOXL-1.16%
AI stocks are falling, but BTC may not keep falling! Can digital gold reclaim its position?

Every time the market panics, investors ask themselves one question: Is Bitcoin really digital gold?
In theory, BTC has scarcity and decentralization. Long-term supporters believe it can become an alternative store of value. But the market can be a little mischievous: when U.S. stocks plunge and investors seek safety, BTC sometimes fails to show the defensive qualities of gold.
That’s because an asset’s long-term characteristics and short-term trading behavior are two different things. With institution
BTC-0.67%
NAS100-0.13%
XAUUSD+0.90%
  • 18
💰 Gate Ranks Global Top 3 in 24H Net Inflows

Despite market volatility, Gate recorded approximately $40.66M in 24-hour net inflows, ranking No. 3 among global CEXs, according to DefiLlama. 🏆

Capital is moving, but what does it signal?

Some see renewed trading demand and confidence. Others point to rebalancing, margin deposits, or traders waiting for their next entry.

Inflows are one signal. Sustained buying demand is another.

💬 What would you watch next — spot volume, sustained inflows, or BTC price action?

Share your market views and trading strategy on Gate Square with #GateRanksThi
Gate_Square
💰 Gate Ranks Global Top 3 in 24H Net Inflows

Despite market volatility, Gate recorded approximately $40.66M in 24-hour net inflows, ranking No. 3 among global CEXs, according to DefiLlama. 🏆

Capital is moving, but what does it signal?

Some see renewed trading demand and confidence. Others point to rebalancing, margin deposits, or traders waiting for their next entry.

Inflows are one signal. Sustained buying demand is another.

💬 What would you watch next — spot volume, sustained inflows, or BTC price action?

Share your market views and trading strategy on Gate Square with #GateRanksThirdIn24HNetInflows .

📖 Source:
https://www.odaily.news/zh-CN/newsflash/532275

repost-content-media
BTC-0.67%
Jensen Huang scandal escalates: Nvidia plunges in after-hours trading, dragging Bitcoin down too
The controversy over Jensen Huang’s alleged extramarital affair continues to escalate. Nvidia’s board has launched an independent investigation, and the U.S. Congress has also asked him to attend a closed-door briefing on November 18.
Against this backdrop, Nvidia’s $NVDA after-hours losses widened, with shares at one point falling to around $178; Bitcoin was also pulled down by sentiment and is currently fluctuating around $74,000.
A wobble in the AI leader tightens risk appetite, dragging the cry
NVDA+2.80%
BTC-0.67%
If you were Jensen Huang, what would you choose??
At noon, called long at 4117; gold surged to 4132, delivering $15 in profit per lot!$XAU #BTC闪崩插针 #黄金 ‌
XAU+0.38%
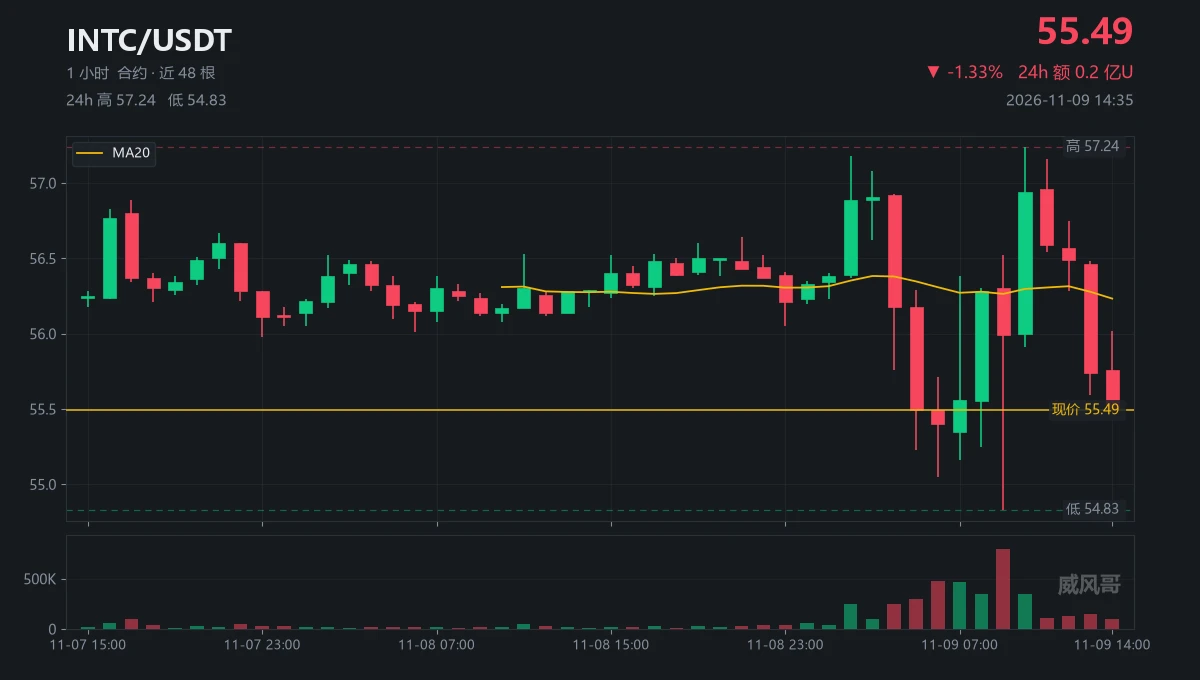
Can I ask something? Why did the 09:00 candle plunge to 54.83 and then close at 55.99?
It traded 791,000 contracts, the most all day, and buyers stepped in immediately after the plunge.
Then the 10:00 candle shot straight up to 57.24—does that count as a reversal?
Volume was only 346,000 contracts, 44% of the 09:00 candle's, and it gave all that back over the next seven hours.
So what exactly is 55.49 stuck at now?
At the midpoint of the 09:00 candle's lower wick, with neither bulls nor bears winning.
The highs of 57.18 and 57.24 are only six cents apart, but price just can't get through.
The
post-image
INTC+0.05%
$SIGN It plunged 13% in a day, and I’m still holding my long position in my live account, so I’ll own the unrealized loss. The current price is 0.0080, with a 24h high of 0.0092 and a low of 0.0079, and trading volume of 9.5M—the drop came on heavy volume, not a low-volume slide. That shows some holders are genuinely selling, but 9.5M is not exceptionally high for SIGN; this looks more like a chain reaction after panic selling was triggered.
I won’t make empty claims about the fundamentals: for an infrastructure token like SIGN, the thesis rests on adoption and real on-chain demand, not candle
SIGN-2.90%
Load More

Join 40 M users in our growing community

⚡️ Join 40 M users in the crypto craze discussion

💬 Engage with your favorite top creators

👍 See what interests you

Trending Topics

USCPIDataIncoming

26.7k Views1.77k Discussing

The U.S. October CPI report will be released on November 10 at 8:30 a.m. ET. September CPI came in at 3.7% year over year, and markets will be watching closely for signs that inflation is cooling, especially in core CPI. A softer-than-expected reading could strengthen rate-cut expectations, while hotter inflation may pressure risk assets through higher Treasury yields and a stronger dollar. How do you think this CPI print will move $BTC, U.S. stocks and gold?

RedBullDoublePodiumInBrazil

1.25k Views30.52k Discussing

BTCFlashCrash

59.21k Views66.18k Discussing

View More