




Square
Following
Hot
News
Notifications
Profile
Share your thoughts
placeholder
Article
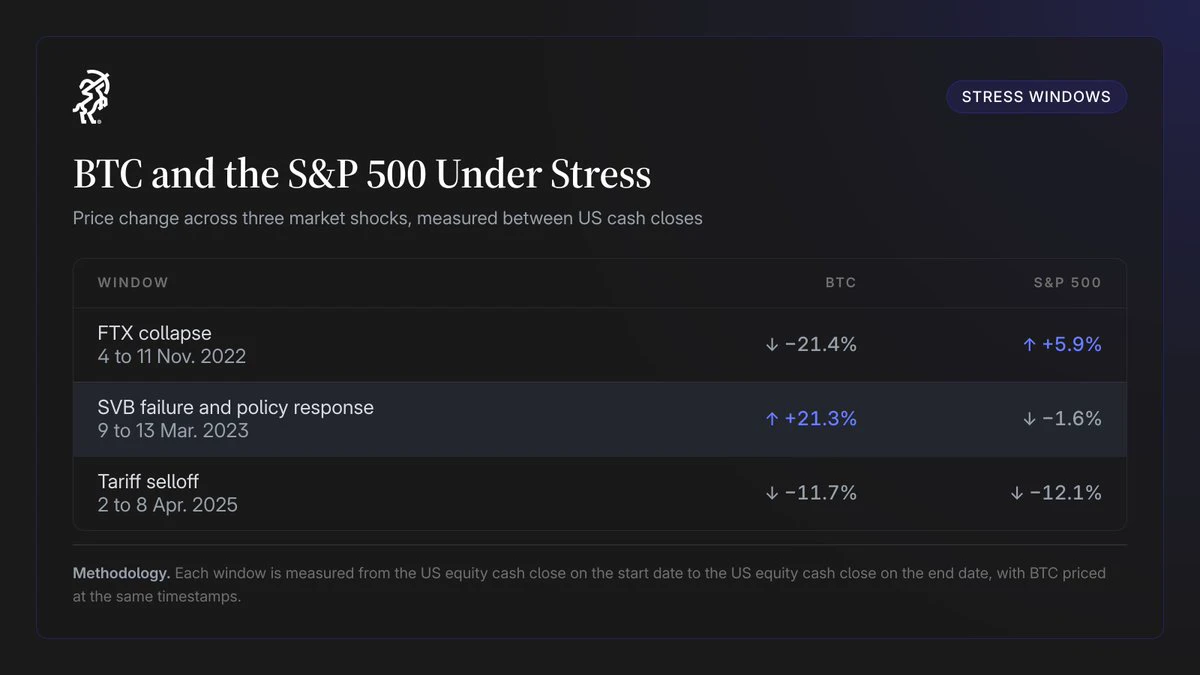
1️⃣ During the FTX collapse, BTC fell 21.4% while the S&P 500 rose 5.9%.
2️⃣ Around the SVB failure, BTC gained 21.3% as stocks slipped 1.6%.
3️⃣ In the 2025 tariff selloff, both fell about 12%.
The type of shock shapes whether crypto moves with stocks.
post-image
BTC-0.67%
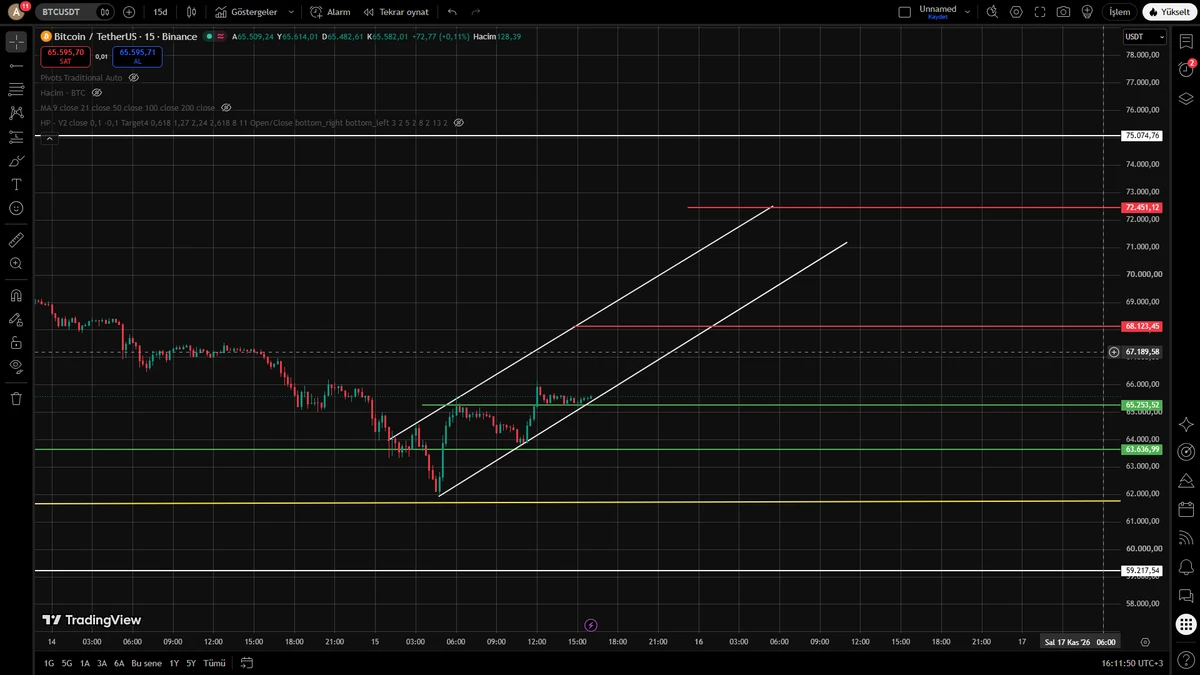
November 15, 2026: Posting this as proof. I’ve entered a precise long-term position at 62000, with a stop loss at 58000. The first target is above 80000, the second target is above 90000, and the ultimate target is 100000. My ETH limit order at 1680 hasn’t been filled; I’ll wait for an opportunity and enter then. Those who understand the chart should get it. I won’t say more: I’m going long against the trend and am not afraid of the criticism. Let time prove it. As long as 60000 holds on the weekly chart, I firmly stand by this view. #btc #eth
BTC-0.67%
ETH-1.26%
  • 1
Trenches
mihao
m
bade
b
mihao
4Cxj...pump
Market Cap
$.
Change
.
24h Vol
$.
Holders
.
Snoopy
S
bade
b
Snoopy
7mEh...47Cn
Market Cap
$.
Change
.
24h Vol
$.
Holders
.
bill
b
bade
b
bill
85Rh...pump
Market Cap
$.
Change
.
24h Vol
$.
Holders
.
AGT
A
bade
b
AGT
0x5d...e274
Market Cap
$.
Change
.
24h Vol
$.
Holders
.
PIEVERSE
P
bade
b
PIEVERSE
0x0e...25a9
Market Cap
$.
Change
.
24h Vol
$.
Holders
.
A recovery has no fixed timetable. The key is not how long prices have fallen, but when interest rates and the dollar turn around. This downturn was essentially driven by “sticky inflation → expectations of further Fed rate hikes → rising dollar and Treasury yields,” not a collapse in gold and silver’s supply-and-demand fundamentals. Historically, short-term stabilization and bottoming usually take 1–3 months, while a sustained recovery generally awaits signals of a Fed policy shift and often gradually unfolds 1–2 quarters after rates peak.
I. How much prices have fallen this time, and why
• O
post-image
GLDX-0.40%
PAXG+0.37%
#btc $btc Its position above 65K is not bad
post-image
BTC-0.67%
$AKE Buckle up, it's going to drop.
AKE+6.07%
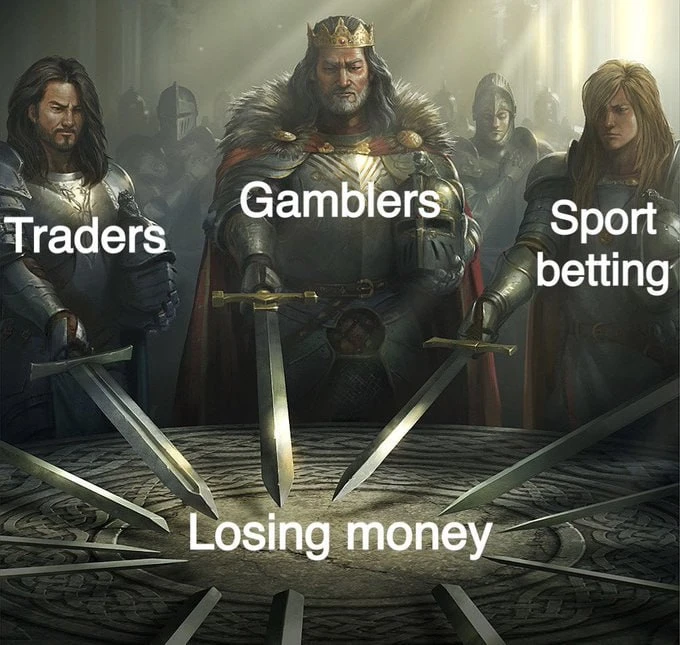
“One for all, and all for one”
post-image
The Ethereum Foundation sells another 2,500 ETH, bringing its total sales to 7,500 ETH over four day
live-cover
LIVE4,434
#SOL #WCTCS9 #ShareWeekly
Solana (SOL) Full Market Analysis: Recovery Outlook, Price Targets, Network Growth, Liquidity and Trading Strategies

Solana is at a critical point after a sharp market correction. The key question is whether SOL can build a sustainable recovery or whether sellers will push it towards lower support zones. A useful analysis must go beyond a single price candle: spot demand, futures positioning, open interest, funding, liquidations, ETF flows, Bitcoin's direction, network development and trader psychology all matter. This is a market scenario analysis, not a promise t
post-image
#GateIPOAccessAnthropic Anthropic IPO: Beyond the Hype — Can Claude’s Growth Justify a Trillion-Dollar Valuation?

The Anthropic IPO is attracting attention not simply because another technology company is preparing to enter public markets, but because it gives investors a rare opportunity to examine the economics of frontier artificial intelligence. Through Gate IPO Access Phase 3, eligible users can submit an indicative subscription in USDT for a chance to receive actual Anthropic shares. The central question is bigger than whether Claude is impressive: can Anthropic turn fast-growing AI dem
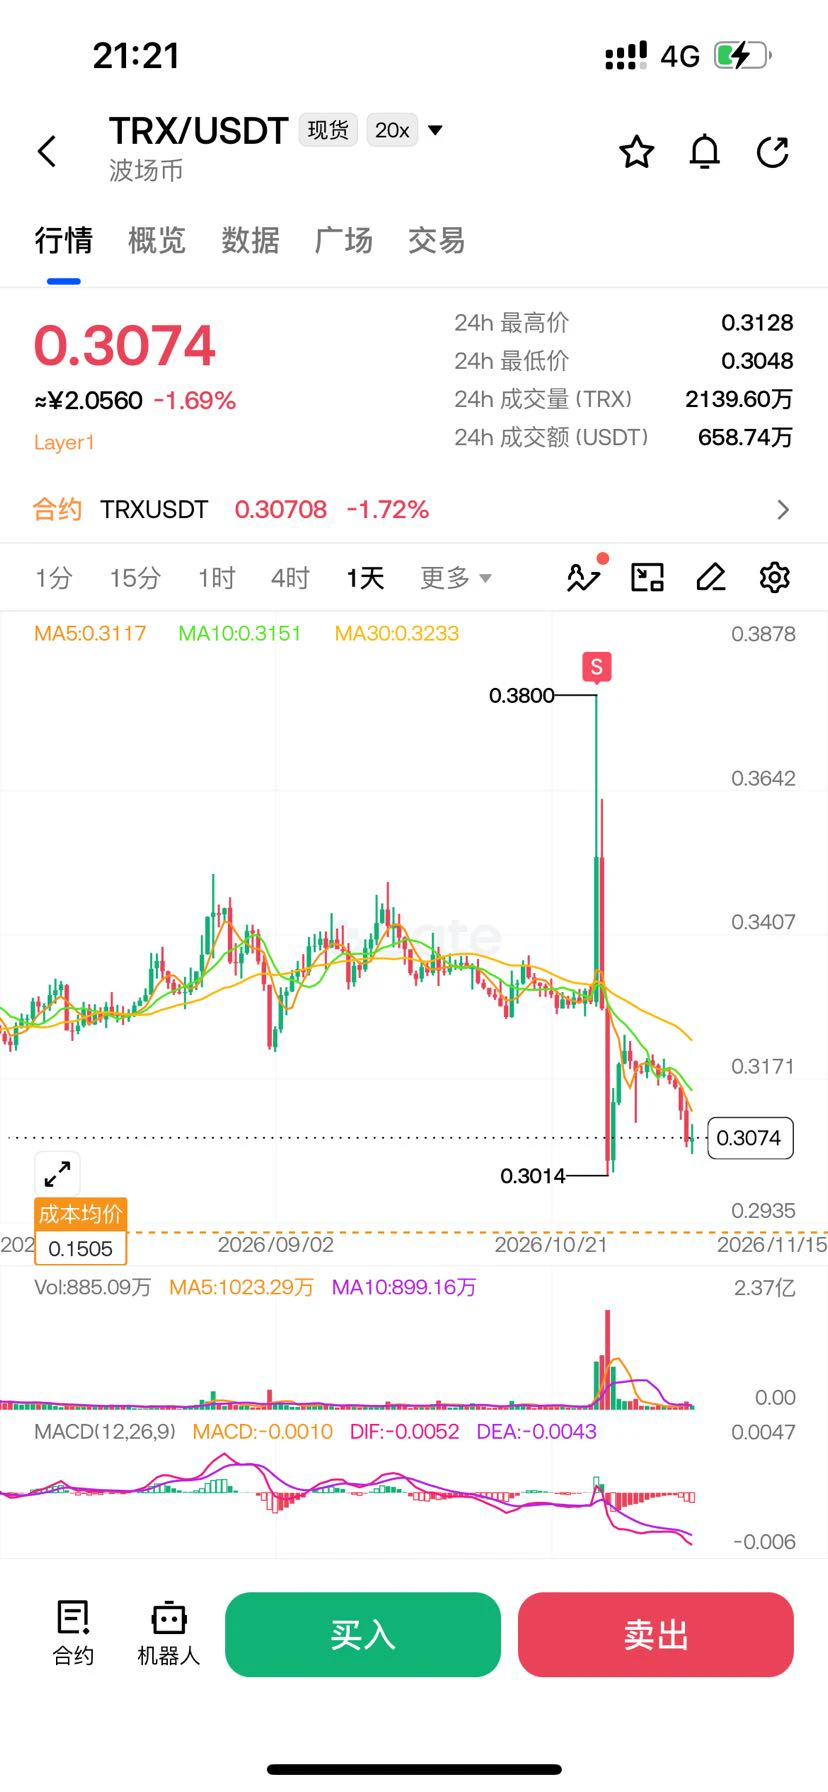
$TRX The market’s been interesting lately.

Bitcoin has ground down from 87,000 to just above 65,000, with six straight weeks of losses. USDT has shed 6.6 billion in two months, and publicly listed companies are still dumping. Everyone in crypto is waiting for a bottom, but the money hasn’t disappeared—it’s hunkered down in the corners.

What’s holding up best? Assets like TRX that never go up and never go down. On tonight’s selloff, it’s down just 1.8%, to 0.3072, on its usual, unremarkable volume. But look at its overall trend—it’s only pulled back 19% over the past six months, compared with
post-image
TRX+0.42%
If you didn’t know any better, you’d think Satoshi Nakamoto had cheated too, with Bitcoin dumped this hard over the weekend…
I’ll keep sitting tight and wait for a bottom to form before buying a little more 😭
I wasn’t planning to sell the little long-term position I have anyway, and with some sweet mining on offer, I might as well mine a little on the side
┈➤ Quick Earn Lite has 12.5 million midnight-3:native tokens this round
If you hold $BTC , $SOL , $OKB , or midnight-3:native, you can subscribe to the corresponding pool and earn rewards based on your eligible share
Eligible users can also
BTC-0.67%
NIGHT-3.10%
SOL-0.77%
OKB+1.38%
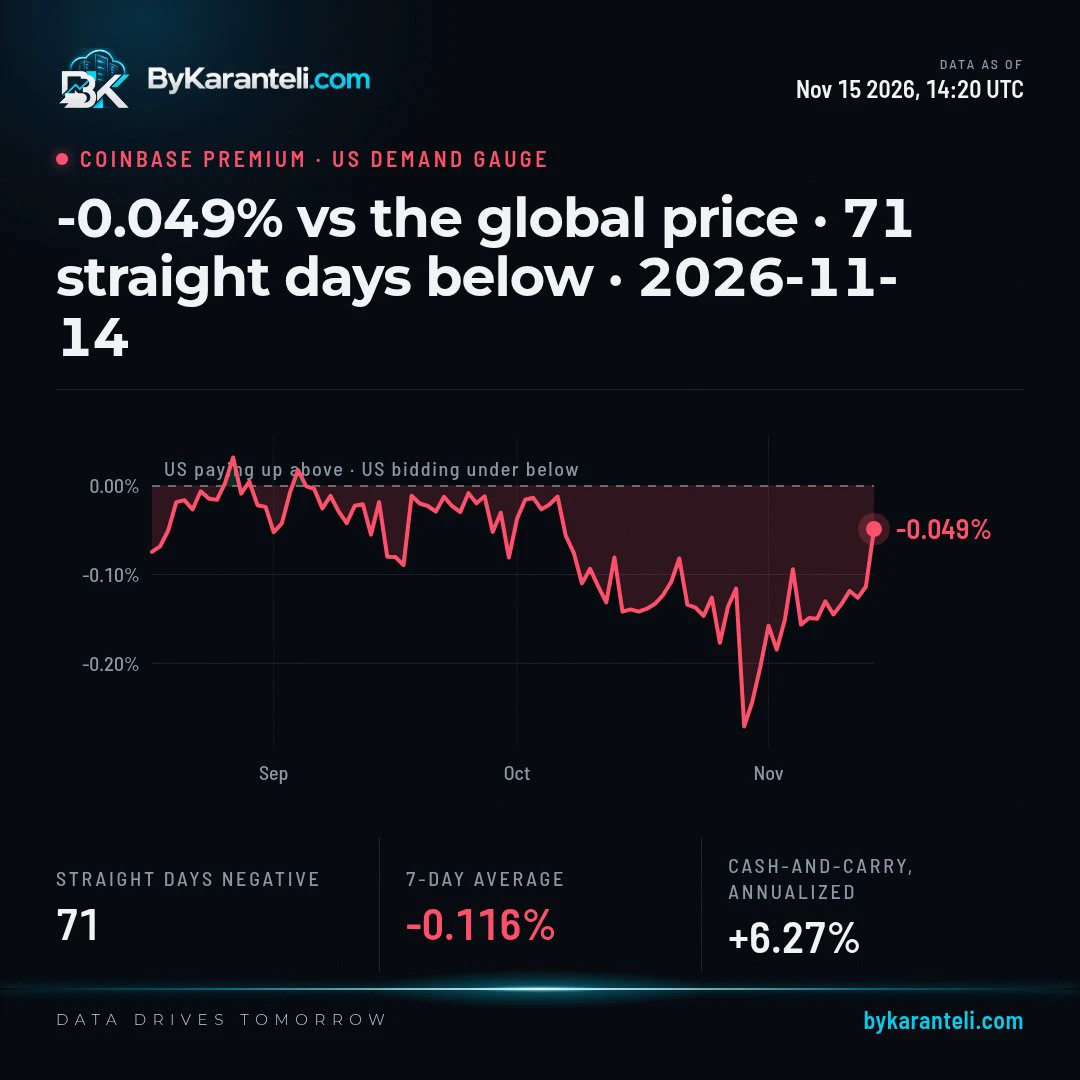
Coinbase's $BTC discount is a sliver, and yet US buyers have bid under the global price for 71 days in a row. Nov 14 closed at -0.049%, lighter than the 7 day average of -0.116%.
post-image
BTC-0.67%
That saying really rings true: in chaotic times, people fight wars; in prosperous times, they work; and in their free time, they play games
post-image
A whale keeps adding to long positions whenever ZEC declines; the 5x leveraged position is currently
live-cover
LIVE1,510
$ARIA You damn market maker, if you’ve got the guts, don’t delete my post!
ARIA+22.03%
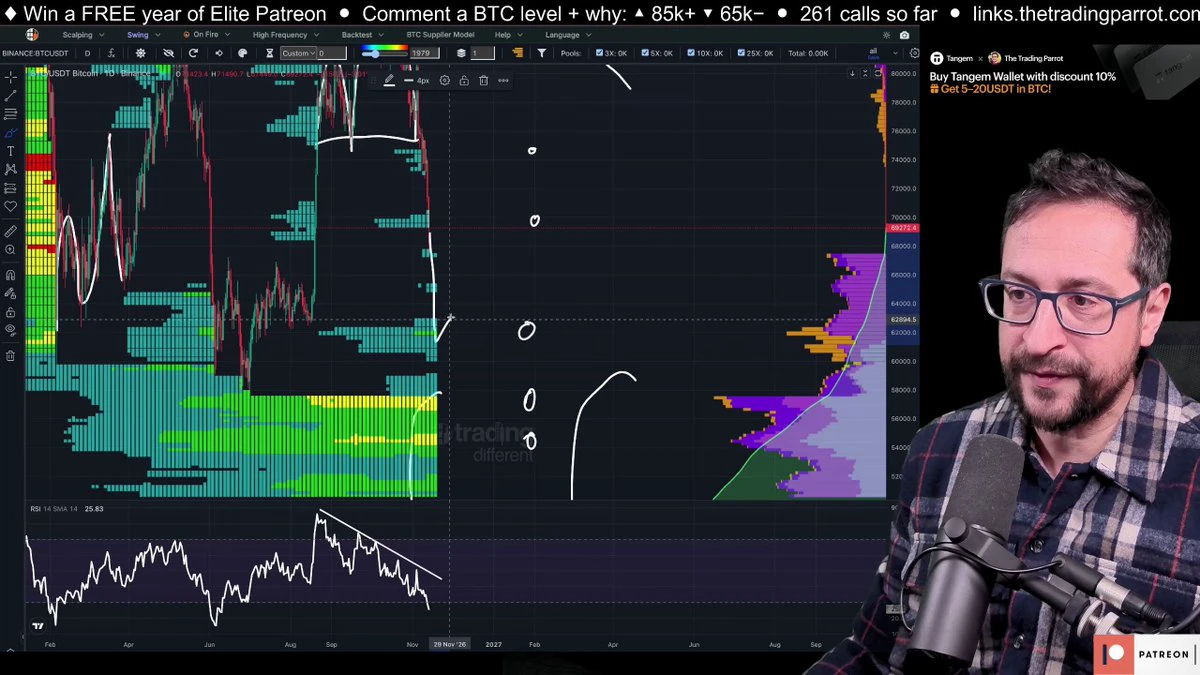
🎯 If Bitcoin accelerates instead of bouncing, $62,000-$61,000 is the next target. That's underneath the low that produced the gold candle. Market Monkey Terminal agrees $62K is the largest pool. See the setup at 23:00 in today's video.
#Bitcoin #BTC #Crypto #PriceTarget #CryptoTrading
This analysis was done using Trading Different liquidation pools, which you can access with 15% off here:
post-image
BTC-0.65%
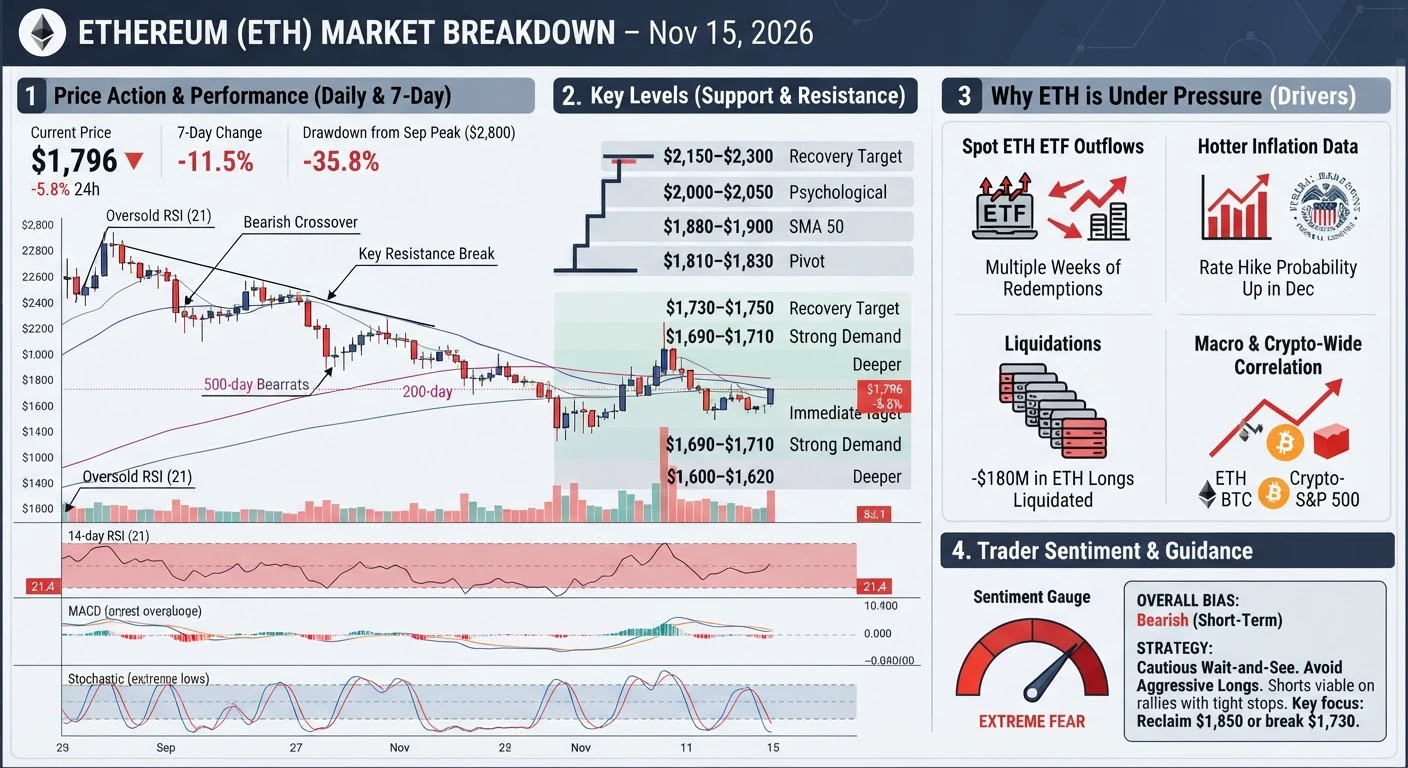
#WCTCS9 #ETH Ethereum is currently around $1,799, having just fallen below $1,800, and is down about 20% over the past week.

Why it doesn't look like a bottom yet
· Still making new lows: It closed around $1,930 on November 13, then fell to a low of $1,711 on the 14th—a steep drop in just two days.
· All moving averages are above: The 200-day moving average is around $2,146, roughly $340 above the current price.
· Funds are still flowing out: Spot ETFs saw cumulative net outflows of about $399 million over the week. A single day of inflows is not enough to show a change in trend.
· Oversold d
post-image
ThisIsTranslateContent:
#WCTCS9 #ETH Ethereum is now around $1,799, having just fallen below $1,800, and is down about 20% over the past week.
Why it doesn't look like a bottom
· Still making new lows: It closed near $1,930 on Nov. 13, then hit a low of $1,711 on the 14th, dropping sharply in just two days.
· All the moving averages are overhead: The 200-day moving average is around $2,146, about $340 above the current price.
· Funds are still flowing out: Spot ETFs saw cumulative net outflows of about $399 million over the week; a single day of inflows is not enough to change the picture.
· Oversold doesn't mean a bottom: The relative strength index is just 19.3. Such a steep drop doesn't mean a rebound is imminent.
Here are the levels to watch next
· $1,700–$1,710: Key short-term support; holding here is necessary for the price to stabilize.
· $1,800: The level currently being contested; reclaiming and holding it would be a first sign of recovery.
· $1,900: The first level to reclaim after a rebound. If $1,700 breaks, the next support is around $1,574. Whether Bitcoin can get back above $65k will also affect Ethereum.
So for now, it may be better to wait and see, then judge whether a bottom is in once the price stops making new lows around $1,700 and ETFs see sustained net inflows. $ETH ‌

repost-content-media
ETH-1.26%
  • 2
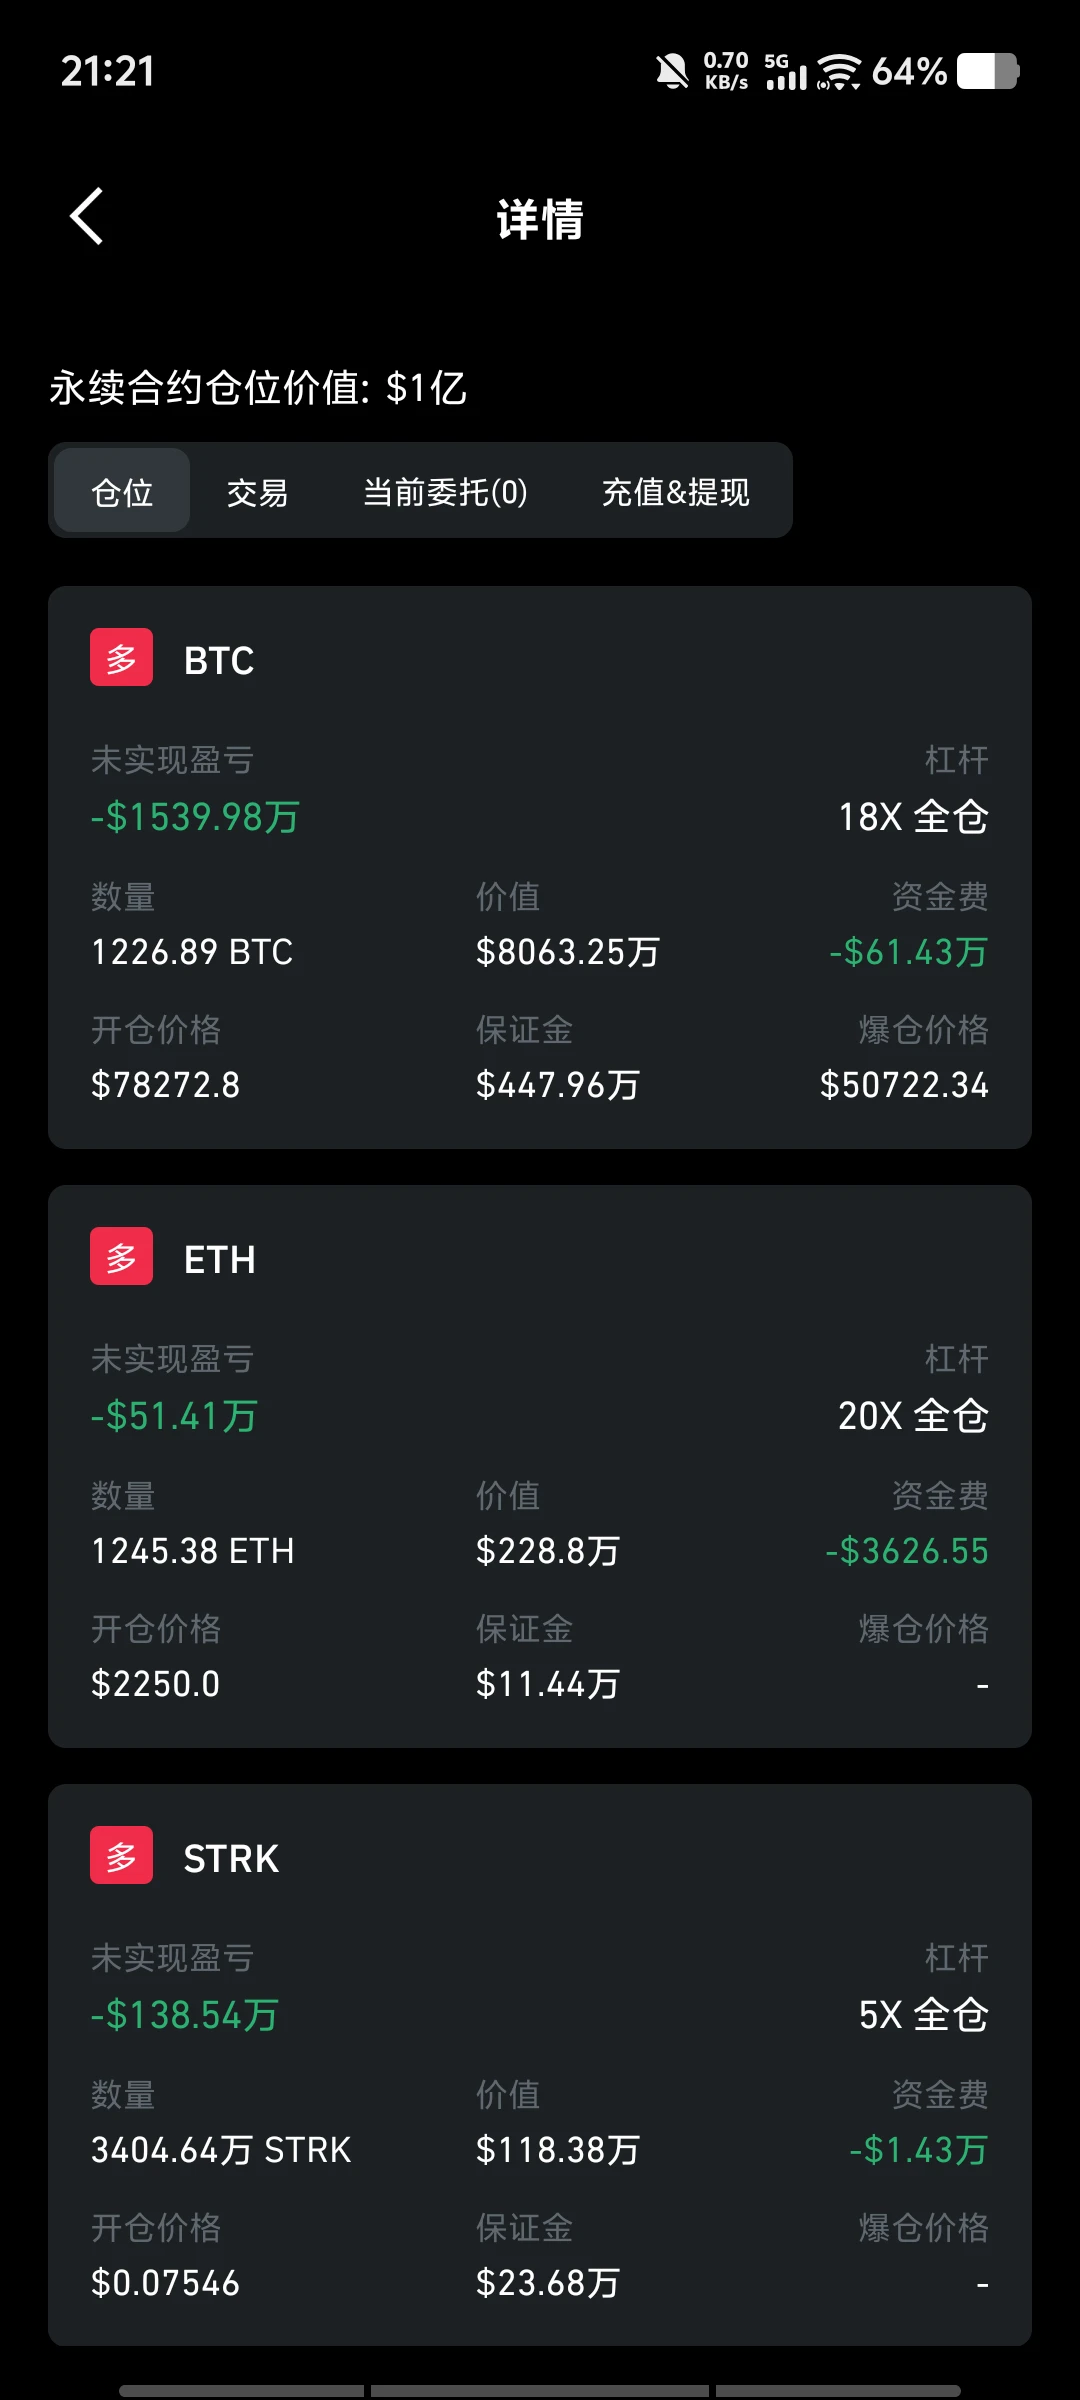
The current long-side whale's second position is an $ETH long, having added approximately 1,245 ETH worth about $2.28 million with 20x leverage. The average entry price is about $2,250, and the current unrealized loss is about $510k, accounting for over 20% of the whale's total unrealized losses. The ETH long uses cross-margin mode.
#比特币跌破7万美元
post-image
ETH-1.23%
BTC-0.67%
#JensenHuangResigns
🤖 THE AI REVOLUTION IS MUCH BIGGER THAN ONE CEO OR ONE COMPANY.

Think about it.

AI needs computing power. Computing power needs infrastructure. And infrastructure creates opportunities far beyond the traditional technology giants.

That's why decentralized AI and GPU networks deserve serious attention.

Three projects on my watchlist:

🔥 $TAO 🔥 $RENDER 🔥 $AKT

The interesting part is that these projects approach the AI infrastructure opportunity from different angles.

I don't think the biggest AI opportunity will necessarily belong to the companies making the lou
post-image
TAO+0.48%
RENDER+0.57%
AKT+0.05%
$INIT Price surged sharply from a low near 0.093 to a high of 0.142, with volume expanding alongside the strong move. Short-term bulls have plenty of momentum. However, the rally has clearly lost steam near the highs, and price has now pulled back to fluctuate around 0.13. There have been many upper wicks and pullbacks, selling pressure is starting to emerge overhead, and the short-term move looks somewhat overheated. Support: 0.120 / 0.110 Resistance: 0.142 / 0.150 Personal trade: Short Entry: 0.136-0.140 Stop-loss: 0.149 Take-profit: first target 0.120, second target 0.090. Don’t chase the p
post-image
INIT-2.53%
Load More

Join 40 M users in our growing community

⚡️ Join 40 M users in the crypto craze discussion

💬 Engage with your favorite top creators

👍 See what interests you

Trending Topics

GateIPOAccessAnthropic

355.8K Views2.7K Discussing

Gate IPO Access Phase 3 features Anthropic (ANT), with USDT subscription interest starting from 100 USDT. Successful allocations will be delivered as real shares to Gate Stock Accounts. Indicative price: $70–$78/share Subscription: Nov 12–17 (UTC+8) Allocation is not guaranteed. Please manage risk accordingly.

Dr.HanOxfordUnionSpeech

151.7K Views513 Discussing

USOctoberPPIBelowExpectations

484.1K Views1.5K Discussing

View More