AnnyCrypto

vip
Active for: 0.1y
Peak Tier 0
No content yet
MARKET OVERVIEW
gate liveLIVE
403
  • Reward
  • Comment
  • Repost
  • Share
BTC MARKET UPDATE
191 views
2026-08-26 05:03
  • Reward
  • Comment
  • Repost
  • Share
market overview
287 views
2026-08-26 02:09
  • Reward
  • Comment
  • Repost
  • Share
btc mrket
377 views
2026-08-25 23:53
  • Reward
  • Comment
  • Repost
  • Share
btc update
102 views
2026-08-25 20:08
  • Reward
  • Comment
  • Repost
  • Share
btc market prediction
262 views
2026-08-25 19:12
  • Reward
  • Comment
  • Repost
  • Share
crypto market overview
328 views
2026-08-25 18:09
  • Reward
  • Comment
  • Repost
  • Share
#BTC
BTC Market Structure: The $80K Battle Is Now the Main Story
Bitcoin is sitting near the upper end of its recent recovery, with price hovering around the $77K–$79K area after reaching roughly $79.5K. The move is significant because BTC has gained more than 20% in the past week and is approaching the first major psychological barrier at $80,000. This is no longer the same market that was trapped around $60K–$67K earlier in August. The short-term structure has shifted from range trading into a strong recovery, but the next phase needs confirmation rather than simply another vertical candle.
MrFlower_XingChen
#BTC
BTC Market Structure: The $80K Battle Is Now the Main Story
Bitcoin is sitting near the upper end of its recent recovery, with price hovering around the $77K–$79K area after reaching roughly $79.5K. The move is significant because BTC has gained more than 20% in the past week and is approaching the first major psychological barrier at $80,000. This is no longer the same market that was trapped around $60K–$67K earlier in August. The short-term structure has shifted from range trading into a strong recovery, but the next phase needs confirmation rather than simply another vertical candle.
The weekly structure has changed sharply. BTC spent much of the previous period building a broad base between approximately $60K and $67K, then began reclaiming resistance one level at a time. Once $67K–$70K was recovered, momentum accelerated through $72K and $75K, eventually pushing price toward the $79K area. That sequence matters because buyers were able to convert several previous resistance zones into potential support instead of being rejected immediately. As long as those reclaimed areas continue to hold on pullbacks, the short-term structure remains constructive.
$80K is more than just a round number. The recent high around $79.5K places BTC directly underneath a major psychological and technical decision zone. A clean break above $80K would remove an obvious ceiling and could attract momentum buyers who have been waiting for confirmation. However, simply trading above $80K for a few minutes would not be enough to call it a confirmed breakout. I would want to see BTC sustain the level, preferably with improving spot volume and without an immediate rejection back below it. A failed push through $80K followed by a loss of $77K would tell a very different story.
Volume is supporting the recovery, but the composition of the move matters. The recent rally has not been a quiet grind higher; it has involved heavy market participation and a large amount of forced short covering. That helped accelerate BTC from the low-$60Ks toward the upper-$70Ks in a very short period. The next stage therefore needs fresh spot demand. If price continues rising while spot participation remains healthy, the rally becomes structurally stronger. If price keeps climbing mainly because leveraged traders are chasing candles, the probability of a sharp retracement increases.
The liquidation picture explains part of the speed. More than $4.3B in crypto short positions were reportedly liquidated during the recent surge. When heavily positioned shorts are forced to close, their buying adds fuel to an already rising market. This can produce very powerful candles, but it also creates an important question: who keeps buying after the shorts have already been removed? That is why the next few sessions are important. The market has already received a huge amount of forced buying; sustainable continuation requires discretionary buyers to take over.
The first support zone is around $76K–$77K. This is the area I would watch if BTC starts cooling after the recent expansion. Holding above it would allow the market to consolidate while keeping the immediate bullish structure intact. A brief wick below the zone would not automatically invalidate the trend, especially if buyers quickly reclaim it. But repeated closes below $76K would show that momentum is losing strength and would increase the probability of a deeper retest.
The next major demand area sits around $72K–$74K. This region is important because it is close to the breakout path that BTC used during the latest acceleration. If BTC pulls back into this zone and buyers defend it, the market could form a higher low before another attempt at $80K. That would actually be healthier than another straight-line rally because it would allow excess leverage to reset while giving spot buyers an opportunity to establish support.
Below $70K, the picture becomes much less comfortable for bulls. The $69K–$70K area is the bigger structural line because losing it would put BTC back toward the previous range instead of keeping it in clean breakout territory. A decisive daily close below that region would weaken the current bullish thesis substantially. It would suggest that the move toward $80K was more of a liquidity-driven recovery than the beginning of a sustained trend reversal.
ETF flows are one of the strongest fundamental confirmations right now. U.S. spot Bitcoin ETFs recorded more than $1.6B of net inflows over four sessions from August 17–20, while weekly Bitcoin ETF inflows were reported around $1.9B. That is important because ETF demand represents actual investment flows rather than only derivatives positioning. The recent inflow acceleration is therefore a meaningful improvement in the demand picture.
But ETF flows still need to prove they can persist. Bitcoin ETFs remain negative on a year-to-date basis according to recent reporting, despite the powerful improvement during the latest rally. That means the current flow reversal is encouraging but should not be treated as permanent institutional accumulation yet. If positive flows continue for another several sessions while BTC holds above $75K, the argument for a more durable recovery becomes much stronger. If inflows suddenly reverse while BTC is rejected around $80K, the market could lose one of its most important sources of confirmation.
Institutional positioning is also giving the market a useful signal through Strategy. Strategy did not buy or sell Bitcoin for the second consecutive week and continued to report 840,447 BTC in its holdings after previously selling BTC during an earlier four-week period. The company also raised about $2.01B through a common-stock sale. The important point is not that Strategy is actively adding BTC right now; it is that there has been no new BTC selling from the company during the latest rally. That removes one potential source of immediate supply pressure.
Derivatives positioning is where I would be most careful. The short squeeze has already cleared a large amount of bearish leverage, which is positive from one perspective because the market is less crowded with trapped shorts. But after a 20%+ weekly rally, new leverage can build very quickly. If open interest expands aggressively while BTC approaches $80K without corresponding spot demand, the market becomes vulnerable to a liquidation-driven pullback. A slower consolidation with controlled leverage would be much healthier than another extreme vertical move.
The macro backdrop has become a major Bitcoin catalyst. The U.S. Treasury's increased focus on longer-duration Treasury buybacks has pushed attention toward lower yields and a potentially softer dollar environment. Bitcoin has benefited from this shift because investors are again treating it as an alternative asset that can respond to changing liquidity and currency expectations. The relationship is not guaranteed, though. If Treasury yields rise sharply again or the dollar strengthens materially, some of the liquidity support behind the recent move could disappear.
Regulatory sentiment has improved as another secondary catalyst. Recent efforts by the Trump administration, SEC and CFTC to move toward clearer digital-asset rules have reduced part of the regulatory uncertainty that previously weighed on institutional participation. The CLARITY Act remains an important development to watch because clearer rules could make it easier for traditional financial institutions to expand their involvement in crypto. This is more of a medium-term catalyst than a reason to chase BTC at a specific price today.
The broader market is not giving Bitcoin a completely risk-free environment. Bitcoin has recently outperformed U.S. equities and gold over the relevant period, while the stock market itself has shown mixed performance. Gold has also remained strong, which tells me the current environment is not simply a classic high-risk rotation into crypto. There is also a macro hedge component involving fiscal concerns, currency expectations and Treasury yields. That makes the next move particularly sensitive to changes in rates and liquidity.
The bullish scenario is straightforward but needs confirmation. BTC holds $76K–$77K during any pullback, buyers step in before $74K, and price returns toward $79.5K. The strongest confirmation would then be a sustained break above $80K with healthy spot participation. If $80K becomes support instead of resistance, the market would have a much cleaner path toward the low-$80Ks. I would consider a sustained move back below $76K after a failed breakout an early warning that the bullish setup is losing momentum.
The bearish scenario begins with rejection, not necessarily a crash. BTC could test $79K–$80K several times without breaking it, gradually lose momentum, and then fall through $76K. That would put $72K–$74K back into focus. If that region also fails, $69K–$70K becomes the critical structural test. A decisive daily close beneath $69K–$70K would invalidate the current breakout structure and suggest that BTC is returning to the previous range rather than establishing a new higher-timeframe advance.
The most important psychological levels are $70K, $75K and $80K. $70K is the structural pivot, $75K is the intermediate momentum level, and $80K is the major psychological ceiling. Above $80K, attention naturally shifts toward the low-$80Ks because there is less immediate historical resistance in the area. Below $75K, the market would need to rebuild momentum. These levels are more useful when combined with closing prices, volume and liquidity behavior rather than treated as exact lines.
My current read is bullish, but not blindly bullish. The combination of a sharp structural recovery, strong ETF inflows, reduced regulatory pressure, improved macro liquidity expectations and heavy short covering gives BTC a credible foundation for testing $80K. At the same time, the speed of the rally means chasing price here carries more risk than buying after a controlled retest. The market has already moved aggressively; the next confirmation should come from BTC proving that former resistance can actually become support.
For the next move, I would watch the reaction rather than predict the candle. Holding $76K–$77K keeps the immediate bullish structure alive. Reclaiming $79.5K and sustaining above $80K would strengthen the continuation case. Losing $76K opens the door toward $72K–$74K, while losing $69K–$70K would seriously damage the current breakout thesis. The key question is no longer whether Bitcoin can rally; it is whether buyers can absorb profit-taking around $80K and turn that psychological barrier into a new support zone.
$BTC
repost-content-media
  • Reward
  • Comment
  • Repost
  • Share
#ZEC
Zcash is entering August 25 with one of the strongest momentum structures in the altcoin market. ZEC has moved from roughly the $500 area into the $800s within days, recently reaching the high-$800s before pulling back toward the low-$800s. The seven-day performance remains exceptionally strong, while the latest 24-hour move has cooled from the peak. This is an important combination: the larger trend is still aggressively bullish, but short-term traders are already taking profits after an unusually fast expansion.
The current structure is best described as breakout followed by price disc
ZEC-7.30%
BTC-2.24%
MrFlower_XingChen
#ZEC
Zcash is entering August 25 with one of the strongest momentum structures in the altcoin market. ZEC has moved from roughly the $500 area into the $800s within days, recently reaching the high-$800s before pulling back toward the low-$800s. The seven-day performance remains exceptionally strong, while the latest 24-hour move has cooled from the peak. This is an important combination: the larger trend is still aggressively bullish, but short-term traders are already taking profits after an unusually fast expansion.
The current structure is best described as breakout followed by price discovery. ZEC cleared several major resistance areas, including $700 and then $800, with momentum accelerating as each level was reclaimed. The move above $800 was particularly important because it represented a major historical barrier. Once that resistance disappeared, there was relatively little overhead supply before the recent high. That explains why ZEC was able to move rapidly into the $850–$885 region.
The key question now is whether $800 becomes support. Before the breakout, $800 was resistance; after the breakout, bulls need buyers to defend it. If ZEC can consolidate around $800–$820 without breaking down, the recent rally can continue to mature into a healthier structure. A brief liquidity sweep below $800 followed by a quick reclaim would not necessarily be bearish. Repeated closes below $800, however, would suggest that the breakout is losing momentum.
The immediate resistance zone is around $850–$870, followed by the recent high near $885. ZEC has already reached this area but failed to establish acceptance above it. A sustained reclaim of $870 would strengthen the bullish case, while a clean break above the recent high would put ZEC back into price discovery. The $900 level then becomes the next major psychological test. A wick toward $900 is not enough; holding above it would be much more meaningful.
Volume is confirming that this is a genuine market repricing rather than a low-liquidity move. ZEC has seen extremely heavy spot and futures activity, with recent reports showing billions of dollars in derivatives volume around the rally. High participation supports the breakout, but it also increases volatility. After such a large weekly gain, traders need to watch whether heavy volume appears on successful support tests or mainly during sell-offs. Strong volume defending $800 would be constructive; heavy volume during repeated failed breakouts would raise distribution concerns.
Derivatives positioning is now one of the biggest risks. ZEC futures open interest has expanded dramatically alongside price, with recent snapshots placing aggregated exposure around the $1.5B–$1.8B region. That shows strong trader interest but also means the market is carrying significant leverage. Rising OI is healthier when spot demand is also increasing. If OI expands much faster than spot activity, ZEC becomes vulnerable to a liquidation cascade. A controlled reduction in OI while price holds $800 could actually strengthen the structure by removing excessive leverage.
The recent short squeeze also helped accelerate the rally. As ZEC broke through resistance, bearish positions were forced to close, creating additional buying pressure. That helped create the familiar cycle of higher price, short liquidations, more buying and another price expansion. But short squeezes eventually lose fuel. For ZEC to continue higher from here, genuine spot demand needs to replace the forced buying that powered part of the initial move.
The biggest fundamental catalyst is the Grayscale Zcash ETF. Grayscale has been moving its Zcash Trust toward an ETF structure designed to trade on NYSE Arca under the ZCSH ticker, with August 25 targeted for the transition subject to the required conditions. This gives traditional-market investors a more familiar route to ZEC exposure. The important point, however, is that the launch itself is not proof of future demand. The market will eventually judge the product through actual trading activity, asset growth and sustained flows after the initial excitement.
There is also an institutional angle involving discussions around approximately 200,000 ZEC connected to a DCG-related entity. The arrangement has been described as nonbinding, so it should not be treated as confirmed buying. Still, it shows that large holders are considering how ZEC exposure can be structured around the ETF. This could become relevant for liquidity and supply once the new product begins operating.
The broader crypto market is also helping ZEC. Bitcoin's recent recovery toward the upper-$70Ks has created a more supportive environment for high-beta altcoins. When BTC is stable, traders are more willing to rotate capital into strong narratives. ZEC is currently benefiting from that rotation, but this works in reverse as well. A sharp Bitcoin reversal could cause leveraged ZEC positions to unwind much faster than the broader market.
For the bullish scenario, ZEC needs to defend $800–$820, reclaim $850–$870 and then break the recent high with strong spot participation. A sustained move above $885 would confirm another price-discovery phase, with $900 becoming the next psychological target. If $900 eventually becomes support, the market could start discussing $1,000 as the next major round-number level.
The bearish scenario begins with repeated rejection around $850–$885 followed by a decisive loss of $800. The first deeper support would be $760–$780. If that area fails with increasing selling pressure, $700–$730 becomes the next major structural zone. A daily close below $700 would seriously weaken the current breakout thesis and indicate that ZEC has given back too much of the recent expansion.
My current read is bullish on structure but cautious on chasing price. The ETF catalyst, extreme relative strength, strong volume and institutional attention create a powerful setup, but the 60%+ weekly expansion and large derivatives positioning make volatility extremely high. The healthiest outcome would be consolidation above $800, declining excess leverage and then another attempt at the highs.
The levels I would keep on the chart are simple: $700 as major structural invalidation, $760–$780 as deeper support, $800 as the key pivot, $850–$870 as immediate resistance, $885 as breakout confirmation and $900 as the next psychological barrier. If ZEC holds the pivot and breaks the high with genuine spot demand, the bullish structure remains intact. If $800 fails and $760–$780 cannot hold, the market would need a deeper reset before another serious upside attempt.
repost-content-media
  • Reward
  • Comment
  • Repost
  • Share
#HYPE
Current Price Structure
HYPE is trading around the upper-$70s after recently reaching a new all-time high near $83.30. The broader structure remains strongly bullish because price has advanced through a sequence of higher highs and higher lows, moving from the low-$50s earlier in August toward the $80 region. The latest pullback should therefore be viewed in the context of a much larger expansion rather than as an isolated weakness. The key issue now is whether HYPE can consolidate near the highs without giving back the breakout structure.
24-Hour and 7-Day Performance
The short-term pe
MrFlower_XingChen
#HYPE
Current Price Structure
HYPE is trading around the upper-$70s after recently reaching a new all-time high near $83.30. The broader structure remains strongly bullish because price has advanced through a sequence of higher highs and higher lows, moving from the low-$50s earlier in August toward the $80 region. The latest pullback should therefore be viewed in the context of a much larger expansion rather than as an isolated weakness. The key issue now is whether HYPE can consolidate near the highs without giving back the breakout structure.
24-Hour and 7-Day Performance
The short-term performance shows how aggressive this move has become. HYPE has gained roughly 30%+ over the past seven days, while the latest 24-hour performance has cooled from the strongest part of the rally. This creates an important distinction between momentum and exhaustion. A strong weekly trend can remain intact even if the next few sessions are sideways or slightly negative. After such a fast move, the market needs time to establish new support instead of immediately assuming that another vertical candle is required.
Trading Volume
HYPE's volume has expanded dramatically alongside price, with roughly $1B in reported 24-hour trading activity across the market. That confirms that the breakout is attracting substantial participation rather than being driven by extremely thin liquidity. The next volume signal matters more than the previous one: if volume contracts while price holds above $76–$80, that would suggest healthy consolidation. If large volume starts appearing mainly during declines, it could indicate that early buyers are distributing into strength.
Liquidity and Liquidation Zones
The most important liquidity areas are concentrated around $76, $80 and the previous high near $83.30. These levels are obvious enough to attract stop orders, breakout orders and leveraged liquidations. A fast move through one of them can create a cascade because multiple order types become active simultaneously. That is why a temporary wick below support or above the previous high should not automatically be treated as a confirmed breakout or breakdown. The market's reaction after the liquidity event is more informative.
Immediate Support
The first support zone is around $76–$77. This area is important because HYPE is currently close enough to the recent high for buyers to defend the latest breakout without needing a deep retracement. Holding this region would allow price to consolidate while preserving the short-term bullish structure. A brief sweep below $76 followed by a strong recovery would be less concerning than several consecutive closes underneath the level.
Major Support
Below $76, the next meaningful demand zone is around $72–$74. This region sits closer to the previous acceleration area and could become the foundation for another higher low. If HYPE reaches this zone and buyers step in with strong volume, the larger trend can remain constructive. A decisive break below $72, particularly with increasing selling volume, would show that the market is giving back more of the recent expansion.
Structural Support
The $68–$70 region is the deeper structural level. This zone matters because it represents an area where the previous bullish momentum was established. If HYPE holds above it, the broader breakout can still be considered intact despite a sizeable correction. A daily close below $68–$70 would significantly weaken the current structure and increase the probability that the recent rally was an overextended momentum phase rather than the beginning of sustained price discovery.
Resistance and ATH
The immediate resistance remains the $82–$83.30 area, with $83.30 representing the latest all-time high. Bulls need to reclaim this zone convincingly to restart the strongest part of the trend. A single wick above $83.30 would not be enough because price discovery can produce liquidity sweeps. The stronger signal would be a breakout followed by sustained trading above the previous high, ideally supported by strong spot participation.
Psychological Levels
The $80 level is now the most important psychological number. It sits directly beneath the recent high and provides a simple reference for market sentiment. Above $80, buyers have control of the immediate structure; below $80, the market becomes more vulnerable to profit-taking. Above $83.30, $85 becomes the next psychological checkpoint, followed by $90. These should be treated as reaction zones rather than guaranteed targets.
Derivatives Positioning
HYPE's derivatives activity is particularly important because Hyperliquid is one of the largest perpetual-futures venues in crypto. Strong derivatives participation can amplify price movements in both directions. Rising open interest alongside rising price can support momentum when backed by genuine spot demand, but excessive leverage can make the market fragile. If HYPE continues rising while open interest expands much faster than spot volume, the probability of a sharp liquidation-driven pullback increases.
Liquidation Risk
The recent rally has likely removed a significant amount of short positioning, but new leveraged longs can replace those positions quickly after an all-time-high breakout. This creates a different type of risk: instead of a short squeeze driving the next move, crowded longs could become the source of downside fuel. A healthy market would allow leverage to normalize while price remains above major support. If HYPE suddenly loses $76 with open interest still elevated, liquidation pressure could accelerate the move toward $72–$74.
Protocol Fundamentals
The fundamental backdrop is one of the strongest arguments behind HYPE's valuation. Hyperliquid continues to generate substantial trading activity and protocol fees, reflecting real usage rather than a purely speculative token narrative. Recent reports have highlighted periods where Hyperliquid's daily fees reached several million dollars, showing that the underlying trading ecosystem remains active. Continued growth in volume and fees would provide stronger fundamental support for the token if the trend persists.
Regulatory Catalyst
Regulatory developments are another important catalyst. Recent comments from President Trump indicated that the CFTC is working toward bringing Hyperliquid into the United States in a compliant framework. The market reacted positively because greater regulatory clarity could expand Hyperliquid's potential addressable user base. However, this remains a catalyst to monitor rather than a completed development. Actual regulatory implementation would carry considerably more weight than headlines alone.
Token Supply and Unlocks
Supply is an important medium-term risk. HYPE's circulating supply is below its maximum supply, meaning future token emissions and unlocks can introduce additional sell pressure. Reports have pointed to a significant scheduled contributor unlock in early September. The market may begin pricing this supply event before it arrives, especially if HYPE remains near all-time highs. Strong protocol demand could absorb the additional supply, but weakening momentum would make the unlock more significant.
Broader Crypto Market
Bitcoin remains the main external driver for HYPE. BTC's recent recovery has created a supportive environment for high-beta assets, allowing capital to rotate into stronger altcoin narratives. HYPE has significantly outperformed the broader market during the latest move, which indicates specific demand rather than simple market correlation. However, if Bitcoin experiences a sharp reversal, high-beta assets such as HYPE could experience larger percentage declines because leveraged traders tend to reduce risk quickly.
Relative Strength
HYPE's relative performance is one of the strongest signals on the chart. The token has gained substantially more than the broader crypto market over the same period and has established a new all-time high while many major altcoins remain below their previous peaks. This shows that capital is specifically targeting the Hyperliquid ecosystem. Sustained relative strength would support continuation, while a sharp loss of HYPE/BTC strength alongside a break below $76 would indicate that the market is rotating away from the narrative.
Bullish Scenario
The bullish path begins with HYPE defending $76–$77, then reclaiming $80 and retesting the $82–$83.30 resistance zone. A sustained breakout above $83.30 with strong spot volume would confirm another price-discovery phase. From there, $85 becomes the first psychological checkpoint and $90 the next major round-number level. The stronger bullish structure would be price breaking the previous high while derivatives leverage remains controlled rather than exploding alongside the breakout.
Bearish Scenario
The bearish path begins with repeated rejection around $82–$83.30 followed by a decisive loss of $76. That would open the door toward $72–$74. If buyers fail to defend that area, $68–$70 becomes the major structural test. A daily close below $68–$70 would seriously weaken the current bullish thesis and suggest that HYPE is entering a deeper correction. A simultaneous Bitcoin sell-off would make this bearish scenario considerably stronger.
Key Confirmation and Invalidation
For bulls, the clearest confirmation is a sustained break above $83.30 with healthy spot participation and controlled derivatives positioning. For the short-term structure, $76 is the key defense level. For the broader breakout, $68–$70 is the major invalidation zone. This creates a simple framework: above $83.30, momentum expands; between $76 and $83.30, consolidation remains possible; below $76, correction risk increases; below $68–$70, the current breakout structure is seriously damaged.
Overall Market Read
My current read is bullish on HYPE's structure but cautious about chasing the latest move. The token has strong momentum, exceptional volume, genuine protocol activity, regulatory catalysts and clear relative strength. At the same time, the move has been extremely fast, derivatives exposure is significant and future token unlocks remain a supply consideration. The healthiest outcome would be consolidation above $76 followed by another attempt at the all-time high.
What Matters Next
The next move should be judged through price, volume and leverage together. If HYPE holds $76–$80 while volume remains healthy and excessive leverage cools, the market can build a stronger base for another breakout. A clean break above $83.30 would then confirm renewed price discovery. If $76 fails and $72–$74 cannot hold, the market likely needs a deeper reset. For now, HYPE remains one of the strongest momentum assets, but the quality of its next consolidation will matter more than the size of its next candle.
$HYPE
repost-content-media
  • Reward
  • Comment
  • Repost
  • Share
#BTCBreaks80k
BTC MARKET STRUCTURE: THE $80K TEST IS NOW REAL
Bitcoin has moved into a completely different short-term structure. BTC is trading around $80,800, up roughly 4.9% over the last 24 hours and 25.7% over the past seven days, with around $57 billion in 24-hour spot volume. The important part is not simply the size of the rally; it is the sequence. BTC reclaimed the mid-$70Ks, pushed through $77K, challenged $80K, and is now trading around the psychological barrier that previously rejected price. That makes the current area a decision zone rather than a level to chase blindly.
PRICE
BTC-2.24%
IBIT0.15%
MrFlower_XingChen
#BTCBreaks80k
BTC MARKET STRUCTURE: THE $80K TEST IS NOW REAL
Bitcoin has moved into a completely different short-term structure. BTC is trading around $80,800, up roughly 4.9% over the last 24 hours and 25.7% over the past seven days, with around $57 billion in 24-hour spot volume. The important part is not simply the size of the rally; it is the sequence. BTC reclaimed the mid-$70Ks, pushed through $77K, challenged $80K, and is now trading around the psychological barrier that previously rejected price. That makes the current area a decision zone rather than a level to chase blindly.
PRICE STRUCTURE: BULLISH, BUT EXTENDED
The short-term structure remains bullish because buyers are still producing higher highs and higher lows. BTC briefly reached around $81,200 today before pulling back, showing that sellers are already becoming active above $80K. The next technical resistance is around $81,033, followed by the previous May high near $82,814. If BTC can turn those areas into support instead of repeatedly rejecting from them, the recovery would become much more convincing.
VOLUME AND PARTICIPATION: THE MOVE HAS REAL FUEL
This rally is not happening on completely empty volume. CoinGecko currently shows roughly $57 billion in 24-hour BTC trading volume, while Coinbase reports substantial activity across the broader seven-day period. That matters because a price breakout supported by expanding participation has more credibility than a thin-volume spike. At the same time, the market has already travelled a long distance in a short period, so volume needs to remain strong around $80K rather than disappear after the breakout attempt.
LIQUIDITY: $80K IS THE BATTLEFIELD
The liquidity picture is becoming especially interesting around the $80K–$82K region. Analysts have noted that trading above $80K is relatively thin, which can make BTC move quickly when large orders or liquidations hit the book. A sustained break higher could force bearish positions to cover and create another acceleration toward $82K–$85K. On the other side, failure to hold $80K could send price back toward the recent breakout area around $77K–$76K, where buyers now need to prove that the previous resistance has become support.
LIQUIDATION ZONES: WATCH BOTH SIDES
I would treat $80K–$82K as the first major upside liquidity zone rather than assuming every move above $80K will immediately continue. A clean expansion through this area could squeeze remaining shorts, while a sharp rejection could trap late longs. Below price, the important downside liquidity region is around $76K–$74K, because this area contains the recent breakout structure and the market mean near $75,968. A move into that zone would not automatically destroy the bullish trend, but losing it decisively would change the character of the rally.
DERIVATIVES: LEVERAGE HAS RESET, BUT RISK IS BUILDING AGAIN
The derivatives market is sending a mixed but useful signal. Recent data showed Bitcoin futures open interest falling about 2.65% while funding stayed close to its baseline, suggesting that part of the excessive leverage was cleared during the weekend pullback rather than simply adding more crowded longs. At the same time, broader futures positioning remains large, with offshore Bitcoin futures exposure reported near $47.9 billion. This means derivatives can amplify whichever side wins the $80K battle.
INSTITUTIONAL FLOWS: THE SPOT SIDE IS SUPPORTIVE
The strongest part of the current setup is that the rally is not purely a futures story. Bitcoin ETFs have recently seen a meaningful return of demand, with five consecutive sessions of inflows totaling nearly $2 billion according to recent reporting. IBIT alone attracted roughly $1 billion during the previous week, including a particularly strong single-day inflow. If that spot demand continues while derivatives funding remains controlled, the market has a healthier foundation for continuation.
WHALE ACTIVITY: LARGE TRANSFERS ARE WORTH WATCHING
There are also signs that large holders are actively moving coins. A $52 million Bitcoin transfer from Coinbase Institutional was reported today, described as an outflow that could reflect institutional custody or positioning rather than immediate selling. One transfer cannot prove accumulation, but it becomes more interesting when exchange balances, ETF demand and price structure are all moving in the same direction. I would watch whether similar large outflows continue instead of treating one transaction as a guaranteed bullish signal.
CORPORATE DEMAND: STRATEGY IS PAUSING, NOT DUMPING
Strategy remains another important part of the institutional picture. The company reportedly ended the latest week with 840,447 BTC and had neither bought nor sold Bitcoin for the second consecutive week. That is significant because Strategy previously sold thousands of BTC over a four-week period, so the current pause removes one potential source of supply pressure even though it does not represent new buying.
MOMENTUM: BULLS HAVE CONTROL, BUT THE MARKET IS HOT
The biggest short-term warning is momentum itself. BTC has gained roughly a quarter in seven days, and one recent technical reading placed the 14-day RSI around 80.5, clearly showing an overheated short-term condition. Overbought does not automatically mean bearish; strong trends can remain overbought for longer than traders expect. But after such a vertical move, consolidation around $78K–$80K could actually be healthier than another immediate vertical candle.
MACRO: LIQUIDITY IS HELPING THE RISK-ON MOVE
The broader macro backdrop has also become more supportive. The U.S. Treasury's plan to increase purchases of longer-dated Treasury securities has been linked to improved liquidity conditions, while a weaker dollar and expectations for clearer U.S. crypto regulation have improved sentiment toward risk assets. Bitcoin has also benefited from the broader demand for alternative assets as investors watch U.S. fiscal conditions and Treasury yields. The important question now is whether these macro tailwinds remain strong enough to support spot demand after the initial short squeeze fades.
BULLISH SCENARIO: $80K BECOMES SUPPORT
The clean bullish scenario is simple: BTC holds above $79K–$80K, absorbs the sellers around $81K, and produces a convincing daily close above $81K–$82K with strong spot volume. A successful breakout above the $82,814 May high would be an even stronger confirmation that the market is transitioning from recovery into a larger upside phase. In that case, the next psychological areas naturally come into focus around $85K, $90K and eventually $100K.
BEARISH SCENARIO: THE BREAKOUT FAILS
The bearish scenario starts with repeated rejection above $80K followed by a loss of the $77K–$76K breakout area. If BTC then breaks below the roughly $75,968 market mean, the recent rally would begin losing its strongest short-term support. A deeper move toward $74K would become possible, and a decisive break beneath that zone would make the recovery structure considerably weaker. The key distinction is between a normal pullback and a structural failure: holding $76K keeps the bullish recovery alive, while losing $74K would demand much more caution.
MY MARKET READ: CONFIRMATION MATTERS MORE THAN PREDICTION
Right now, BTC has the stronger bullish structure, but the market is sitting directly underneath a major resistance cluster after an unusually fast seven-day advance. I would not call $80K an automatic launchpad or an automatic top. The cleaner signal is how price behaves after the first rejection: holding $79K–$80K and reclaiming $81K–$82K would favor continuation, while losing $76K and then $74K would shift the structure toward a deeper correction. For me, the most important story is no longer whether Bitcoin can touch $80K—it already has. The real test is whether buyers can turn $80K from a psychological ceiling into a genuine support zone.
$BTC
repost-content-media
  • Reward
  • Comment
  • Repost
  • Share
#SOLBreaks100
SOL breaks $100: breakout or another trap?
SOL has finally reclaimed the $100 area, marking its first move above this psychological level since February. The important part is not simply touching $100 — it is whether buyers can turn that former resistance into support. Recent market data shows SOL had already climbed more than 30% over seven days, making this a powerful momentum move but also one that is becoming increasingly stretched.
The price structure is turning bullish.
The recent move has taken SOL through the $90 region and above the 200-day EMA, which had previously act
SOL-4.88%
HYPE1.25%
BTC-2.24%
MrFlower_XingChen
#SOLBreaks100
SOL breaks $100: breakout or another trap?
SOL has finally reclaimed the $100 area, marking its first move above this psychological level since February. The important part is not simply touching $100 — it is whether buyers can turn that former resistance into support. Recent market data shows SOL had already climbed more than 30% over seven days, making this a powerful momentum move but also one that is becoming increasingly stretched.
The price structure is turning bullish.
The recent move has taken SOL through the $90 region and above the 200-day EMA, which had previously acted as a major ceiling. That changes the short-term structure from recovery into a potential trend reversal. For me, $100 is now the first level that needs to hold. Above it, $105–$110 becomes the immediate resistance zone, while a clean daily close through that area would put $120 into focus.
Momentum is strong, but the move is not completely spot-driven.
The derivatives market is doing a lot of the heavy lifting. Current data shows roughly $6.5B in SOL futures open interest, with about $14.7B in futures volume over 24 hours versus roughly $1.74B in spot volume. That tells me leverage is playing a major role in the rally. Strong derivatives activity can accelerate a breakout, but it also means the market can reverse quickly if crowded positions start unwinding.
The liquidation picture adds another layer.
Recent data recorded more than $20M of SOL futures liquidations over 24 hours, while the broader rally has been associated with a significant wave of short liquidations across crypto. Short squeezes can push price through technical levels much faster than normal buying would. The danger is that once the forced buying disappears, SOL may need a pullback to find genuine spot demand.
Whale positioning is still mixed.
Tracked Hyperliquid accounts currently show approximately $82.6M of SOL longs against $111.9M of shorts, leaving the tracked group net short by roughly $29.3M. That is interesting because price has been moving higher while some large tracked traders remain positioned against the rally. If SOL continues climbing, those shorts could become fuel for another squeeze; if momentum fails, their positioning could reinforce downside pressure.
Institutional demand is the stronger fundamental signal.
U.S. spot Solana ETFs have accumulated roughly $1.15–$1.16B of net inflows, with recent sessions showing renewed buying. That gives this rally a different character from a purely speculative meme-driven move: there is evidence of persistent investment demand behind the asset. Continued ETF inflows would strengthen the case that dips are being absorbed rather than simply traded by short-term leverage.
The network catalyst is also real.
Agave 4.2 has shipped on mainnet, bringing cheaper rent, larger transaction capacity and faster slots. Solana's recent mainnet feature activation reduced slot times from 400ms to 350ms, while further reductions toward 200ms are part of the broader upgrade roadmap. These improvements matter because they strengthen the network's performance narrative while SOL is simultaneously receiving renewed market attention.
The broader market is helping SOL.
This is not an isolated Solana move. Crypto experienced a powerful risk-on rebound during the past week, with Bitcoin and other large-cap assets recovering sharply and a major short squeeze adding fuel. Treasury liquidity developments have also improved the tone for risk assets. That broader environment is important because SOL usually performs best when Bitcoin is stable-to-bullish and capital starts rotating toward higher-beta assets.
Bullish scenario: $100 becomes the launchpad.
The clean bullish setup is a sustained hold above $100 followed by a break of $105–$110 with expanding spot participation. If that happens, $115 becomes the next area to watch, followed by the psychological $120 level. A move toward $120 would be much more convincing if ETF inflows remain positive while futures open interest stops expanding excessively relative to spot demand.
Bearish scenario: the $100 breakout fails.
The main warning would be a fast rejection back below $100 followed by a loss of $95. That would suggest the breakout was heavily driven by leverage rather than durable spot demand. Below $95, the previous $90 breakout zone becomes the key test. Losing $90 would weaken the current bullish structure and increase the probability of a deeper retracement toward the mid-$80s.
My read: bullish structure, but chasing the candle is the risky part.
SOL has genuine catalysts behind this move — ETF demand, stronger network performance, improving market liquidity and a major technical breakout — but derivatives leverage is also elevated. I would treat $100–$95 as the key battleground rather than assuming $120 is automatic. Holding that zone keeps the breakout thesis alive; losing it would turn the recent surge into a potential failed breakout. The next major confirmation is therefore not simply another green candle — it is whether SOL can prove that $100 has changed from resistance into support.
$SOL @Gate_Square
repost-content-media
  • Reward
  • Comment
  • Repost
  • Share
#GoldmanSachsBullishOnCXMT
CXMT is becoming one of the most important names in China’s semiconductor push. Goldman Sachs has initiated coverage on ChangXin Memory Technologies with a Buy rating and a CNY 129 price target, but the more interesting part of the report is the reasoning behind that target: Goldman sees a combination of expanding DRAM capacity, stronger domestic substitution and growing AI-memory demand creating a multi-year earnings opportunity.
Capacity expansion is the biggest part of the thesis. Goldman expects CXMT’s monthly wafer capacity to rise from roughly 270,000 units in
MU2.46%
SKHY2.69%
MrFlower_XingChen
#GoldmanSachsBullishOnCXMT
CXMT is becoming one of the most important names in China’s semiconductor push. Goldman Sachs has initiated coverage on ChangXin Memory Technologies with a Buy rating and a CNY 129 price target, but the more interesting part of the report is the reasoning behind that target: Goldman sees a combination of expanding DRAM capacity, stronger domestic substitution and growing AI-memory demand creating a multi-year earnings opportunity.
Capacity expansion is the biggest part of the thesis. Goldman expects CXMT’s monthly wafer capacity to rise from roughly 270,000 units in 2026 to 447,000 in 2028 and 665,000 by 2030. That is more than a 2x increase in four years. The important distinction is that this is future production capacity, not current market share. Goldman estimates that the expanded supply could eventually represent around 50% of China’s DRAM demand by 2028, assuming investment, yields and customer validation progress as expected.
The industry backdrop is unusually supportive. Counterpoint says global DRAM demand continues to exceed supply as AI infrastructure expands, while conventional DRAM prices have already risen sharply. CXMT was also the fastest-growing DRAM supplier in its Q2 2026 assessment, with revenue growth of roughly 716% year over year. That combination of strong demand and rapidly expanding CXMT shipments is exactly the type of environment where additional capacity can translate into significant revenue growth.
But capacity alone does not justify CNY 129. The market ultimately needs to see that additional wafers become profitable products. Yield rates, utilization, product mix, pricing and manufacturing efficiency will determine how much of CXMT’s future capacity actually converts into earnings. This is why Goldman’s valuation is based on much more than volume growth: its CNY 129 target assumes substantial improvement in profitability as CXMT moves further up the technology curve.
HBM is the high-upside part of the story. Goldman expects HBM-related revenue to increase from around 2% of CXMT revenue in 2026 to 27% by 2030. That would materially change the company's product mix because AI accelerators require high-bandwidth memory with much greater value per unit than conventional DRAM. The catch is that HBM is technically demanding, so customer qualification, yields and production scale will be critical before investors can treat this forecast as a certainty.
There is already evidence that CXMT is gaining global relevance. Reuters identified CXMT as the world's fourth-largest DRAM maker in 2025, with approximately 7.7% market share, while its July IPO raised about CNY 57.9 billion. That capital gives the company significant resources to fund capacity expansion and technology development. The IPO itself was extraordinary, with shares closing dramatically above the CNY 8.66 offering price on the first trading day.
The valuation is where the debate becomes serious. Goldman’s report reportedly had CXMT around 10x estimated 2027 earnings, while its CNY 129 target corresponds to roughly 24x 2027 earnings. In other words, reaching the target requires investors to pay a significantly higher multiple while simultaneously believing that earnings will expand rapidly. That makes execution and future DRAM pricing just as important as the headline capacity numbers.
The biggest structural risk is that memory remains cyclical. A strong DRAM environment can create exceptional profits, but aggressive capacity expansion across the industry can eventually change the supply-demand balance. If CXMT and other manufacturers add capacity faster than AI and server demand grows, memory prices could weaken and compress margins. This is particularly important because the current bullish semiconductor environment is already attracting substantial investment. Goldman itself expects China’s semiconductor capital expenditure to reach around $82 billion by 2030, highlighting both the opportunity and the potential for future oversupply.
Competition also cannot be ignored. Samsung, SK hynix and Micron remain the dominant global DRAM players, while CXMT is still developing its technology and scale. Counterpoint currently estimates Samsung at 39% of global DRAM revenue in Q2 2026, followed by SK hynix at 26% and Micron at 25%. CXMT's growth is impressive, but moving from rapid domestic expansion toward sustained global competitiveness will require continued improvement in process technology, yields and advanced-memory products.
The geopolitical angle strengthens the long-term narrative. China’s semiconductor strategy is increasingly focused on reducing dependence on overseas technology and building domestic supply chains. Goldman estimates China’s IC volume self-sufficiency rate reached about 70% by June 2026, up significantly from previous years. CXMT sits directly inside that strategic push because memory is a critical component across smartphones, servers, PCs and AI infrastructure.
For the market setup, the CNY 60–62 region is the first major technical checkpoint. CXMT has already experienced an extraordinary repricing since its IPO, so investors should distinguish between a fundamentally improving company and a stock that has already priced in a large amount of future growth. A sustained move through the recent highs with strong turnover would indicate that buyers are still willing to absorb elevated valuations. A rejection around the highs followed by a loss of the recent consolidation area would suggest that momentum is cooling and that the market needs to reset expectations.
Bullish scenario: CXMT maintains strong DRAM pricing, ramps capacity close to Goldman’s projections, improves yields, expands HBM production and continues gaining domestic market share. In that case, earnings estimates could keep moving higher and the CNY 129 target becomes increasingly defensible. The strongest confirmation would be rising revenue and margins alongside capacity growth, rather than price appreciation alone.
Bearish scenario: capacity ramps faster than demand, DRAM prices weaken, HBM development takes longer than expected or manufacturing yields disappoint. That would expose the gap between CXMT’s current valuation and its future earnings assumptions. Because the stock has already undergone an exceptional post-IPO repricing, disappointment could produce a much larger valuation reset than in a normal semiconductor name.
My read is bullish on the business trend but more cautious on the stock valuation. Goldman’s report gives CXMT a credible long-term growth framework: expanding capacity, AI-memory exposure, domestic substitution and a supportive DRAM cycle. But CNY 129 should be treated as an analyst scenario, not a guaranteed destination. The next stage of the story will be decided by actual production, pricing, HBM qualification, margins and cash-flow generation. If those numbers confirm the growth narrative, CXMT could become a serious global memory competitor; if they fail to keep pace with expectations, the market will quickly focus on valuation instead.
$CXMT
repost-content-media
  • Reward
  • Comment
  • Repost
  • Share
#BessentPlansToShakeBondBears
Bessent is taking a much more active approach to the Treasury market, and the real battle is happening at the long end of the curve. U.S. Treasury Secretary Scott Bessent has doubled planned buybacks of 10- to 30-year Treasuries to at least $4 billion per operation beginning in September, while also signaling that the size could go higher. The objective is clear: improve liquidity, support long-duration bonds and push back against the recent rise in long-term yields.
The market reaction shows why this matters. The initial announcement triggered a sharp drop in lo
XAUUSD-0.54%
MrFlower_XingChen
#BessentPlansToShakeBondBears
Bessent is taking a much more active approach to the Treasury market, and the real battle is happening at the long end of the curve. U.S. Treasury Secretary Scott Bessent has doubled planned buybacks of 10- to 30-year Treasuries to at least $4 billion per operation beginning in September, while also signaling that the size could go higher. The objective is clear: improve liquidity, support long-duration bonds and push back against the recent rise in long-term yields.
The market reaction shows why this matters. The initial announcement triggered a sharp drop in long-term yields, but much of that move was quickly reversed. The 10-year yield returned toward 4.7%, while the 30-year yield remained around 5.2% after recently reaching its highest level in nearly two decades. That reversal is important because it suggests investors are not convinced that Treasury buybacks alone can change the underlying direction of the bond market.
The TGA angle makes the story even more interesting. Bessent has indicated that Treasury could use money sitting in the Treasury General Account, which was around $940 billion, to help finance buybacks rather than relying entirely on new short-term borrowing. That gives Treasury another tool for managing the composition of its debt, but it does not eliminate the government's need to finance deficits and refinance existing debt.
This is essentially a maturity-management strategy, not traditional monetary easing. Treasury can buy longer-dated securities, potentially reducing pressure in the 10- to 30-year sector, while adjusting issuance elsewhere. Higher bond prices mean lower yields, so the mechanism makes sense technically. But this should not be confused with Federal Reserve quantitative easing: Treasury is managing its own debt portfolio rather than creating new money to purchase government bonds.
The problem is scale. The Treasury market is enormous, with more than $32 trillion of debt outstanding, while the government still faces substantial borrowing requirements. Reuters noted that the additional buybacks are tiny relative to the overall market and do not change the underlying deficit. That means Treasury can influence liquidity and positioning at the margin, but it cannot simply buy away persistent supply pressure.
The bond bears are watching the fundamentals, not just Treasury headlines. Investors are demanding more compensation for holding long-duration debt because of concerns around fiscal deficits, inflation, rising debt issuance and uncertainty over future monetary policy. The World Gold Council highlighted the changing balance between Treasury supply and investor demand, including competition for capital from large corporate borrowing tied to AI and data-center investment.
That is why the 10-year yield remains the key macro signal. If Treasury's actions are successful, we should see the 10-year yield stabilize below recent highs and the long end of the curve begin to flatten or at least stop repricing aggressively higher. If yields continue making new highs despite larger buybacks, the market would effectively be saying that fiscal and inflation concerns are stronger than Treasury's intervention.
The 30-year is the higher-risk pressure point. The long bond has been particularly sensitive to fiscal concerns, and its recent move above 5% shows how much additional yield investors are demanding. A sustained move back toward the recent 5.3% area would be a warning that the market remains uncomfortable with duration risk. Conversely, a decisive retreat from that zone would give Treasury's strategy much stronger credibility.
There is also a bigger question about what happens if the strategy works only temporarily. A short-term reduction in yields can provide breathing room for mortgages, corporate borrowing and government interest costs. But if investors ultimately believe deficits, inflation and debt supply are still moving in the wrong direction, yields can simply rise again after the intervention fades. Recent price action has already shown how quickly the relief rally can disappear.
The bullish bond scenario is a stabilization of the long end. If Treasury continues increasing buybacks, liquidity improves, inflation expectations cool and the Federal Reserve provides a less restrictive outlook, long-duration Treasuries could see a stronger recovery. In that environment, the initial Treasury intervention would become the beginning of a broader duration trade rather than a one-day headline reaction.
The bearish scenario is a failed policy signal. If the 10-year pushes decisively above its recent 4.7%–4.75% region while the 30-year returns toward or through its recent 5.3% high, investors would be signaling that the structural supply-demand problem remains dominant. That would keep pressure on long-duration bond prices and could also tighten financial conditions across equities, mortgages and corporate credit.
For TLT, the setup is therefore highly sensitive to yields rather than simply to Treasury headlines. TLT holds long-duration U.S. Treasuries, so falling long-term yields generally support its price while rising yields create pressure. The key confirmation would be sustained weakness in the 10- and 30-year yields, not merely another temporary reaction to a buyback announcement.
My read: Treasury has shown that it has tools, but the market is asking whether those tools are powerful enough to overcome the fundamentals. Bessent can influence liquidity, maturity supply and market psychology, and the nearly $1 trillion TGA gives Treasury meaningful flexibility. But deficits, inflation expectations, debt issuance and investor demand ultimately determine where long-term yields settle. The next major signal will be whether bond bears actually retreat when the larger buybacks begin — or whether they use every Treasury rally as another opportunity to sell duration.
$TLT
repost-content-media
  • Reward
  • Comment
  • Repost
  • Share
#StakeALIGNShare10MTokens
ALIGN is getting attention for more than just a new token listing. Gate has launched the ALIGN Launchpool with a 10,000,000 ALIGN reward pool, putting Aligned directly in front of traders at a time when Zero-Knowledge infrastructure, Ethereum scaling and institutional blockchain adoption are becoming increasingly important market themes. The interesting question is not simply how many tokens can be earned, but whether Aligned can turn that early attention into sustainable ecosystem growth.
Aligned is positioning itself as infrastructure rather than another short-term
ALIGN-10.80%
ETH-1.99%
ZK-2.91%
GT-2.80%
MrFlower_XingChen
#StakeALIGNShare10MTokens
ALIGN is getting attention for more than just a new token listing. Gate has launched the ALIGN Launchpool with a 10,000,000 ALIGN reward pool, putting Aligned directly in front of traders at a time when Zero-Knowledge infrastructure, Ethereum scaling and institutional blockchain adoption are becoming increasingly important market themes. The interesting question is not simply how many tokens can be earned, but whether Aligned can turn that early attention into sustainable ecosystem growth.
Aligned is positioning itself as infrastructure rather than another short-term narrative token. Its focus is on making Ethereum easier for fintech companies, institutions and enterprises to integrate through a unified stack covering areas such as wallets, rollups, interoperability and Zero-Knowledge services. The broader idea is straightforward: instead of every business building complex blockchain infrastructure from scratch, Aligned wants to provide a simpler connection layer that can accelerate deployment.
That positioning matters because ZK technology is moving beyond experimentation. Zero-Knowledge proofs can allow applications to verify information without exposing the underlying data, making the technology relevant to scaling, privacy, identity and institutional applications. If Ethereum-based financial services continue expanding, infrastructure providers that make these systems easier to deploy could capture value from that growth. The challenge is turning the technology narrative into actual users, transactions and recurring demand.
The token launch itself is creating a powerful attention cycle. ALIGN entered the market with a relatively small circulating portion compared with its 10 billion maximum supply, meaning investors need to pay close attention to future unlocks. Early price action can look extremely strong when liquidity is limited, but the same structure can amplify downside volatility when additional tokens enter circulation. This makes supply schedules just as important as headline market capitalization.
Current trading activity is another piece of the puzzle. ALIGN has recently traded around the $0.014–$0.015 area, with daily turnover reaching tens of millions of dollars. That level of activity gives the new token considerably more visibility and liquidity than an illiquid launch, but volume alone does not prove long-term demand. The key signal will be whether trading activity remains healthy after the initial listing and Launchpool excitement fades.
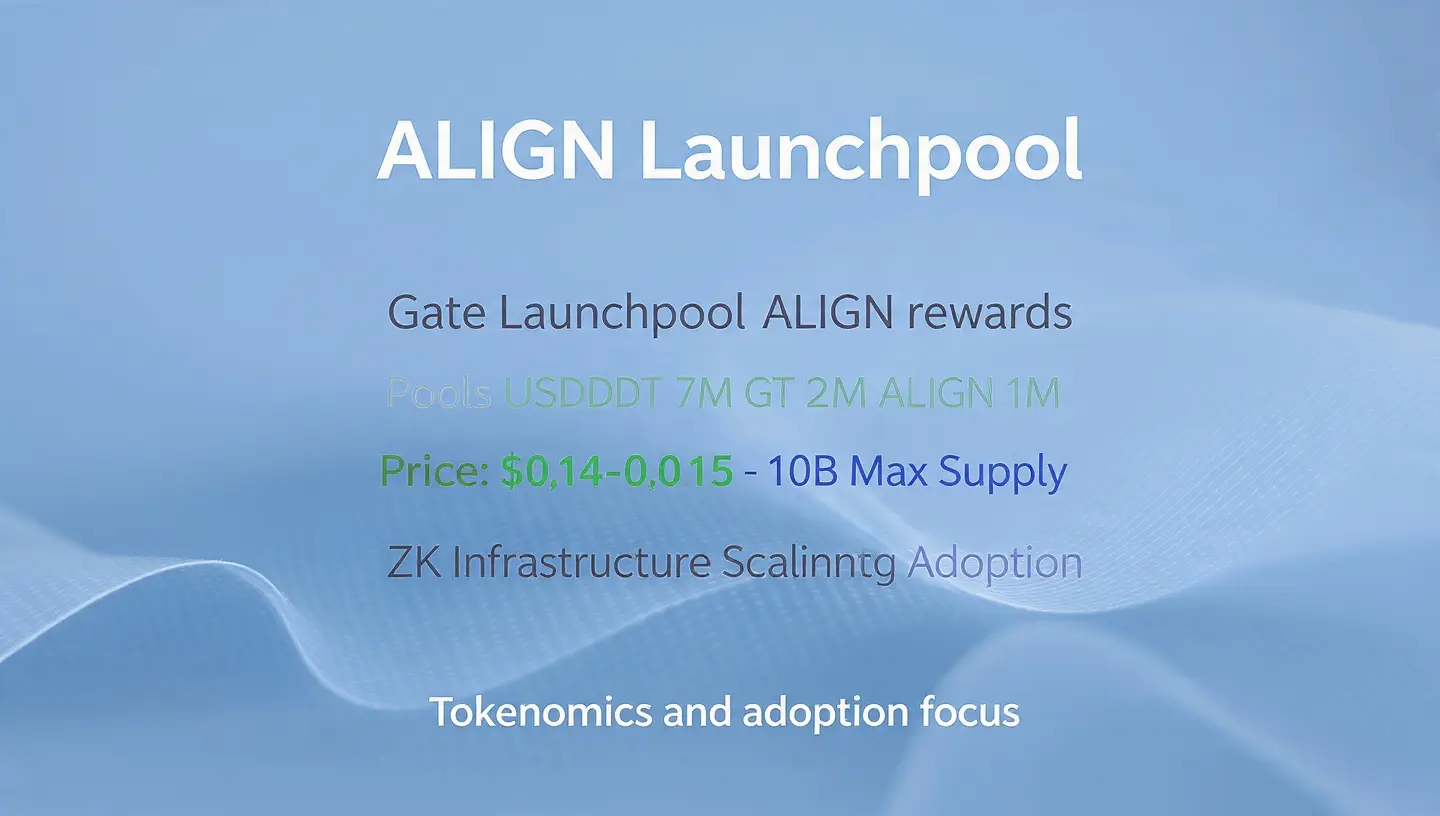
The Gate Launchpool is where the story becomes particularly interesting. The program offers a total of 10 million ALIGN, distributed across three staking pools: 7 million ALIGN for USDT, 2 million for GT and 1 million for ALIGN. That means the USDT pool represents 70% of the total rewards, making it the largest allocation by a wide margin and potentially the most accessible route for participants who do not already hold ALIGN.
The reward structure is designed to distribute tokens over time rather than through a single lottery-style payout. Rewards are calculated periodically according to each participant's eligible stake and pool participation, giving users a clearer mechanism for accumulating ALIGN. The published minimums also make the pools accessible to smaller participants, while individual caps prevent a single account from taking the entire hourly distribution.
But the headline 10 million figure needs context. Reward tokens are not the same thing as guaranteed profit. The economic value of the rewards depends on ALIGN's market price, liquidity and future demand. If the token appreciates, the rewards become more valuable; if the market falls sharply, the dollar value of accumulated tokens can decline just as quickly. The Launchpool changes how participants receive exposure, but it does not remove market risk.
Tokenomics could become the most important factor after the initial hype. With a maximum supply of 10 billion ALIGN and only part of that supply initially circulating, future unlocks can increase available market supply. Investors should watch the timing and size of releases carefully. A strong product story can coexist with short-term selling pressure if circulating supply grows faster than demand.
The bullish case rests on adoption, not just exchange listings. If Aligned attracts meaningful fintech, enterprise and institutional users, expands its Ethereum infrastructure, increases ZK-related activity and successfully develops its aggregation technology, the project could build a stronger fundamental foundation. In that scenario, the current token launch becomes the beginning of an ecosystem growth cycle rather than the peak of initial speculation.
The bearish case is more straightforward. If early trading enthusiasm fades, liquidity declines, token unlocks increase selling pressure or actual ecosystem adoption fails to match expectations, ALIGN could retrace significantly. Newly launched assets can experience large price swings even when the underlying project continues developing. That is why the token's market structure needs to be evaluated separately from the quality of the technology.
There is also a broader market catalyst behind ALIGN. Ethereum scaling, ZK infrastructure, stablecoin payments and institutional blockchain adoption are all attracting capital and developer attention. Aligned sits at the intersection of several of these themes, which gives it a potentially attractive narrative. But being exposed to strong narratives is only the starting point; sustained usage is what eventually separates infrastructure projects from temporary market trends.
For Gate users, the three pools create different risk profiles. The USDT pool provides the largest share of the reward allocation without requiring an existing ALIGN position, while the GT pool connects participation with Gate's ecosystem token. The ALIGN pool is more directly aligned with users who already want exposure to the project and are willing to keep their tokens staked. The right choice depends on the asset already held and the participant's tolerance for ALIGN price volatility.
The most important thing to watch after the Launchpool begins is what happens when incentives meet real demand. If ALIGN maintains healthy spot volume, holds important support levels, attracts new holders and continues announcing meaningful integrations, the reward campaign could help create a stronger community base. If volume collapses immediately after the incentive period, that would suggest much of the early activity was reward-driven rather than organic.
My view is constructive on the project narrative but measured on the token. Aligned has an interesting position in the ZK and Ethereum infrastructure landscape, and Gate's 10 million ALIGN Launchpool gives the project significant early exposure. At the same time, a fresh token with a large future supply and limited trading history deserves careful risk management. The strongest signal will not be the size of the reward pool — it will be whether Aligned can convert technology, incentives and early attention into lasting adoption.
The opportunity is therefore bigger than a simple staking campaign. ALIGN gives the market a way to participate in a developing ZK infrastructure story, while Gate's Launchpool provides a structured mechanism for distributing early token rewards. The next chapter will be decided by three things: real network adoption, sustainable liquidity and disciplined token-supply management. If those three pieces develop together, ALIGN has room to build a much stronger long-term case beyond the excitement of its launch.
@@Gate_Square @GateSquare $ALIGN
repost-content-media
  • Reward
  • Comment
  • Repost
  • Share
#GateStockInsightsChallenge
SNDK is at a critical technical crossroads
SanDisk ($SNDK) is showing exactly why high-momentum semiconductor names can be difficult to trade: the long-term fundamental story remains powerful, but the short-term chart has suddenly become much weaker. The latest completed session closed at $1,493.12, down 6.45%, with 14.03 million shares changing hands. After reaching $1,827.99 on August 17, the stock has given back a large part of that rally. The important question now is not whether SNDK has an AI narrative — it clearly does — but whether buyers can defend the cur
MrFlower_XingChen
#GateStockInsightsChallenge
SNDK is at a critical technical crossroads
SanDisk ($SNDK ) is showing exactly why high-momentum semiconductor names can be difficult to trade: the long-term fundamental story remains powerful, but the short-term chart has suddenly become much weaker. The latest completed session closed at $1,493.12, down 6.45%, with 14.03 million shares changing hands. After reaching $1,827.99 on August 17, the stock has given back a large part of that rally. The important question now is not whether SNDK has an AI narrative — it clearly does — but whether buyers can defend the current correction.
The recent price action is telling us momentum has cooled
The sequence is more important than one red candle. SNDK closed at $1,786.85 on August 17, dropped sharply on August 18, fell another 3.50% on August 19, recovered 2.02% on August 20, and then slipped again on August 21 before the much larger 6.45% decline on August 24. The August 24 range was especially important: price traded from $1,416.56 to $1,517, meaning buyers did respond aggressively from the lows, but they still failed to recover the $1,500 area by the close.
Volume makes the sell-off harder to ignore
The 14.03M shares traded on August 24 were considerably higher than the 7.58M recorded on August 21 and above the 11.46M on August 20. August 19 also produced 16.28M shares during a 3.50% decline. That combination of expanding volume and falling price suggests genuine distribution rather than a completely quiet pullback. At the same time, August's earlier rally also attracted very heavy volume, so this remains a two-sided institutional battle rather than a simple one-way exit.
The first real battleground is $1,400–$1,500
I would treat $1,400–$1,500 as the main decision zone. The August 24 low at $1,416.56 makes the lower boundary especially relevant, while $1,500 is now a psychological level and an important short-term reclaim point. If buyers can defend this area and push back above $1,500, the correction can start forming a base. If sellers repeatedly reject rebounds below $1,500, the market is showing that former buyers are becoming potential supply.
Below $1,400, the chart becomes much more fragile
A clean break below $1,400 would put the recent recovery structure under serious pressure. The next areas I would watch are approximately $1,330–$1,350, followed by the $1,200–$1,250 region. These are not guaranteed reversal points; they are historical reaction areas where price previously found demand during the August recovery. The key difference is whether SNDK reaches those zones and immediately attracts buyers or simply continues making lower highs and lower lows.
Above $1,500, buyers still have several obstacles
A reclaim of $1,500 alone would not completely reverse the bearish short-term structure. The next resistance area sits around $1,570–$1,600, followed by $1,640–$1,680. These levels matter because price spent meaningful time around them before the latest decline. A sustained move above $1,600 would be the first sign that buyers are regaining control; a move through $1,680 would be much stronger confirmation.
The $1,780–$1,830 zone is the major supply test
The August 17 high near $1,828 created the latest major swing point. That entire region is now important overhead supply. If SNDK eventually returns there, I would expect much stronger resistance than at the smaller levels below it. A decisive breakout above $1,830 would be technically significant because it would remove the most obvious lower-high structure from the current correction and put the market back into price-discovery territory.
The derivatives market is amplifying the volatility
SNDK's stock-perpetual market has also been moving aggressively. The available perpetual data shows a sharp 12.03% decline on August 18, followed by a 1.10% recovery on August 19, while volume remained substantial. This confirms that leveraged exposure is adding another layer of volatility around the underlying stock. However, I would not pretend that public data gives us a perfectly accurate liquidation map for every leveraged position. The better approach is to treat the major price zones as potential areas where forced positioning and fresh demand could interact.
The options market is pricing a large move
The options market has also been expecting unusually high volatility. Recent coverage before the August earnings event showed an implied post-earnings move of roughly 13%, which is enormous for a large-cap stock. That does not tell us the direction, but it does confirm that traders are pricing SNDK as a stock capable of moving violently around catalysts. In this environment, a seemingly small change in sentiment can create a much larger technical move.
The fundamental story is still very different from the short-term chart
SanDisk's fiscal Q4 results were strong. The company reported approximately $8.97B in revenue, above the roughly $8.64B consensus cited in recent coverage, while its data-center business has become an increasingly important part of the AI-storage narrative. Recent analysis also highlighted very strong enterprise demand and expanding margins. So the current decline should not automatically be interpreted as a collapse in the underlying business.
But guidance and valuation are the uncomfortable part of the story
The market has already priced an extraordinary amount of future growth into SNDK. That creates a problem: strong results may no longer be enough. Investors increasingly want evidence that AI infrastructure spending, enterprise SSD demand and NAND pricing can justify the enormous valuation. Recent coverage also pointed to weaker-than-expected revenue guidance as one reason the stock struggled after earnings. This is why SNDK can report impressive numbers and still sell off aggressively.
AI-storage demand remains the biggest bullish catalyst
The long-term bull case is still connected to the explosive growth of AI infrastructure. Data centers need increasingly large amounts of storage, and SanDisk is positioning its NAND and enterprise SSD business around that demand. Recent company developments around faster flash technology have strengthened the AI-storage narrative, while analysts have continued to highlight the company's exposure to the structural memory upcycle.
The broader AI market is now the biggest external risk
SNDK is not trading in isolation. The entire AI trade has become more sensitive to valuation and spending concerns, and Nvidia's upcoming earnings are being treated as an important test for the sector. Recent market coverage specifically identified SanDisk, Micron and other AI-related names among stocks under pressure. If the broader semiconductor complex weakens further, SNDK could struggle even if its own company-specific fundamentals remain solid.
Bullish scenario: buyers build a base
My bullish scenario starts with SNDK defending $1,400–$1,500 and reclaiming $1,500 with improving volume. The next confirmation would be a sustained move through $1,600, followed by $1,680. If buyers eventually reclaim $1,780–$1,830, the current correction would look increasingly like a reset rather than a trend reversal. Above $1,830, the market would once again be challenging the broader 2026 high structure.
Bearish scenario: the $1,400 floor breaks
The bearish scenario becomes much more convincing if SNDK loses $1,400 and cannot reclaim it. That would expose approximately $1,330–$1,350, and a further breakdown could bring $1,200–$1,250 back into focus. The important confirmation is not simply touching those levels; it is continued acceptance below them with lower highs and strong selling volume. A fast recovery back above $1,500 would weaken this bearish interpretation.
My overall read
For me, SNDK is currently neutral-to-bearish in the short term but still structurally interesting on the fundamental side. The AI-memory thesis has not disappeared, but momentum has clearly cooled after the stock failed to hold the $1,700–$1,800 region. I would rather see buyers prove themselves around $1,400–$1,500 than assume every dip is automatically a buying opportunity. The cleanest bullish confirmation is above $1,600–$1,680; the key bearish warning is a decisive loss of $1,400.
The levels I would keep on the screen
Support: $1,416 → $1,400 → $1,330–$1,350 → $1,200–$1,250.
Resistance: $1,500 → $1,570–$1,600 → $1,640–$1,680 → $1,780–$1,830.
Bullish confirmation: reclaim $1,600, then break $1,680 with expanding volume.
Bearish confirmation: lose $1,400 and fail to reclaim it.
Major invalidation of the current bearish structure: sustained acceptance above $1,680, followed by a break of $1,830.
SNDK is still one of the most aggressive AI-memory stories in the market, but the chart is asking for proof. The next important move will likely be decided around the $1,400–$1,600 range: hold and reclaim it, and buyers can rebuild the trend; lose it, and the market may need a deeper reset before the next serious recovery attempt.
$SNDK ‌
repost-content-media
  • Reward
  • Comment
  • Repost
  • Share
#CandyDrop1BTCForOldUsers
Gate CandyDrop is LIVE — 1 BTC reward pool for returning users
Gate has opened a new CandyDrop campaign, giving eligible returning users an opportunity to participate in a shared 1 BTC reward pool. What makes this campaign interesting is the low trading threshold: you don’t need to reach a huge futures volume target. The basic requirement is to complete at least 1 USDT in futures trading volume, with both opening and closing transactions contributing to the volume.
⏰ Campaign period
The CandyDrop campaign runs from August 25, 2026 at 10:00 UTC until September 8, 2026
BTC-2.27%
MrFlower_XingChen
#CandyDrop1BTCForOldUsers
Gate CandyDrop is LIVE — 1 BTC reward pool for returning users
Gate has opened a new CandyDrop campaign, giving eligible returning users an opportunity to participate in a shared 1 BTC reward pool. What makes this campaign interesting is the low trading threshold: you don’t need to reach a huge futures volume target. The basic requirement is to complete at least 1 USDT in futures trading volume, with both opening and closing transactions contributing to the volume.
⏰ Campaign period
The CandyDrop campaign runs from August 25, 2026 at 10:00 UTC until September 8, 2026 at 10:00 UTC. This means eligible users have a defined window to complete the required activity and claim their Candy. Make sure your trading activity takes place within the campaign period rather than assuming trades outside the window will count.
👤 Who can participate?
This promotion is specifically for returning Gate users. Your account must have been registered before August 24, 2026 at 16:00 UTC to meet the stated eligibility requirement. If your account was created after that cutoff, you should not assume that completing the trading requirement will make you eligible.
📊 What do you actually need to do?
The requirement is straightforward: complete at least 1 USDT of futures trading volume on any token. The campaign specifies that both opening and closing volume count toward the requirement. So the important point is to understand that the qualifying volume is based on your futures trading activity, not simply depositing funds or holding a futures position.
For example, if a position has 1 USDT of opening volume and 1 USDT of closing volume, the combined trading volume would be approximately 2 USDT. Always check the campaign page for the exact calculation and eligibility status before trading.
🍬 Don’t forget to claim
Completing the trading requirement does not mean you should forget about the campaign page. After meeting the conditions, return to the CandyDrop event page and check your eligibility/claim status. Follow the instructions shown there to claim any Candy available to you.
💡 Why this campaign stands out
The headline feature is the 1 BTC reward pool combined with a very low minimum futures-volume requirement. For eligible returning users who already understand futures trading, the campaign is relatively simple to follow: check eligibility, complete the required qualifying activity during the campaign window, and claim the reward through the event page.
⚠️ One important reminder
The low 1 USDT threshold does NOT make futures trading risk-free. Futures involve price volatility and can result in losses, especially when leverage is used. Don’t increase your position size, use unnecessary leverage, or take a trade you otherwise wouldn’t take just to chase a campaign reward. The smartest approach is to understand the rules first and keep your trading risk under control.
📌 Campaign details at a glance
Reward pool: 1 BTC
Requirement: ≥ 1 USDT futures trading volume
Volume calculation: Opening + closing volume
Campaign starts: August 25, 2026, 10:00 UTC
Campaign ends: September 8, 2026, 10:00 UTC
Eligibility cutoff: Registered before August 24, 2026, 16:00 UTC
Target users: Eligible returning Gate users
If you’re an eligible Gate user, this is a campaign worth checking before the deadline. Read the official rules carefully, complete only the required activity, and remember to claim through the CandyDrop page.
Join the campaign here:
https://www.gate.com/candy-drop/detail/BTC-355
#Gate #CandyDrop
@Gate_Square
repost-content-media
  • Reward
  • Comment
  • Repost
  • Share
#NVDA
#GateStockInsightsChallenge
NVDA: The Earnings Setup Is Now More Important Than the Seven-Day Slide
NVIDIA is sitting around $213, after rebounding sharply from Monday’s close near $208.48. Today’s session has already traded above $214, showing that buyers are willing to defend the lower-$210 area ahead of earnings. The bigger technical issue is that this bounce comes after seven consecutive declining sessions, so I would treat today’s strength as a recovery attempt rather than automatically calling it a new uptrend.
Short-term price structure
The immediate structure is trying to trans
NVDA2.15%
MrFlower_XingChen
#NVDA
#GateStockInsightsChallenge
NVDA: The Earnings Setup Is Now More Important Than the Seven-Day Slide
NVIDIA is sitting around $213, after rebounding sharply from Monday’s close near $208.48. Today’s session has already traded above $214, showing that buyers are willing to defend the lower-$210 area ahead of earnings. The bigger technical issue is that this bounce comes after seven consecutive declining sessions, so I would treat today’s strength as a recovery attempt rather than automatically calling it a new uptrend.
Short-term price structure
The immediate structure is trying to transition from distribution back into recovery. The first hurdle is the $215–$218 zone, where recent price action and pivot levels create overhead supply. A clean reclaim and hold above that area would improve the short-term structure. Below, $210 is the first psychological and intraday defense, while the larger accumulated-volume support is around $208. If that area fails decisively, the chart becomes much more vulnerable toward the low-$200s.
7-day momentum
The recent seven-session decline matters because it shows that traders were reducing exposure before the earnings catalyst rather than simply buying every dip. At the same time, Tuesday’s roughly 2.6% recovery suggests that sellers are not completely in control. This creates a very specific setup: NVDA needs follow-through above resistance to prove that the decline was exhaustion rather than the beginning of a deeper repricing.
Volume and liquidity
Today’s volume is already substantial, with more than 31 million shares changing hands by the latest reported intraday update. That makes the $210–$215 region particularly important because a high-volume reclaim there would carry more information than a low-volume bounce. On the downside, liquidity is likely to concentrate around obvious psychological levels such as $210, $205 and $200; on the upside, traders will naturally watch $215, $220 and $225 as successive areas where profit-taking or fresh positioning can appear.
Options positioning
The derivatives market is signaling that Wednesday’s earnings report can completely change the chart. Current options pricing implies roughly a 5.4% move in either direction after earnings, which translates into a very large potential market-cap swing of about $280 billion. Open interest across NVDA options is also elevated, with total open interest recently reported around 15 million contracts. This means the post-earnings move could be amplified as dealers and traders adjust hedges around rapidly changing implied volatility.
What the options market is really saying
The important point is not simply “options expect volatility.” The market is pricing a meaningful move while simultaneously showing less expected volatility than before Nvidia’s May earnings. That suggests investors have become somewhat more confident in the predictability of Nvidia’s results, but expectations remain extremely high. A strong earnings number alone may therefore not be enough; the market will care about whether revenue, margins, AI demand and forward guidance are strong enough to justify the current valuation.
Institutional and smart-money context
NVDA remains one of the most institutionally important names in the entire AI trade, but public data does not provide a clean real-time “whale flow” number that can reliably identify every large institutional buyer or seller. What we can see is the broader positioning: Nvidia remains central to institutional AI exposure, while analysts and investors are debating whether its growth trajectory can continue to justify premium expectations. One bullish analyst recently argued that the market is underestimating Nvidia’s longer-term AI infrastructure position and placed a $350 target on the stock, although that is an individual analyst view rather than a certainty.
Fundamental catalyst: earnings
The biggest catalyst is no longer a technical indicator. Nvidia is scheduled to report fiscal Q2 results after the market close on August 26. The market is looking beyond the headline EPS number toward AI accelerator demand, data-center growth, gross margins, supply availability and management’s forward guidance. Nvidia’s previous fiscal-year results already showed the scale of the business, with FY2026 revenue reaching $215.9 billion, up 65% year over year, so the market is now demanding continued exceptional growth rather than merely good results.
AI infrastructure remains the core bullish catalyst
The longer-term bull case is still built around Nvidia’s dominant position in accelerated computing and the enormous capital spending cycle around AI infrastructure. Recent partnerships and financing initiatives connected to AI infrastructure are reinforcing the narrative that demand remains broad. The key question is whether Nvidia’s upcoming guidance confirms that hyperscalers and other customers are still increasing spending at a pace capable of supporting the company’s valuation.
Macro pressure cannot be ignored
NVDA is also trading inside a difficult macro backdrop. Rising Treasury yields have recently pressured high-valuation growth stocks, while concerns about AI-related borrowing and the sustainability of huge technology capital expenditures have increased volatility across the Nasdaq and semiconductor sector. On Monday, the Nasdaq fell about 0.8%, while Nvidia dropped 2.9%; Tuesday’s recovery therefore needs to be viewed partly as a rebound in the broader technology complex rather than an isolated Nvidia signal.
Bullish scenario
The bullish setup becomes much more convincing if NVDA can reclaim $215–$218, hold above that area, and then attack $220 with strong volume. A sustained move through $220 would put $225 into focus, while a powerful post-earnings breakout could open the way toward the next higher resistance zones. The real confirmation would come from earnings and guidance beating not only consensus numbers but also the market’s already elevated expectations.
Bearish scenario
The bearish setup activates if the recovery loses $210 and especially if NVDA breaks the $208 area with expanding selling volume. That would suggest Tuesday’s rebound was mainly short covering or pre-earnings positioning rather than genuine trend reversal. Below $208, the psychologically important $200 level becomes the obvious major downside reference. A decisive loss of $200 would materially weaken the medium-term structure.
Key invalidation levels
For the bullish case, repeated rejection around $215–$218 followed by a loss of $208 would invalidate the immediate recovery thesis. For the bearish case, a decisive reclaim of $220 followed by sustained trading above it would make continued downside much harder to defend. Because earnings are only one session away, these levels should be treated as structure markers rather than guaranteed support or resistance.
My read on the next move
NVDA is currently sitting in a high-volatility decision zone, not a clean low-risk trend setup. The seven-day decline has created downside pressure, but Tuesday’s recovery shows buyers are still active. The market now has two competing forces: technically, buyers want to repair the broken short-term structure; fundamentally, investors are waiting for Nvidia to prove that AI demand and future growth can keep exceeding already aggressive expectations. The cleanest signal will come from the combination of $215–$220 price acceptance and the quality of earnings guidance, not from one isolated intraday candle.
Bottom line
I would frame NVDA as neutral-to-cautiously bullish above $210, bullish on a confirmed $220 reclaim, and materially weaker below $208. The earnings event can overwhelm every normal technical level, with options pricing currently implying roughly a 5.4% post-earnings move. That makes patience more valuable than prediction here: the strongest setup is the one confirmed by price, volume and guidance after the market receives the information it is currently waiting for.
$NVDA
repost-content-media
  • Reward
  • Comment
  • Repost
  • Share
#XAU
XAU/USD: Gold Is Testing the $4,700 Wall After a Powerful August Rally
Gold is trading around $4,622/oz after briefly reaching a fresh three-month high near the psychologically important $4,700 area. Tuesday’s pullback of roughly 0.6% looks more like profit-taking after an aggressive rally than a confirmed trend reversal. The bigger picture remains constructive, with gold having climbed sharply over the past several sessions and futures gaining about 6.3% across the four sessions through Monday.
The current structure is bullish, but stretched. Price has moved rapidly from the lower-$4,00
XAU-0.30%
MrFlower_XingChen
#XAU
XAU/USD: Gold Is Testing the $4,700 Wall After a Powerful August Rally
Gold is trading around $4,622/oz after briefly reaching a fresh three-month high near the psychologically important $4,700 area. Tuesday’s pullback of roughly 0.6% looks more like profit-taking after an aggressive rally than a confirmed trend reversal. The bigger picture remains constructive, with gold having climbed sharply over the past several sessions and futures gaining about 6.3% across the four sessions through Monday.
The current structure is bullish, but stretched. Price has moved rapidly from the lower-$4,000s toward $4,700, creating a strong sequence of higher highs and higher lows. The problem for buyers is that momentum has reached a major psychological barrier. A clean daily acceptance above $4,700 would strengthen the breakout structure, while repeated rejection around that level would increase the probability of consolidation before another attempt higher.
The first major resistance is $4,700. This level is attracting attention because it is both a psychological number and the area where Tuesday’s rally started losing momentum. Above it, $4,770–$4,800 becomes the next important supply region. A sustained move through that zone would be much more significant than a brief intraday spike because it would show that buyers are absorbing the existing overhead supply.
Support is becoming more important after the recent vertical move. The immediate area to watch is roughly $4,600–$4,620, followed by $4,520–$4,550. The 200-day moving average has been identified around $4,519, making that region a particularly important structural reference. A deeper correction toward $4,410 would still leave the broader recovery intact, but it would signal that the current momentum phase has cooled substantially.
Liquidity is concentrated around obvious round numbers. Gold does not trade through one centralized spot exchange, so there is no single authoritative XAU/USD liquidation map comparable to a crypto perpetual-futures order book. Instead, the practical liquidity zones are the heavily watched levels around $4,700, $4,750, $4,800 on the upside and $4,600, $4,500 and $4,400 underneath. These are areas where stops, options hedges and discretionary orders can create sharper reactions.
The recent volume story is more important than one isolated candle. Gold’s latest rally has attracted renewed institutional interest, with one recent report estimating nearly 47 tonnes of gold-backed ETF inflows in a week, worth roughly $6.4 billion. That suggests the move is not being driven purely by short-term retail speculation. Strong investment flows provide a more durable foundation for the rally, although they do not guarantee that price will immediately break $4,700.
Institutional positioning is another bullish piece of the puzzle. Central-bank demand, renewed ETF buying and concerns surrounding U.S. fiscal sustainability are helping gold retain demand even while Treasury yields remain relatively elevated. This is important because gold normally faces stronger headwinds when real yields rise. The fact that buyers are still defending elevated prices shows that the safe-haven and currency-debasement narratives are currently competing effectively with the yield disadvantage.
The dollar and Treasury yields remain the main short-term counterweight. Tuesday’s pullback was partly associated with a firmer dollar and higher yields. If yields continue rising while the dollar strengthens, gold could struggle to hold the $4,600 area. Conversely, renewed dollar weakness or falling real yields would remove one of the biggest obstacles facing the metal and could give buyers another opportunity to attack $4,700.
The next macro catalyst is U.S. inflation. Markets are waiting for the July PCE inflation report, the Federal Reserve’s preferred inflation gauge. The data matters because softer inflation could reduce pressure for restrictive monetary policy, improving the relative appeal of a non-yielding asset such as gold. A hotter-than-expected inflation reading could produce the opposite reaction through higher yields and a stronger dollar.
Jackson Hole adds another layer of uncertainty. Investors are also preparing for Fed Chair Kevin Warsh’s remarks at the Jackson Hole symposium on Friday. Any signal suggesting less restrictive future policy could support gold, while unexpectedly hawkish guidance could trigger another test of the lower support zones. That makes the next few sessions particularly sensitive to macro headlines rather than purely technical signals.
Geopolitical risk is still providing a floor. Renewed U.S. sanctions involving Iran and the resulting uncertainty around regional tensions are adding a safe-haven premium to precious metals. This does not mean every geopolitical headline automatically sends gold higher, but persistent uncertainty can keep demand elevated during periods when investors are reducing exposure to riskier assets.
The bullish scenario is straightforward. If XAU/USD stabilizes above $4,600 and buyers reclaim $4,700 with sustained momentum, the next area to monitor is $4,770–$4,800. A convincing daily close above $4,800 would strengthen the case for another expansion higher. The important confirmation is acceptance above resistance rather than a temporary wick through it.
The bearish scenario begins with rejection. If gold repeatedly fails around $4,700 and then loses $4,600, the market could enter a deeper profit-taking phase. The next structural test would be around $4,520–$4,550, with $4,500 becoming the key psychological boundary. A sustained break below $4,500 would materially weaken the current bullish structure and shift attention toward the $4,410 region.
My read is bullish on structure but cautious on chasing strength. Gold has strong momentum, improving investment demand, supportive geopolitical conditions and a macro environment where concerns about fiscal sustainability and the dollar remain important. But the market has already traveled a long distance in a short period, and $4,700 is proving that buyers still have work to do. The healthier bullish setup would be consolidation above $4,600 followed by a confirmed break of $4,700 rather than an uncontrolled vertical extension.
Bottom line: XAU/USD remains structurally bullish while holding above $4,500, with $4,600 acting as the near-term line between consolidation and deeper correction. $4,700 is the major breakout trigger, while $4,770–$4,800 is the next significant resistance band. The biggest variables now are PCE inflation, Treasury yields, the dollar and Friday’s Jackson Hole messaging. Gold does not need another explosive candle immediately; holding the recent gains while buyers build enough liquidity to challenge $4,700 could actually produce the cleaner next move.
#GateStockInsightsChallenge
$XAU
repost-content-media
  • Reward
  • Comment
  • Repost
  • Share
#SNDK
SNDK is showing exactly why this stock cannot be analyzed from one green candle. After dropping about 6.45% on August 24, Sandisk rebounded roughly 3% on Tuesday as semiconductor sentiment improved and Treasury yields eased. The recovery matters, but it has not yet repaired the short-term damage.
The immediate price structure is a battle between recovery and overhead supply. The key area is around $1,500. Holding this psychological level keeps the rebound alive, while a sustained break below it would put the recent intraday low near $1,488 back into focus. On the upside, the $1,550–$1,5
SNDK-0.77%
MU2.46%
MrFlower_XingChen
#SNDK
SNDK is showing exactly why this stock cannot be analyzed from one green candle. After dropping about 6.45% on August 24, Sandisk rebounded roughly 3% on Tuesday as semiconductor sentiment improved and Treasury yields eased. The recovery matters, but it has not yet repaired the short-term damage.
The immediate price structure is a battle between recovery and overhead supply. The key area is around $1,500. Holding this psychological level keeps the rebound alive, while a sustained break below it would put the recent intraday low near $1,488 back into focus. On the upside, the $1,550–$1,565 region is the first major test because Tuesday's rally reached that area but has not yet produced a decisive breakout.
Volume and volatility make the levels more important than usual. SNDK has been moving in unusually large percentage swings, meaning intraday spikes can easily create false breakouts. I would treat $1,488–$1,500 as the first downside liquidity pocket and $1,550–$1,565 as the first major upside supply zone. A breakout becomes more convincing when price holds the level after the initial move instead of immediately giving it back.
The broader semiconductor tape is currently helping SNDK. Tuesday's Nasdaq recovery and falling Treasury yields created a better environment for growth and semiconductor stocks, while SNDK and Micron both participated in the rebound. But this is still a fragile improvement because the AI trade has recently faced concerns over valuations and the sustainability of massive infrastructure spending.
The fundamental numbers are much stronger than the recent price action suggests. Sandisk finished fiscal 2026 with $20.25 billion of revenue, up 175% year over year, while Q4 revenue reached $8.97 billion, up 51% sequentially. The most striking number is data-center revenue: $5.15 billion for FY2026, up 437% year over year. That makes AI infrastructure and high-capacity storage one of the central drivers behind the current valuation story.
The margin expansion is another major part of the story. Q4 non-GAAP gross margin reached 84.6%, compared with 78.4% in the previous quarter, while non-GAAP EPS climbed to $39.25 from $23.41. This tells me the bullish thesis is not based solely on revenue growth; pricing power and operating leverage have become equally important parts of the SNDK story.
Management's next-quarter guidance keeps expectations extremely high. Sandisk guided fiscal Q1 2027 revenue to $10.3–$10.8 billion, with non-GAAP EPS of $44–$46 and gross margin around 83–85%. The market therefore needs continued execution. Strong numbers that merely meet expectations may not create the same upside reaction as a meaningful beat combined with stronger forward commentary.
The buyback provides another fundamental support factor. Sandisk's board approved an additional $14 billion share-repurchase authorization, leaving total remaining authorization at about $15.5 billion. Buybacks do not automatically create a floor under the stock, but at the fundamental level they provide management with another way to return capital while signaling confidence in future cash generation.
The biggest risk is that expectations have moved faster than fundamentals can comfortably support. SNDK has already experienced enormous upside and equally violent corrections. Investors are now pricing in continued memory tightness, strong AI demand and elevated profitability. If NAND pricing weakens, customer spending slows, or margins normalize faster than expected, the same expectations that powered the rally can become a source of downside pressure.
The AI connection remains the strongest long-term catalyst. Data-center revenue more than quadrupled year over year, and management has positioned the data-center business as a key growth pillar. That gives SNDK direct exposure to the expanding storage requirements of AI infrastructure. The important question is not whether AI requires more storage—it clearly does—but how much of that future demand is already reflected in the stock price.
The derivatives picture adds another layer of risk. SNDK has attracted substantial options and stock-perpetual activity, so positioning can amplify moves in either direction. For a stock with this level of volatility, a price move through a major strike or liquidity area can accelerate as traders adjust hedges. I would therefore avoid interpreting a single sharp candle as proof of institutional accumulation or distribution without corroborating volume and price acceptance.
The bullish scenario needs a real breakout, not another bounce. If SNDK holds above $1,500, pushes through $1,550–$1,565, and then converts that zone into support, the recovery structure becomes considerably stronger. A confirmed move above $1,565 would put $1,600 into focus, with higher resistance becoming relevant if momentum continues. The strongest confirmation would be expanding volume plus continued strength across the semiconductor group.
The bearish scenario starts with rejection from resistance. If buyers fail around $1,550–$1,565 and price falls back through $1,500, the market could retest $1,488. A decisive break below that low would weaken the recovery and expose the $1,450 area. If $1,450 also fails, the market would need to reassess whether the recent decline is simply consolidation or the beginning of a much deeper valuation reset.
The cleanest invalidation levels are simple. For the short-term bullish thesis, losing $1,488 with strong selling pressure would be a meaningful warning. For the bearish thesis, a sustained reclaim of $1,565, followed by acceptance above $1,600, would make continued immediate downside much less convincing. Between those boundaries, SNDK remains a high-volatility range rather than a confirmed directional trend.
My read: fundamentally strong, technically unfinished. The business is producing exceptional growth, data-center revenue is accelerating, margins are expanding and management has provided aggressive forward guidance. But the stock's recent price action shows that investors are still debating how much of that future growth is already priced in. That is why the next confirmation should come from price acceptance and volume, not from headlines alone.
Bottom line: SNDK is sitting at a high-stakes technical zone. $1,500 is the immediate psychological pivot, $1,488 is the key downside defense, and $1,550–$1,565 is the first major breakout barrier. Above $1,565, the recovery gains credibility and $1,600 becomes the next psychological test. Below $1,488, the structure deteriorates and $1,450 becomes the next area to watch. The fundamental story remains powerful, but with expectations this elevated, the market will reward better-than-expected execution, not simply good numbers.
$SNDK #GateStockInsightsChallenge
repost-content-media
  • Reward
  • Comment
  • Repost
  • Share
  • Pinned