
Share your thoughts
placeholder
Article
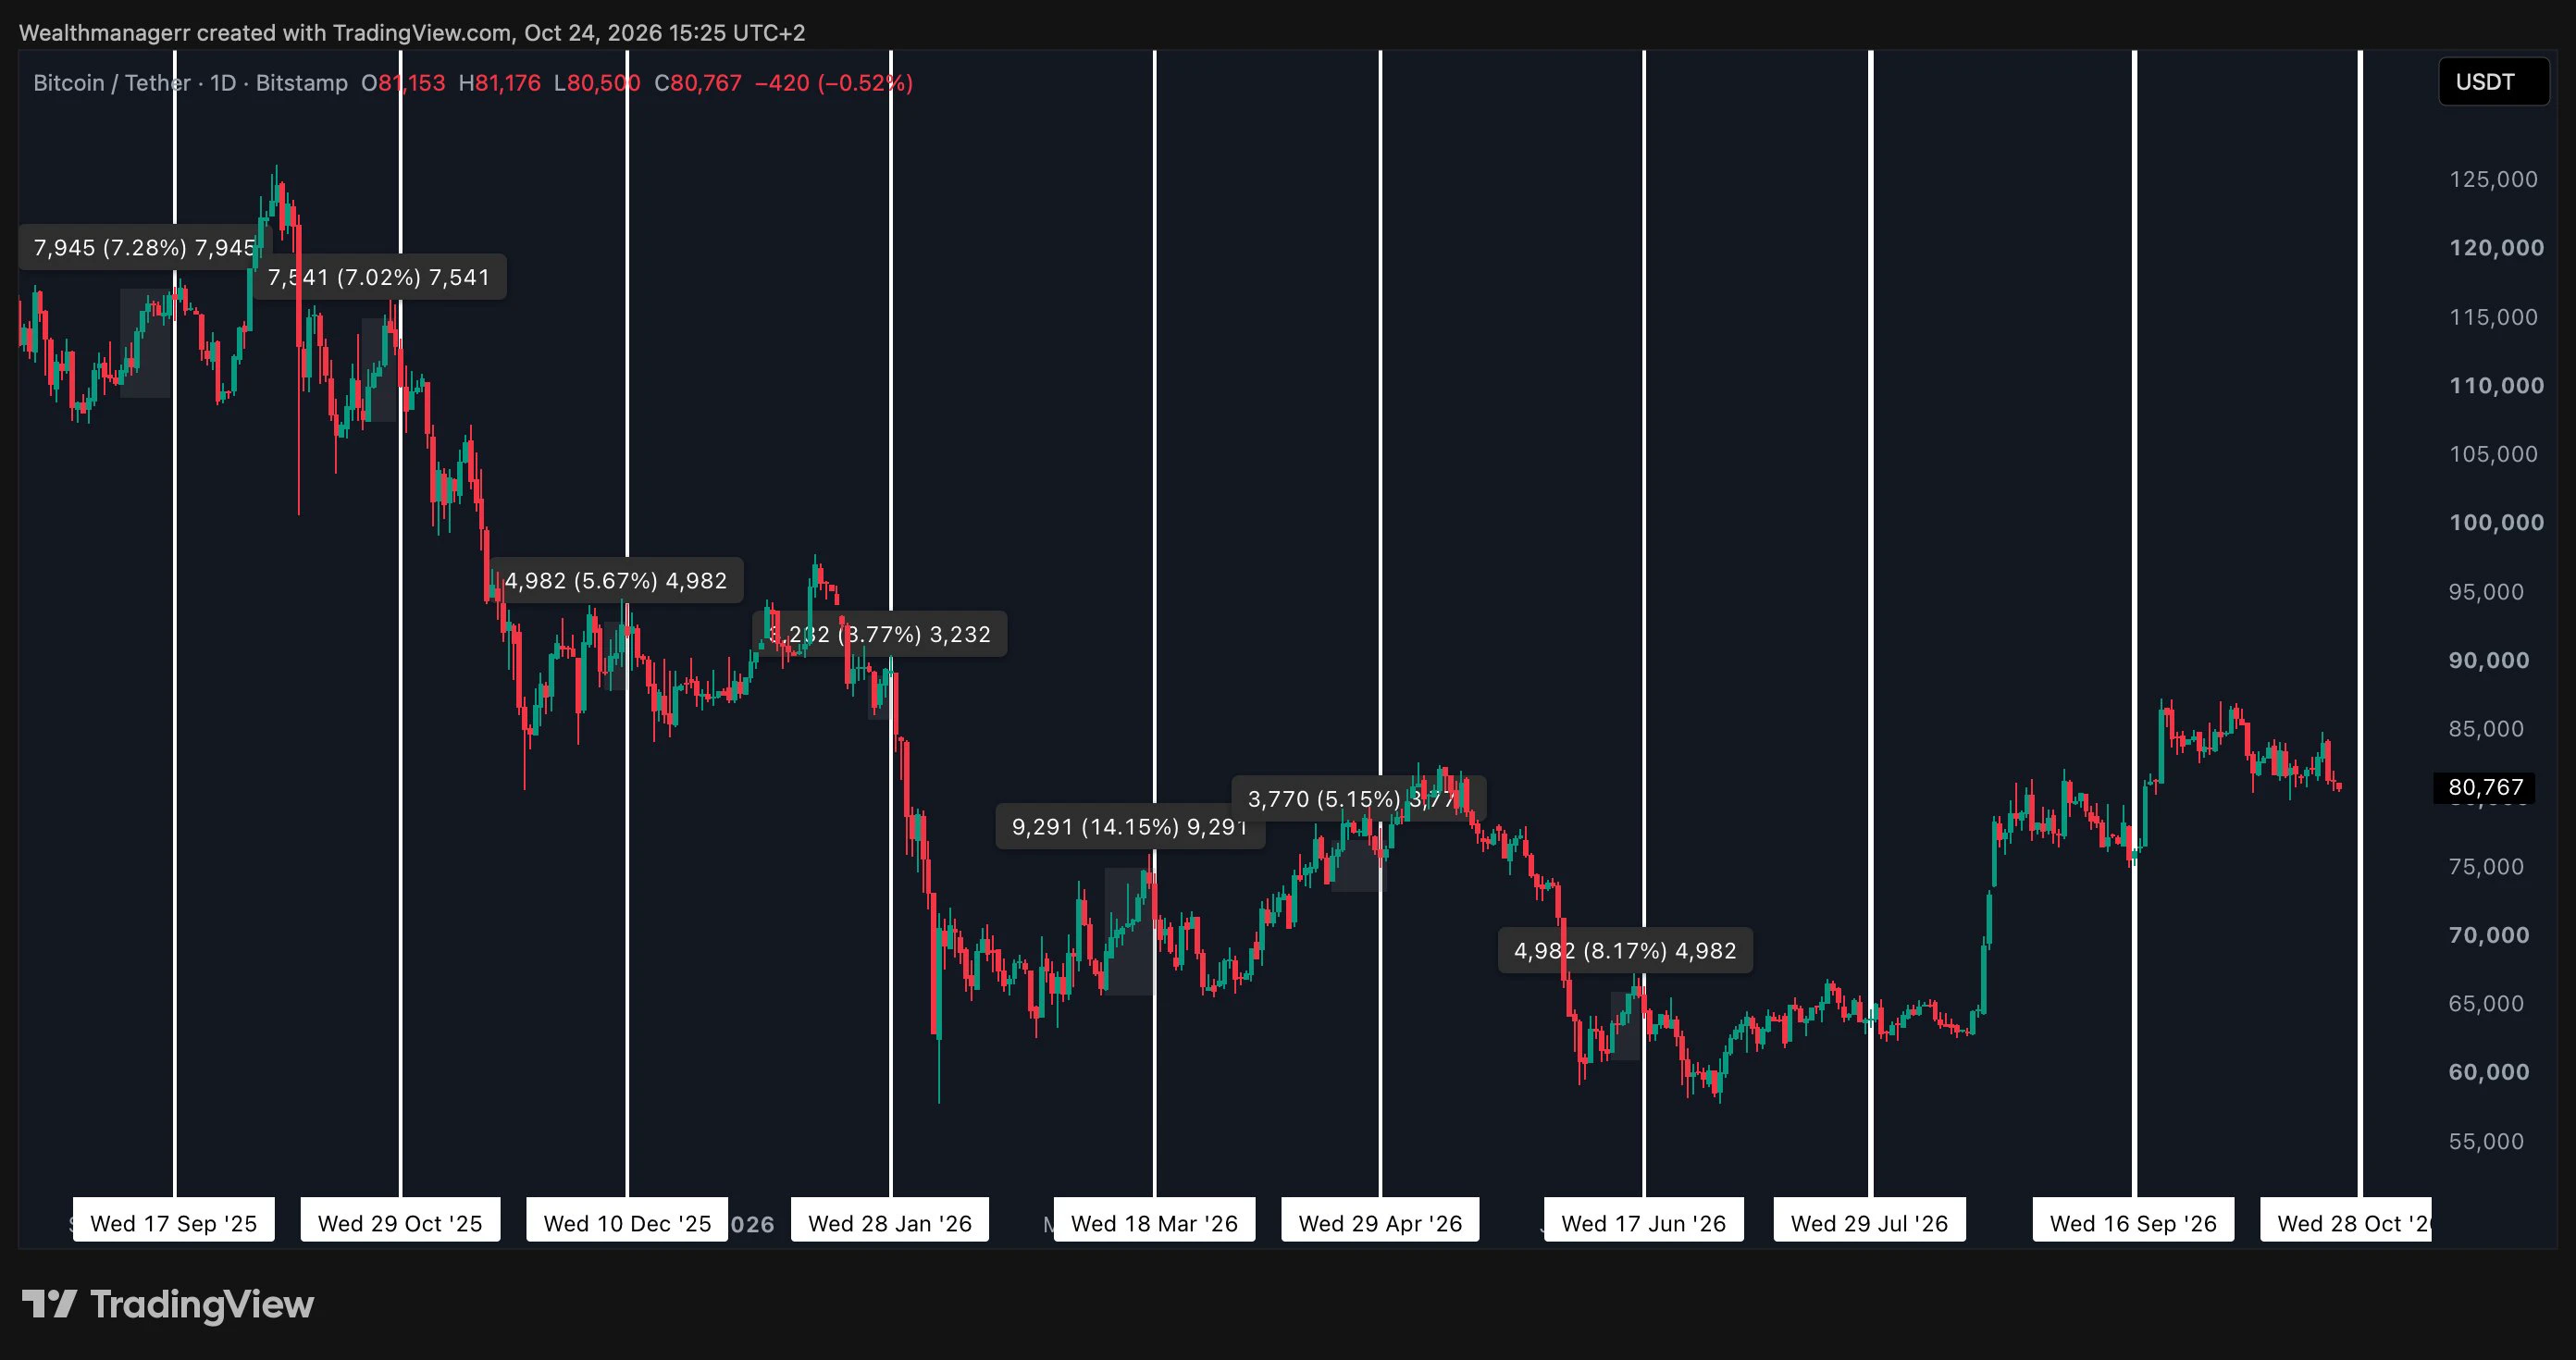
The 2026 Bitcoin market is expected to remain volatile, with a retreat to the 75000 level being the highest-probability scenario; a rise to 85000 during the year has strong consensus; breaking through 90000 will be somewhat difficult, making it a neutral-to-optimistic scenario.
post-image
BTC-1.93%
2026‑09‑05 ETH‑USDT Perpetual Contract Technical Analysis
The market conditions are for technical analysis only and do not constitute trading advice. Contract trading carries extremely high risk.
Key Levels
Resistance
First resistance: 2510‑2540
Strong resistance: 2570‑2600 (previous high, concentrated selling pressure zone)
Support
First support: 2400‑2420 (short-term bull-bear dividing line)
Strong support: 2330‑2360
Market Conditions
The medium- to long-term bullish structure on the daily chart remains intact. After the surge, the market has entered a high-level consolidation phase. The MAC
post-image
ETH-2.31%
#SNDK##闪迪# Continuing the rebound from July 29, Figure 2 shares my view. [Major company change: On September 5, Sandisk announced it would join the S&P 100 Index, effective September 22. This is expected to bring $3 billion in buying to Sandisk.] $SNDK
SNDK+11.78%
A few days ago, my hand trembled as I set the stop-loss, only to realize this morning that the filial piety was unnecessary. The last thing I saw before bed was $MSTRX consolidating around 129.26, but funds were already quietly moving in and volume was gradually building. I judged this to be the calm before the launch and directly placed a long order. Looking again now, the price has reached 141.8, and my account return is +466.41%. I caught the rhythm of this move—the long period of grinding beforehand has finally paid off. Staying out of the market is not a sin; opening positions recklessly
post-image
MSTRX-1.18%
SOL-1.97%
XRP-3.67%
$PONS continues to break out. The next post explains why there is still at least 3x upside and what the underlying principle is…
post-image
PONS+0.88%
Everyone’s staring at the 4h chart, but the 15m RSI just whispered a secret about $BTC /USDT that no one’s ready for.

$BTC /USDT - SHORT

Trade Plan:
Entry: 79443.1 – 79634.5
SL: 80457.6
TP1: 78849.7
TP2: 78390.3
TP3: 77701.1

Why this setup?
- Price is pinned at 79,538.8, but the 1D trend says “range” – that’s a trap for bulls.
- RSI (15m) at 43.97 is weak, not oversold – momentum is fading, not flipping.
- ATR (1h) at 382 means volatility is thin; the real move comes when 79,034 breaks.
- Why now? The short setup is “Armed” – entry zone 79,443–79,634, with TP1 at 78,849. If we lose
BTC-1.87%
UPDATE: Tokenized equities are no longer just a narrative.
$HOOD , $BNB and $SOL are emerging as key rails for onchain equity markets, with weekly spot volume reaching $3B and tokenized-stock TVL crossing $110M, according to Grayscale.
The chart says it clearly: adoption is accelerating.
TradFi is moving onchain. The bigger question is how far this market can scale.
#Gate60MillionUsers #BTCReclaims80K #HYPEBreaks88HitsNewAllTimeHigh #GateEventContractTradeSharingChallenge #GateTops7DayNetInflowsGlobally
post-image
HOOD-4.09%
BNB-0.61%
SOL-2.01%
  • 4
  • 1
This Zcash is really something—chasing ZEC at 950 and still making a profit is pretty impressive. The shorts are almost stripped down to their underwear, huh?😁
ZEC+7.33%
  • 7
JUST IN: OpenAI fully rolls out GPT-6 Astra to Plus, Pro, and Business via ChatGPT Work and Codex after a phased start. If sustained, broader access could accelerate AI tooling adoption and usage across sectors. $AI (no explicit ticker as not relevant)
post-image
Everyone’s staring at the 15m RSI bounce on $H /USDT—but that’s the exact trap I’d avoid.

$H /USDT - SHORT

Trade Plan:
Entry: 0.08131 – 0.08203
SL: 0.08515
TP1: 0.07906
TP2: 0.07733
TP3: 0.07472

Why this setup?
- 1D trend is **bearish**, and the 4h MTF confirms a 95% short confidence—not a guess.
- The 15m RSI at 54.51 is a weak retrace, not a reversal; price is hugging the entry ref (0.08167) with tight ATR (0.001448).
- Why now? TP1 at 0.07906 is a 3.2% drop from entry—if we lose 0.07944 (invalid), the short thesis dies. But until then, gravity wins.

Debate:
Are you fading this 1
H+4.85%
Want to buy a dog? Buy Nvidia first.
That’s the idea behind the latest “Crypto-Stock Meme” trend gaining attention around Robinhood Chain.
The model connects tokenized U.S. stocks such as $NVDA with crypto assets and meme-style trading, creating a new bridge between traditional markets and on-chain speculation.
The bigger story is the liquidity.
In just two months, the model has reportedly generated hundreds of millions of dollars in additional trading activity and locked value. But there’s an important problem: U.S. stock markets close on weekends while crypto markets trade 24/7.
That creates
post-image
NVDA+0.87%
  • 8
This trend is so clear I don't even need to think—the account is partying on its own.

During the repeated intraday swings, $SKHYNIX was being shaken back and forth within a small range, testing most people's patience. But I noticed one detail: every dip was quietly met with buying, while the lows kept getting higher. This isn't an unwanted token—it's building up strength.

Once the move was confirmed to be stable, the entry was at 1235.91. Now, it's already reached 1289.19, and the return comes to +308.46%. What a relief. The first half was so grinding it made people sleepy, but the second
post-image
SKHYNIX+4.60%
DOGE-2.86%
ADA-5.72%
Bull-Bear Divide Deepens Around $82K! B.TOP Founder Sells All His BTC and Waits to Buy Back at $70K.
live-cover
LIVE1,338
Everyone’s watching Bitcoin—but XLM just printed a fake breakout that nobody’s talking about yet.

$XLM /USDT - SHORT

Trade Plan:
Entry: 0.18026 – 0.18102
SL: 0.18430
TP1: 0.17789
TP2: 0.17606
TP3: 0.17332

Why this setup?
- 4H bias is SHORT with 55% confidence, yet price is stuck at 0.18064—right inside a tight range between 0.18102 and 0.18026.
- RSI on 15m is 58.43—not overbought, but not weak either. That’s the trap: momentum looks fine while the daily trend says “range.”
- ATR on 1h is only 0.001526—volatility is compressed. When that happens inside a range, the next move is usual
XLM-1.24%
$USELESS is going to 0.1-something today.
post-image
USELESS-0.82%
[New Streamer] Market Prediction
live-cover
LIVE1,053
Everyone’s long LTC while the 4h quietly flips—are you holding the wrong side of LTC?

$LTC /USDT - SHORT

Trade Plan:
Entry: 52.17 – 52.41
SL: 53.73
TP1: 51.21
TP2: 50.49
TP3: 49.41

Why this setup?
- RSI on 15m is screaming at 70.47—overheated, mean-reversion fuel for a SHORT.
- 1D trend is range, but our 4h bias says fade the pump, not chase it.
- Entry zone 52.29 with TP1 at 51.21—that’s a 2% drop before the daily open even blinks.
- Why now? The last push to 52.41 looks like a liquidity grab; ATR (0.46) says volatility is coiled for a snap back.

Debate:
TP2 at 50.49 or fakeout
LTC+2.82%
$Bonk #Bonk Bonk Breaks Crucial Descending Trend Line, It Can Give 50%+ Bullish Rally
post-image
BONK+5.36%
🚀 🚀 🚀 𝐌𝐚𝐫𝐤𝐞𝐭 𝐀𝐧𝐚𝐥𝐲𝐬𝐢𝐬 | 𝐌𝐀𝐑𝐒𝐂𝐎𝐈𝐍/𝐔𝐒𝐃𝐓
MarsCoin ($$MARSCOIN ) is pushing higher to test intraday local resistance near $0.1834 following strong momentum across major exchanges. Buyers are attempting to consolidate above key short-term moving average floors, aiming for a breakout toward new swing highs.
📊 𝐊𝐞𝐲 𝐌𝐞𝐭𝐫𝐢𝐜𝐬
• Current Price: ~$0.1834
• Market Cap: ~$183M – $192M
• Market Bias: Bullish / Momentum Expansion 🐂⚡
📈 𝐓𝐞𝐜𝐡𝐧𝐢𝐜𝐚l 𝐇𝐢𝐠𝐡𝐥𝐢𝐠𝐡𝐭𝐬
• Structural Momentum: Price action is maintaining a clean series of higher lows on the 1H/4H time
MARSCOIN+39.13%
$NETNET / @NetNetCap
Yeah, I am gonna wait a bit on this one...
post-image
Load More

Join 40 M users in our growing community

⚡️ Join 40 M users in the crypto craze discussion

💬 Engage with your favorite top creators

👍 See what interests you

View More