Share crypto content and earn up to 60% commissions through content mining.
placeholder
gatefun
How bad is the A-share market right now? People probably don’t have much of a sense of it:
1. Out of 227 funds that have doubled, only 19 are still doubled so far; most of them are in massive drawdowns.
2. A former colleague of mine, who had first-hand information on industry, funds, and more, also went bankrupt in this round after adding leverage—truly regrettable.
Recently, US stocks, A-shares, and Korean stocks have all fallen in a way that defies expectations. I admit AI trading is crowded, but a market cap of a trillion worth almost halves in a month is simply too extreme.
You really have
View Original
  • Reward
  • Comment
  • Repost
  • Share
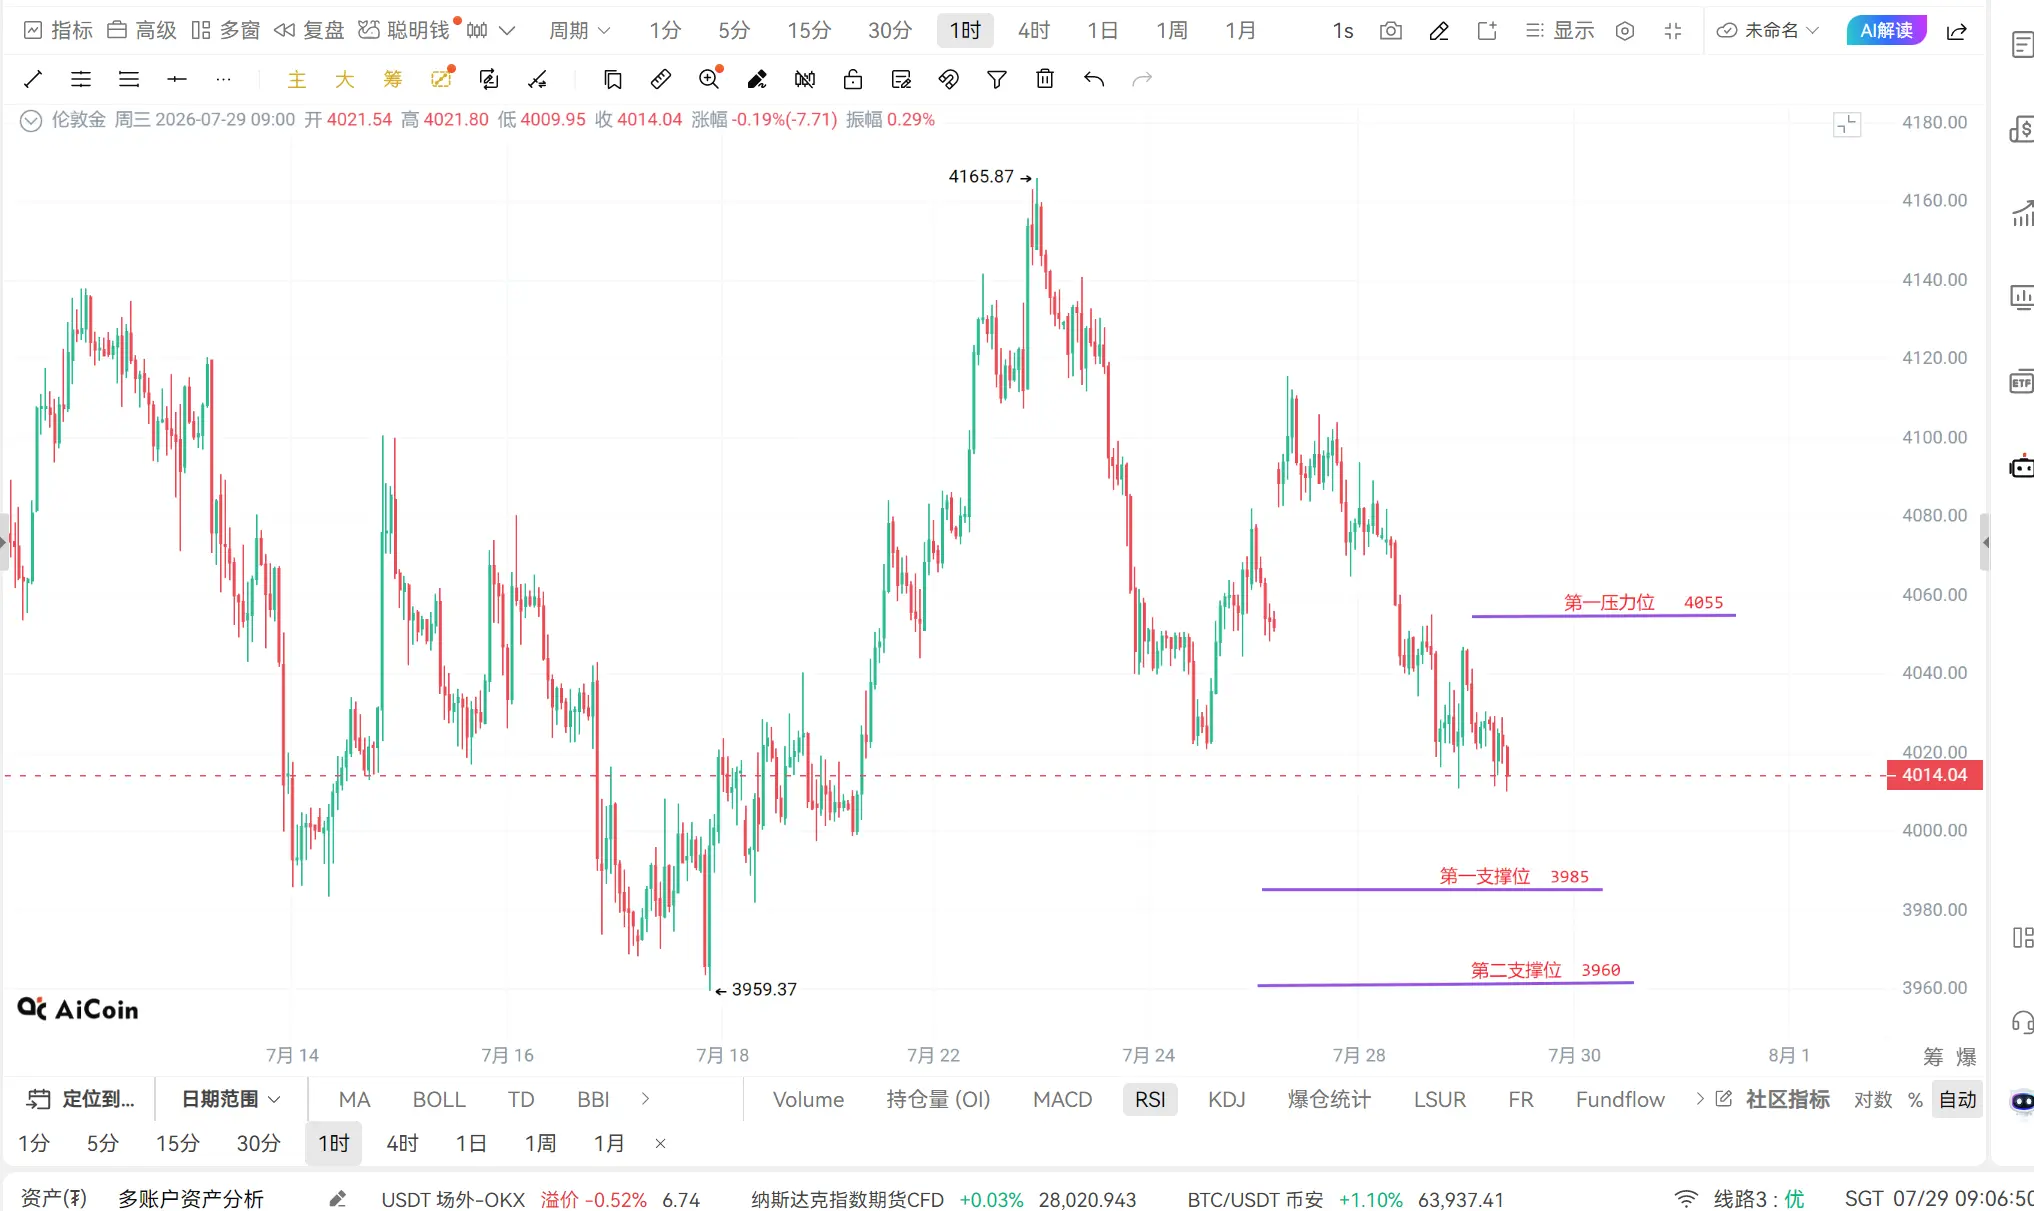
July 29, 2026 Market Analysis:
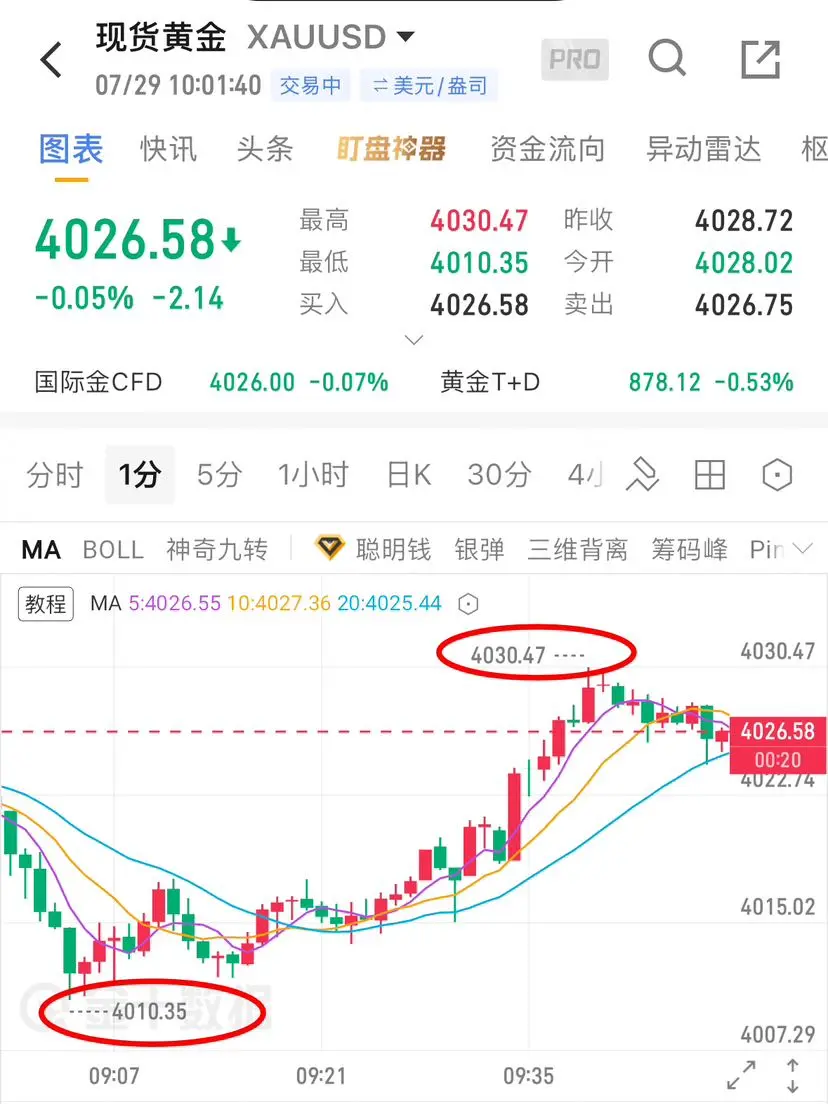
XAU: Yesterday, the “yellow fish” longs entered at 4040 and 4020 respectively. They only ate a small move of 10 points each, totaling 20 points. As in yesterday morning’s analysis, with this kind of market, you basically can only trade short-term scalps on the 5-minute timeframe. Today’s market is similar: both longs and shorts are not easy to play, so the main focus is still scalping around key levels on the 5-minute timeframe. For longs, you can try at 3985 and 3960. For shorts, it’s more prudent to look around 4055.
ETH: Yesterday the community calls were long
ETH1.84%
XAUUSD0.00%
View Original
post-image
post-image
  • Reward
  • Comment
  • Repost
  • Share
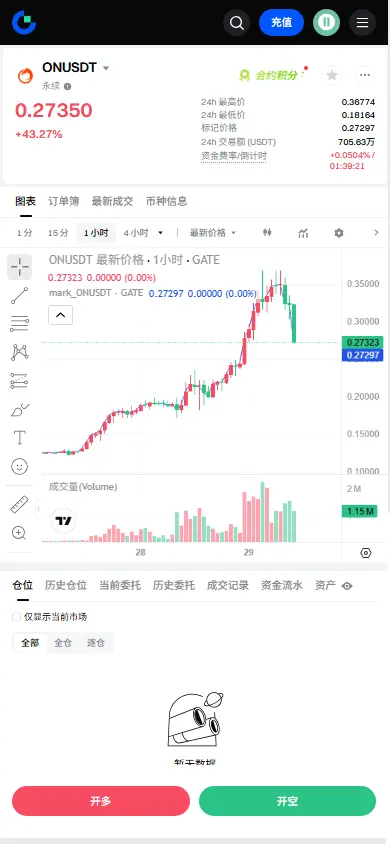
$ON Signal】1H Bollinger Band upper band breakout, bullish momentum continues
$ON 1H RSI 81.15 is pinned in the overbought zone. The Bollinger Band upper band at 0.3837 has already broken once. The 4H Bollinger upper band at 0.3406 is currently undergoing a passive breakout. Funding rate is 0.0637%, and OI remains stable with no sign of a major withdrawal. The buy/sell depth ratio at 1.37 shows there are still buyers stepping in. Price is running at high levels, but sell pressure has not been quickly absorbed; short-term momentum has not yet exhausted.
🎯Direction: Go long
⚡Entry/limit orders:
ON33.32%
USD10.02%
BTC1.09%
ETH1.73%
SOL0.29%
View Original
post-image
  • Reward
  • Comment
  • Repost
  • Share
JUST IN: South Korea’s Finance Ministry reviewing stock-market stabilization measures as the KOSPI slumps ~6% on the day; SK Hynix down over 10%. Could signal heightened policy responsiveness to domestic equities, eyeing spillovers to risk sentiment in broader markets. $KOSPI
SK Hynix-11.74%
post-image
  • Reward
  • Comment
  • Repost
  • Share
$ETH The counterfeit continues to rise.
ETH1.73%
View Original
post-image
  • Reward
  • Comment
  • Repost
  • Share
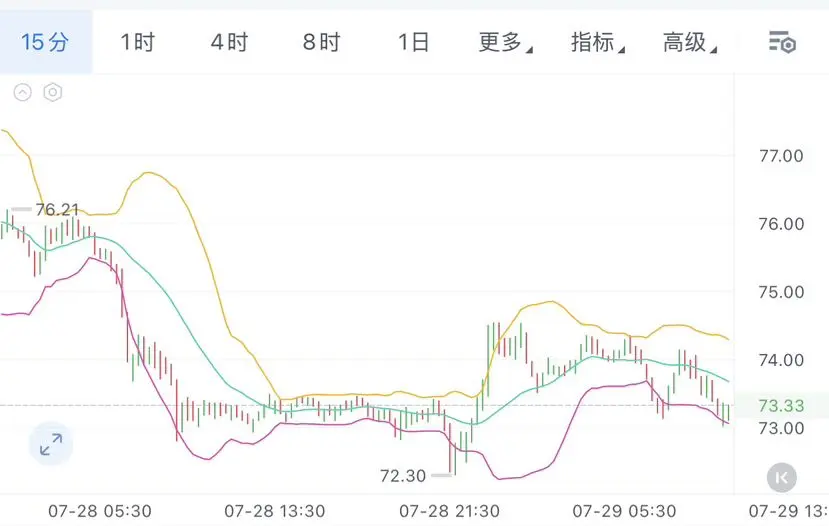
I remain bearish on SOL in the short term.
This rebound has limited strength; the price has not managed to hold above the key resistance level. I therefore lean toward viewing it as a corrective bounce within a downtrend, not the start of a new uptrend.
My focus is clear:
I will prioritize looking for short opportunities under pressure near the resistance zone, rather than blindly chasing longs.
75-77: build a short position in batches.
If it holds above 78: cut loss and exit.
First target: 72.
Second target: 69.
If it strongly breaks below 69: continue to watch around 65.
Until it holds above
SOL0.35%
View Original
post-image
  • Reward
  • Comment
  • Repost
  • Share
$TAO rebounded—so happy, so happy, so happy, so incredibly happy
TAO4.76%
View Original
post-image
post-image
  • Reward
  • 1
  • Repost
  • Share
DucQuang:
nice
Early session MuYun VIP short-term trading ideas realized
The 4012 long order reached the target zone and captured profit accordingly.
Opportunities always go to those who keep in sync with the rhythm and strictly follow execution. #黄金
GLDX-0.91%
PAXG-0.30%
View Original
post-image
  • Reward
  • Comment
  • Repost
  • Share
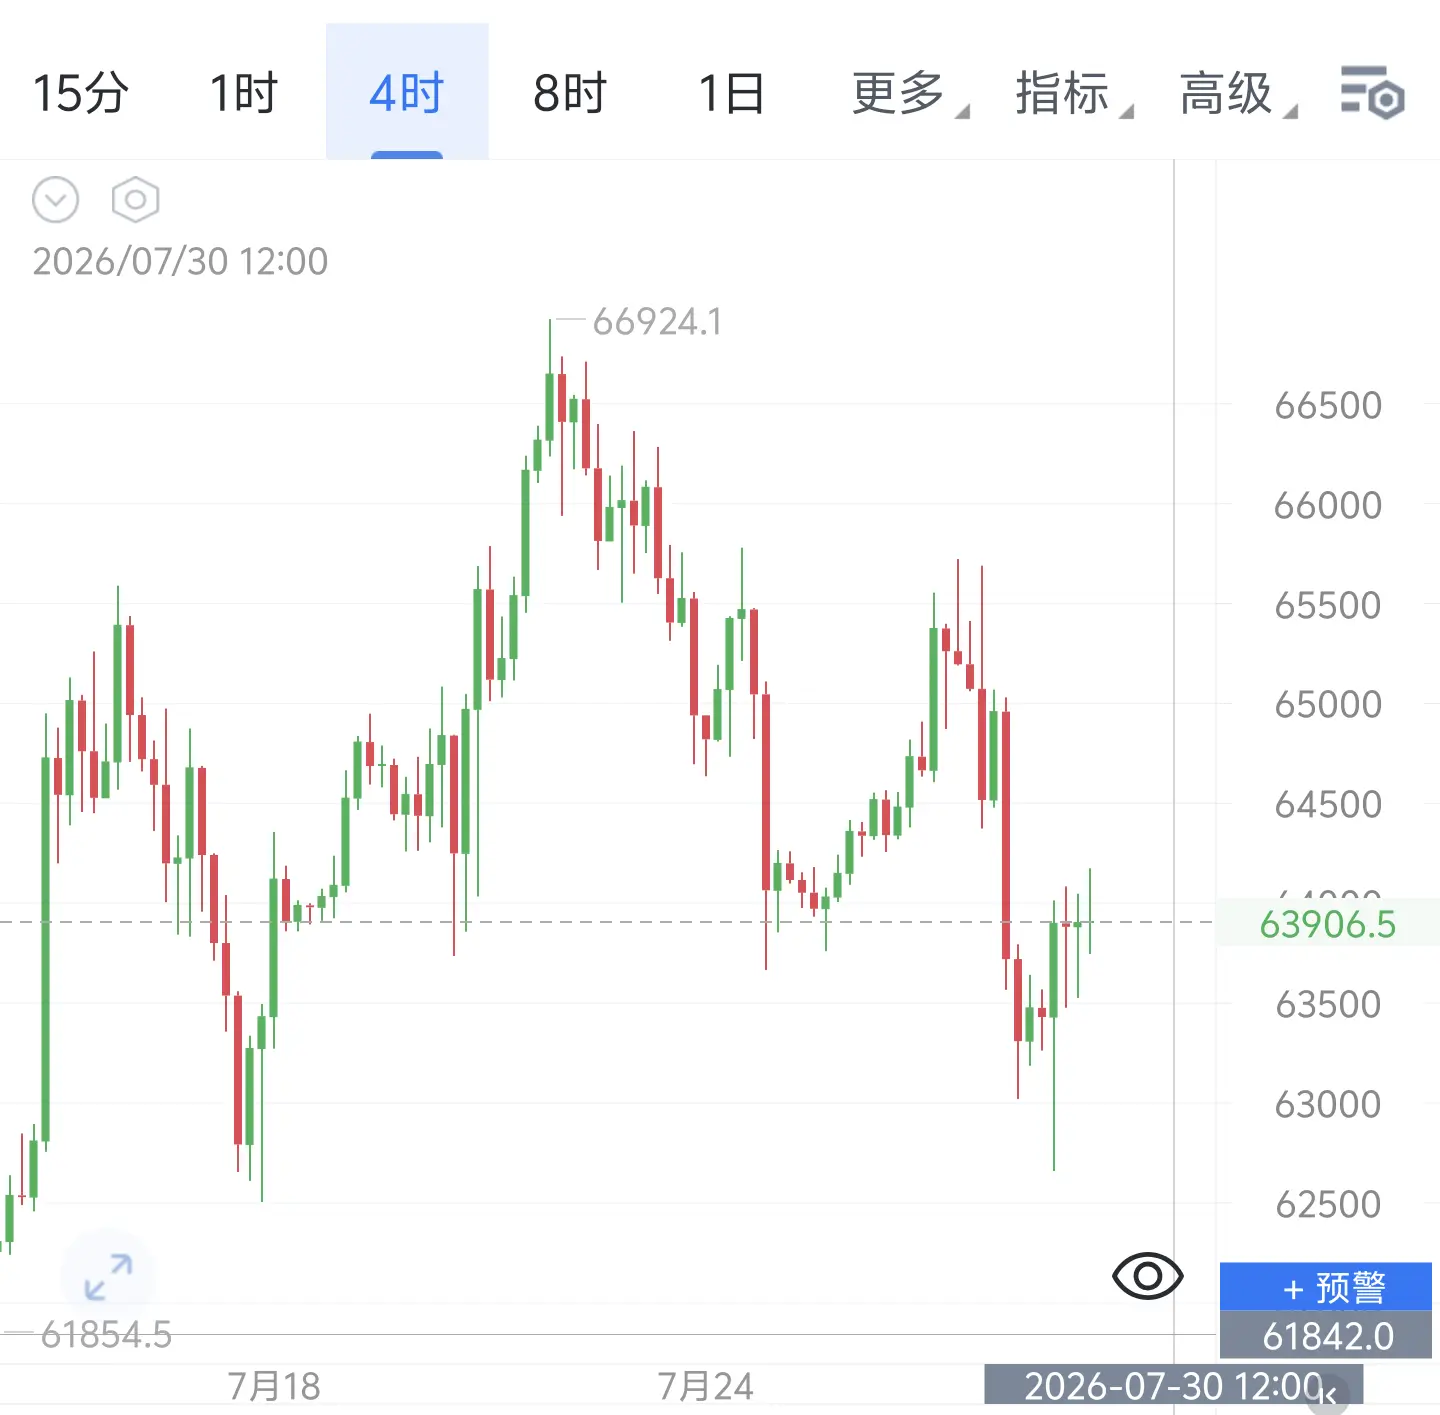
$BTC 7.29 AM Boss’s Thoughts
Yesterday didn’t give us an opportunity. Today the overall plan stays the same—continue waiting, waiting for the wind to come.
On the 4-hour timeframe, this rebound after the current sharp drop is only an oversold correction. It has not changed the overall bearish setup. When the price rebounded to around the Bollinger middle band, it was clearly met with selling pressure. It has consistently failed to effectively break through the key resistance level. From a trading perspective, we continue to maintain the high-level shorting bias.
Trading reference: short the 64
BTC1.09%
View Original
post-image
  • Reward
  • Comment
  • Repost
  • Share
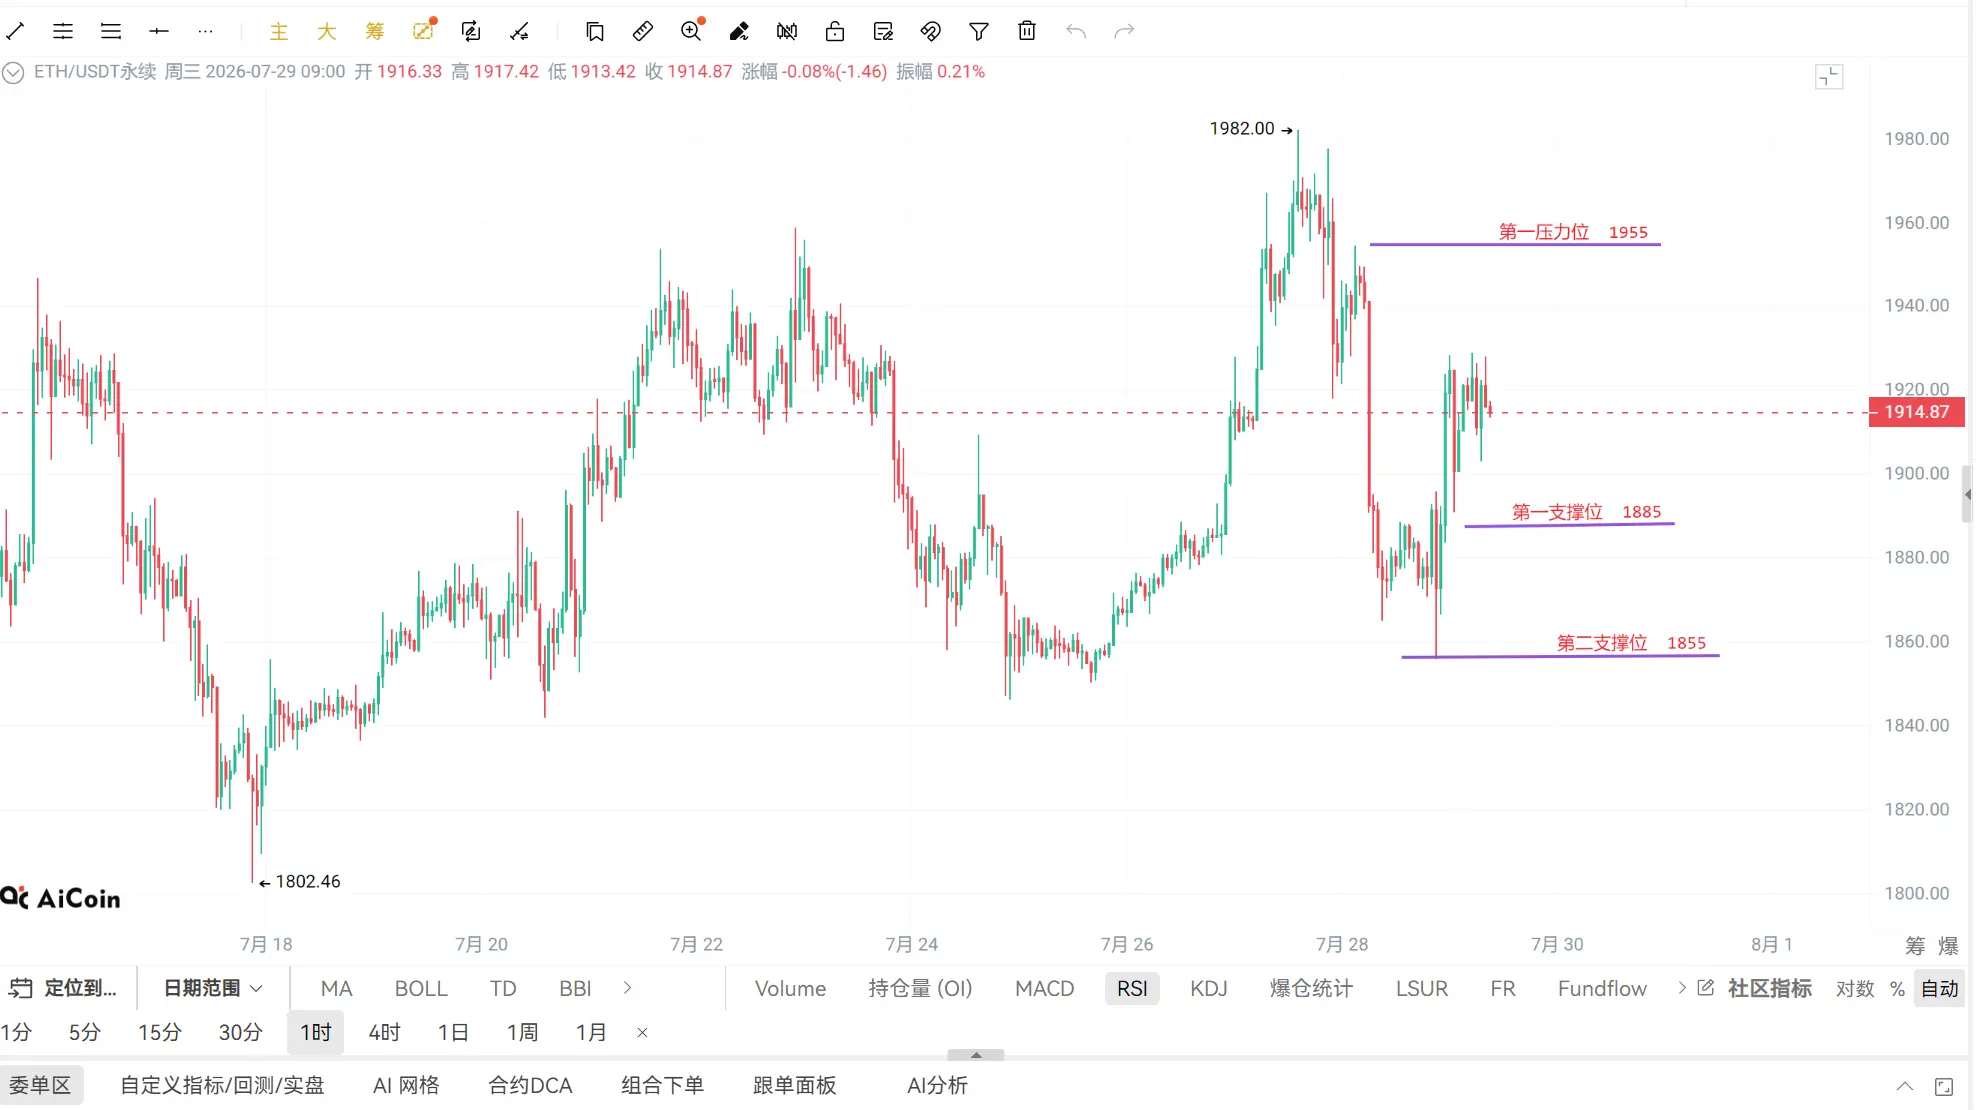
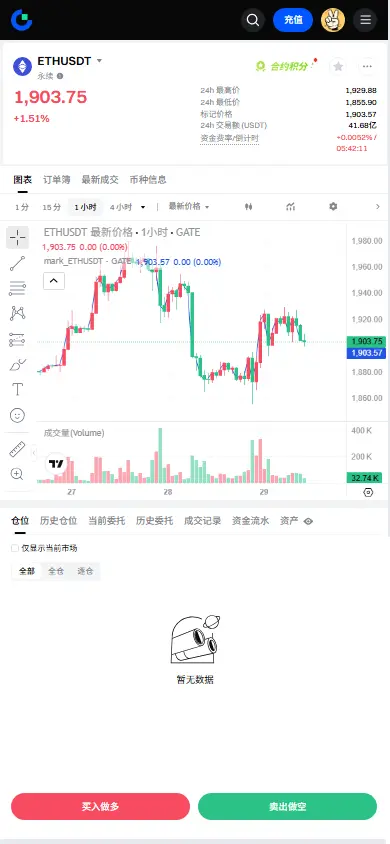
$ETH Signal】Bulls target a rebound supported by the 1H Bollinger Band midline
$ETH The buy/sell order ratio is 0.71; sellers are slightly advantaged, but the price holds above 1900. The 1H MACD has a bullish crossover, and the Bollinger Band midline at 1899 provides effective pull-through. On the 4H chart, bearish momentum remains in a continued contraction. As divergence across multiple timeframes converges, the current risk-reward ratio is 1.5, worth short-term positioning.
🎯 Direction: Go long
⚡ Entry/limit orders: 1915.1 - 1920.8
🛑 Stop loss: 1869.0
🚀 Target 1: 1998.5
🚀 Target 2: 20
ETH1.84%
USD10.02%
View Original
post-image
  • Reward
  • Comment
  • Repost
  • Share
Layout large pie, Ethereum dog head
gate liveLIVE
967
  • Reward
  • 2
  • Repost
  • Share
TalkingAboutMemeAsTheCoinMakes:
坚定HODL💎
View More
I don’t understand Changxin on Hyperliquid.
At the open, you said there was a premium for T+0.
Why is it trading at such a big discount now?
Who exactly is shorting it?
$CXMT
CXMT2.81%
View Original
post-image
  • Reward
  • Comment
  • Repost
  • Share
BNB is currently around 571 u. Today it’s up 1.1%. The recent pullback from the past couple of days that loosened things up this time seems to have been contained, and it has climbed back above 570 again.
The week is basically flat—down only 0.3%. The one-month gain has also rebounded to 3.9%, with some of the earlier eaten-up upside being recovered this time. The 24-hour high is 574.56 and the low is 563.91. Today it first fell and then rose; the price action is similar to the broader market’s rhythm over the past two days—both are probing the lows and then rebounding.
Earlier, I mentioned th
BNB0.76%
View Original
  • Reward
  • Comment
  • Repost
  • Share
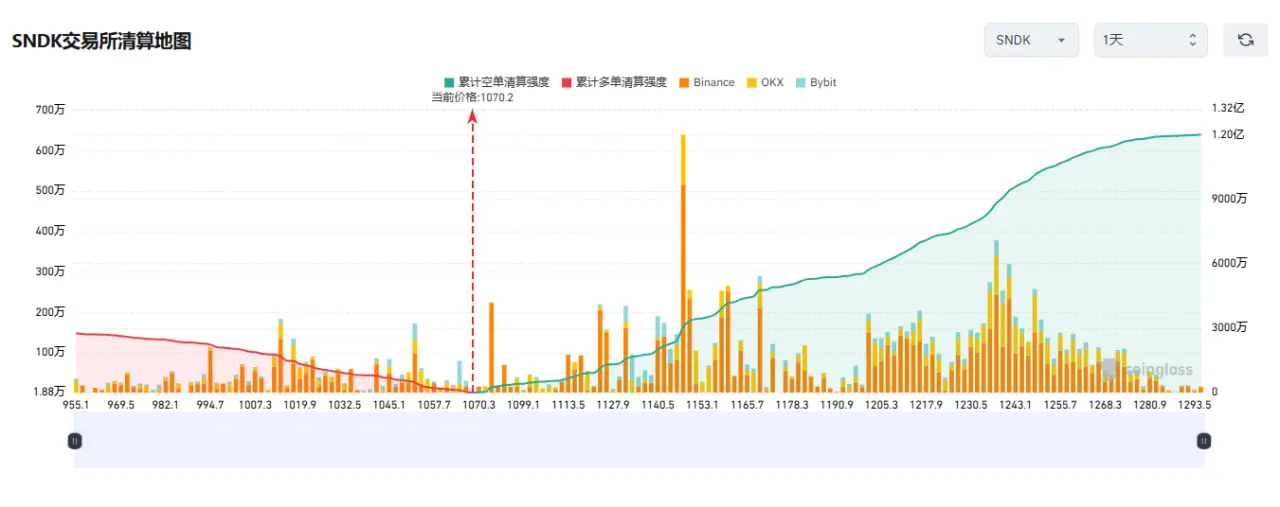
$SNDK Sandisk’s 1230 long is trapped—down 150 USD! After the storage sector plunged 14%, it turned bullish in the after-hours— is this the last chance to escape, or a reversal signal?
Brothers, if you chased the long at 1230 on Sandisk, now you’re seeing 1078—are you even afraid to look at the screen?
It’s down more than 150 points—brutal. Yesterday the storage sector collapsed across the board: Sandisk plunged 14%, Corning fell more than 12%, SK Hynix’s ADR dropped 9%, and the Philadelphia Semiconductor Index lost a key support level. The spark was that SK Hynix’s earnings came in below expe
SNDK-13.86%
View Original
post-image
  • Reward
  • Comment
  • Repost
  • Share
OpenAI's account of the Hugging Face breach reads like a credential-hygiene checklist, not an AI horror story.
> entry point: exposed credentials, not a model exploit
> footprint: four separate accounts
> spread: four publicly available third-party services
> real lesson: an agent's blast radius equals every key it can reach
the model was never the weak link. the secrets sitting in the open were.
post-image
post-image
  • Reward
  • Comment
  • Repost
  • Share
Cat-ge has already embarrassed her so much that she’s been digging at her toes on the floor. 🤣
Is there any experience more socially humiliating than this? 😂
View Original
post-image
  • Reward
  • Comment
  • Repost
  • Share
$SK Hynix buy the dip and make a bet
SK Hynix-11.74%
View Original
post-image
  • Reward
  • Comment
  • Repost
  • Share
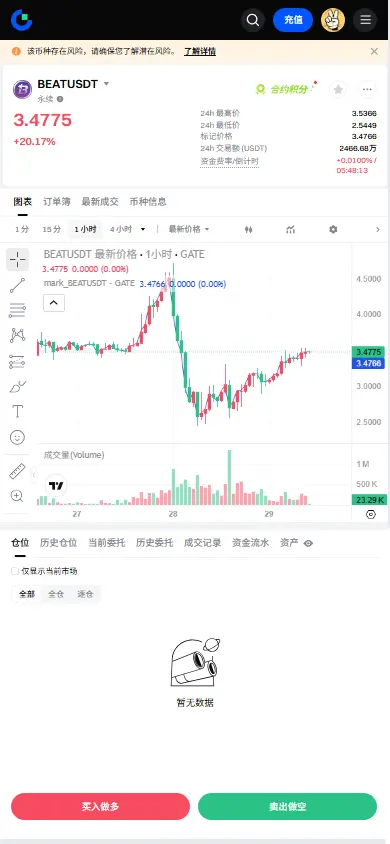
$BEAT Signal】Long Side Strike: 1H Bollinger squeeze + strong buy-side support
$BEAT The upper band of the 1H Bollinger Band is at 3.5215, and the current price 3.386 is hugging the middle band. The buy-side depth is 1.37, and the intent to provide a capital backstop is fully exposed. RSI is 58.88, and momentum has not yet exhausted. On 4H, the MACD bearish histogram bars narrow, and sell pressure weakens.
🎯Direction: long
⚡Entry/Orders: 3.37584 - 3.38600
🛑Stop loss: 3.35214
🚀Target 1: 3.43679
🚀Target 2: 3.46219
🛡️Trade management:
- Execution strategy: After reaching Targ
BEAT23.75%
USD10.02%
BTC1.09%
ETH1.73%
SOL0.29%
View Original
post-image
  • Reward
  • Comment
  • Repost
  • Share
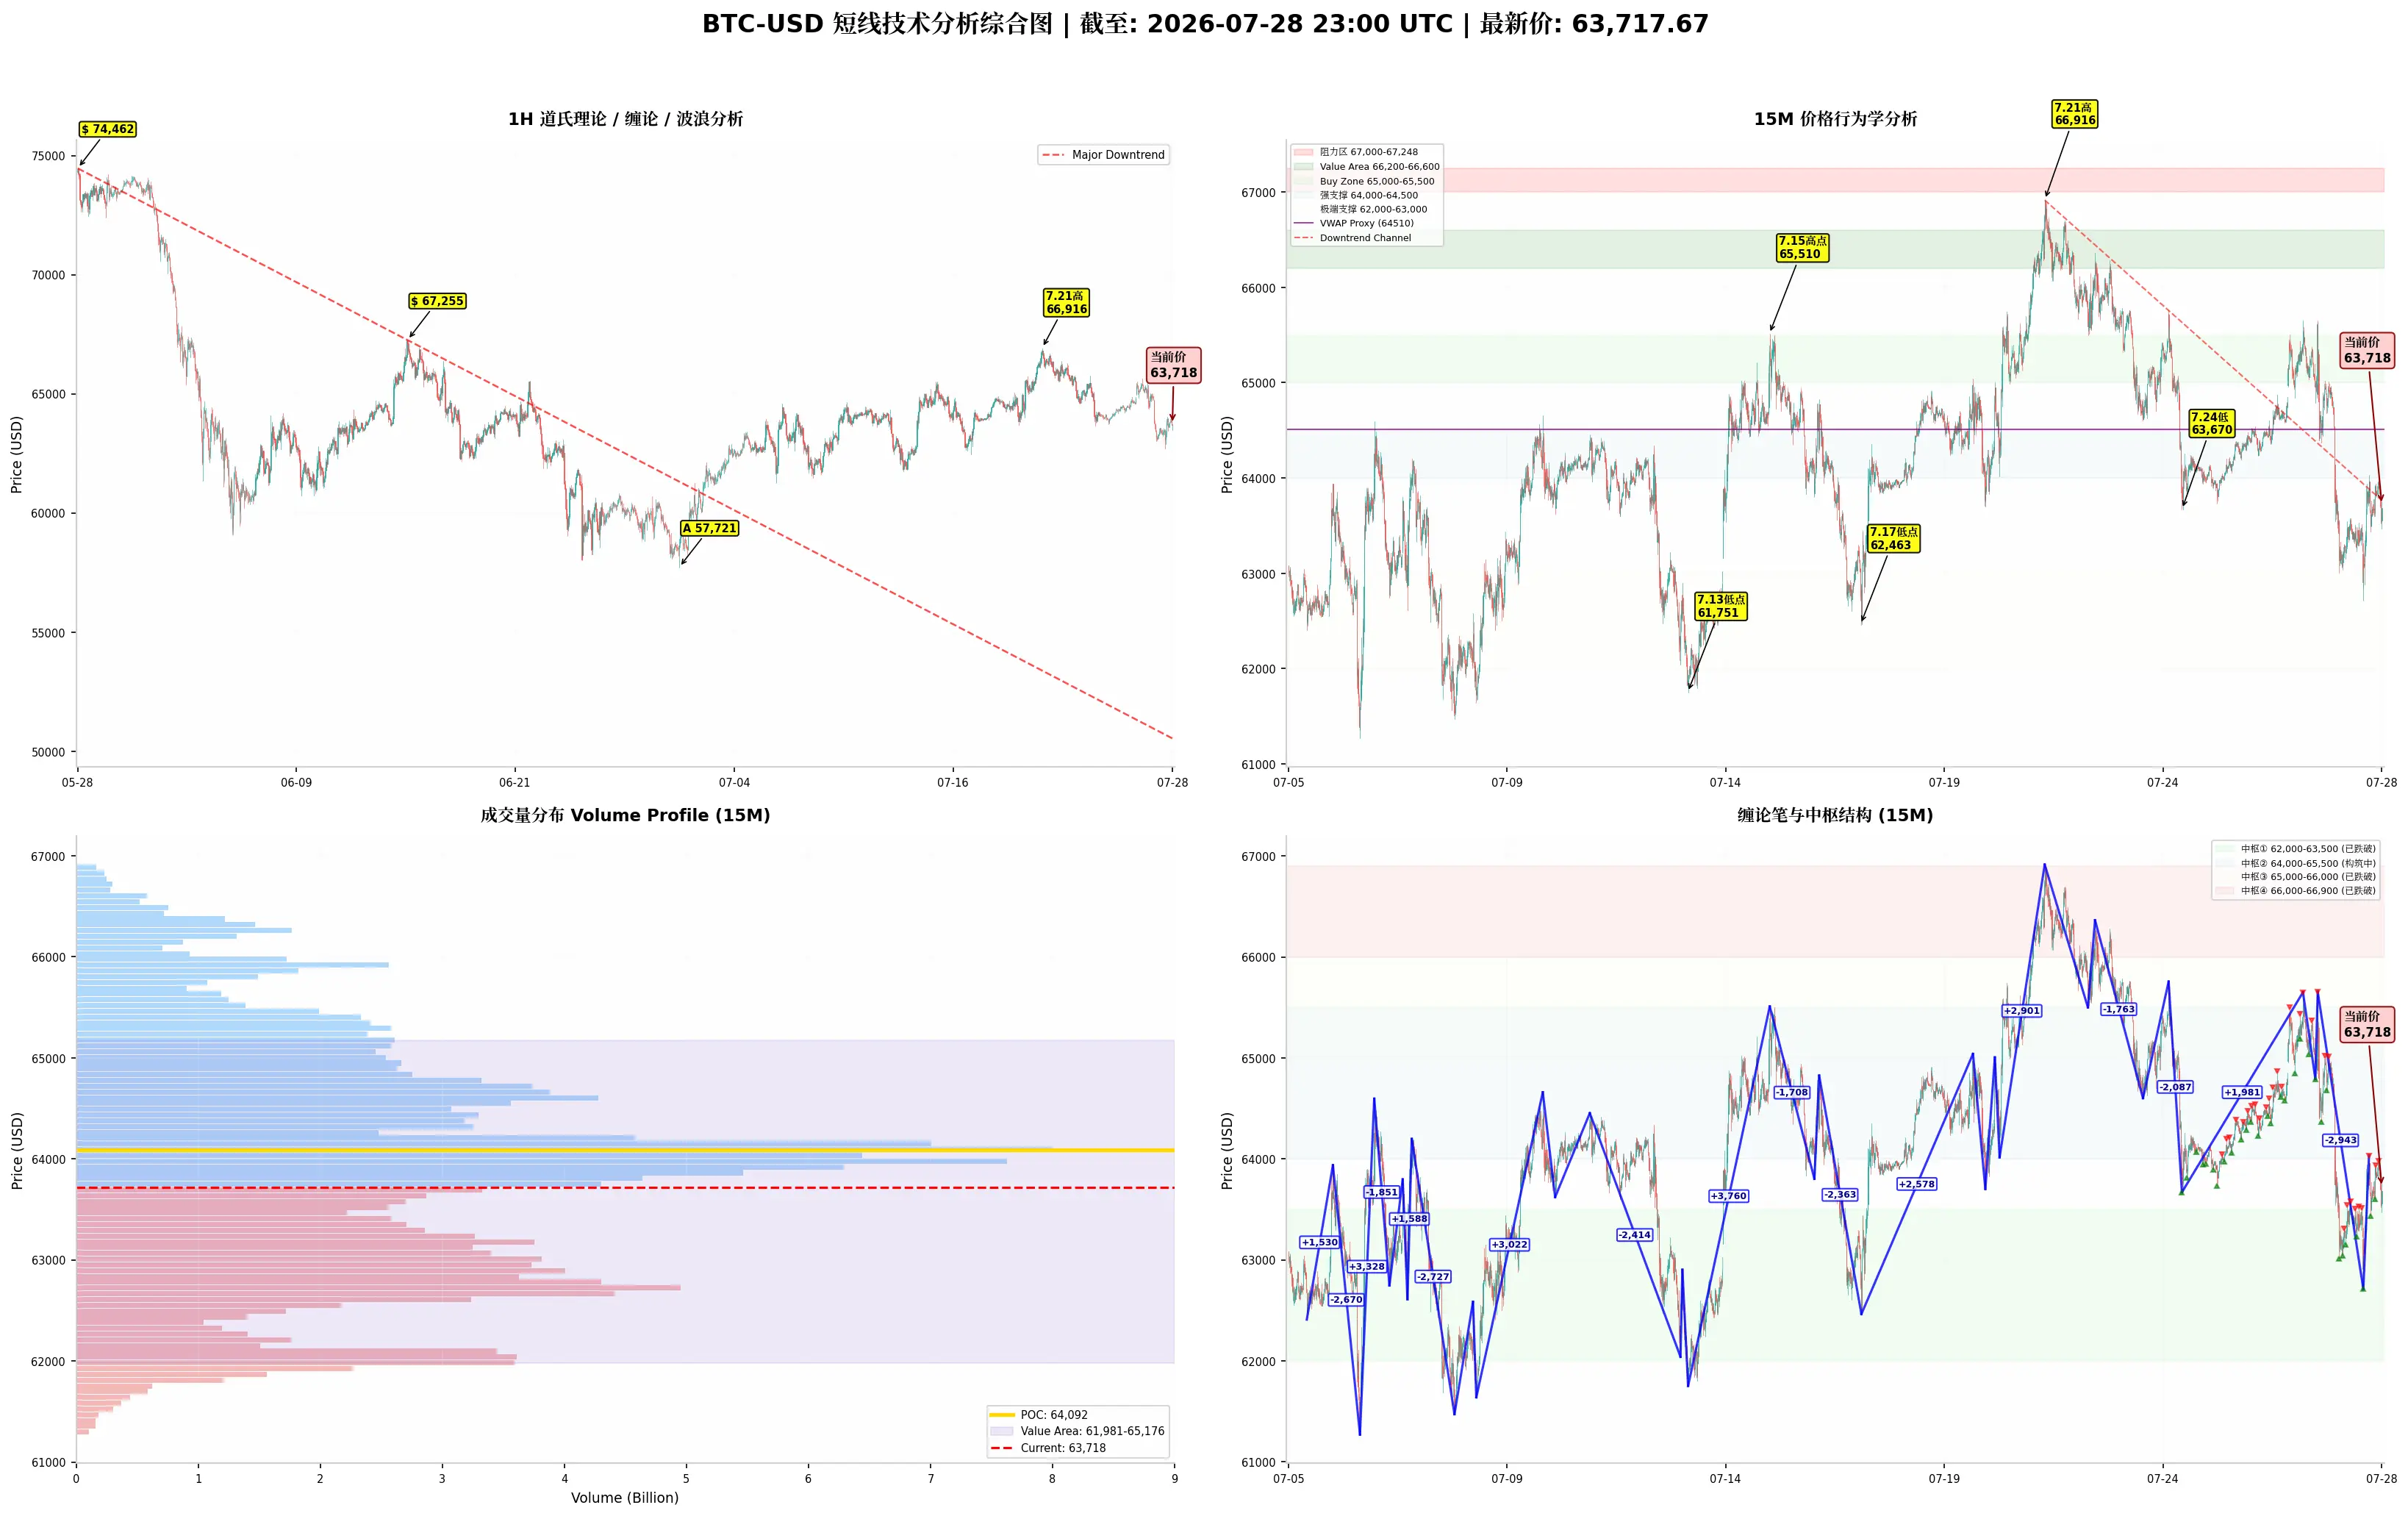
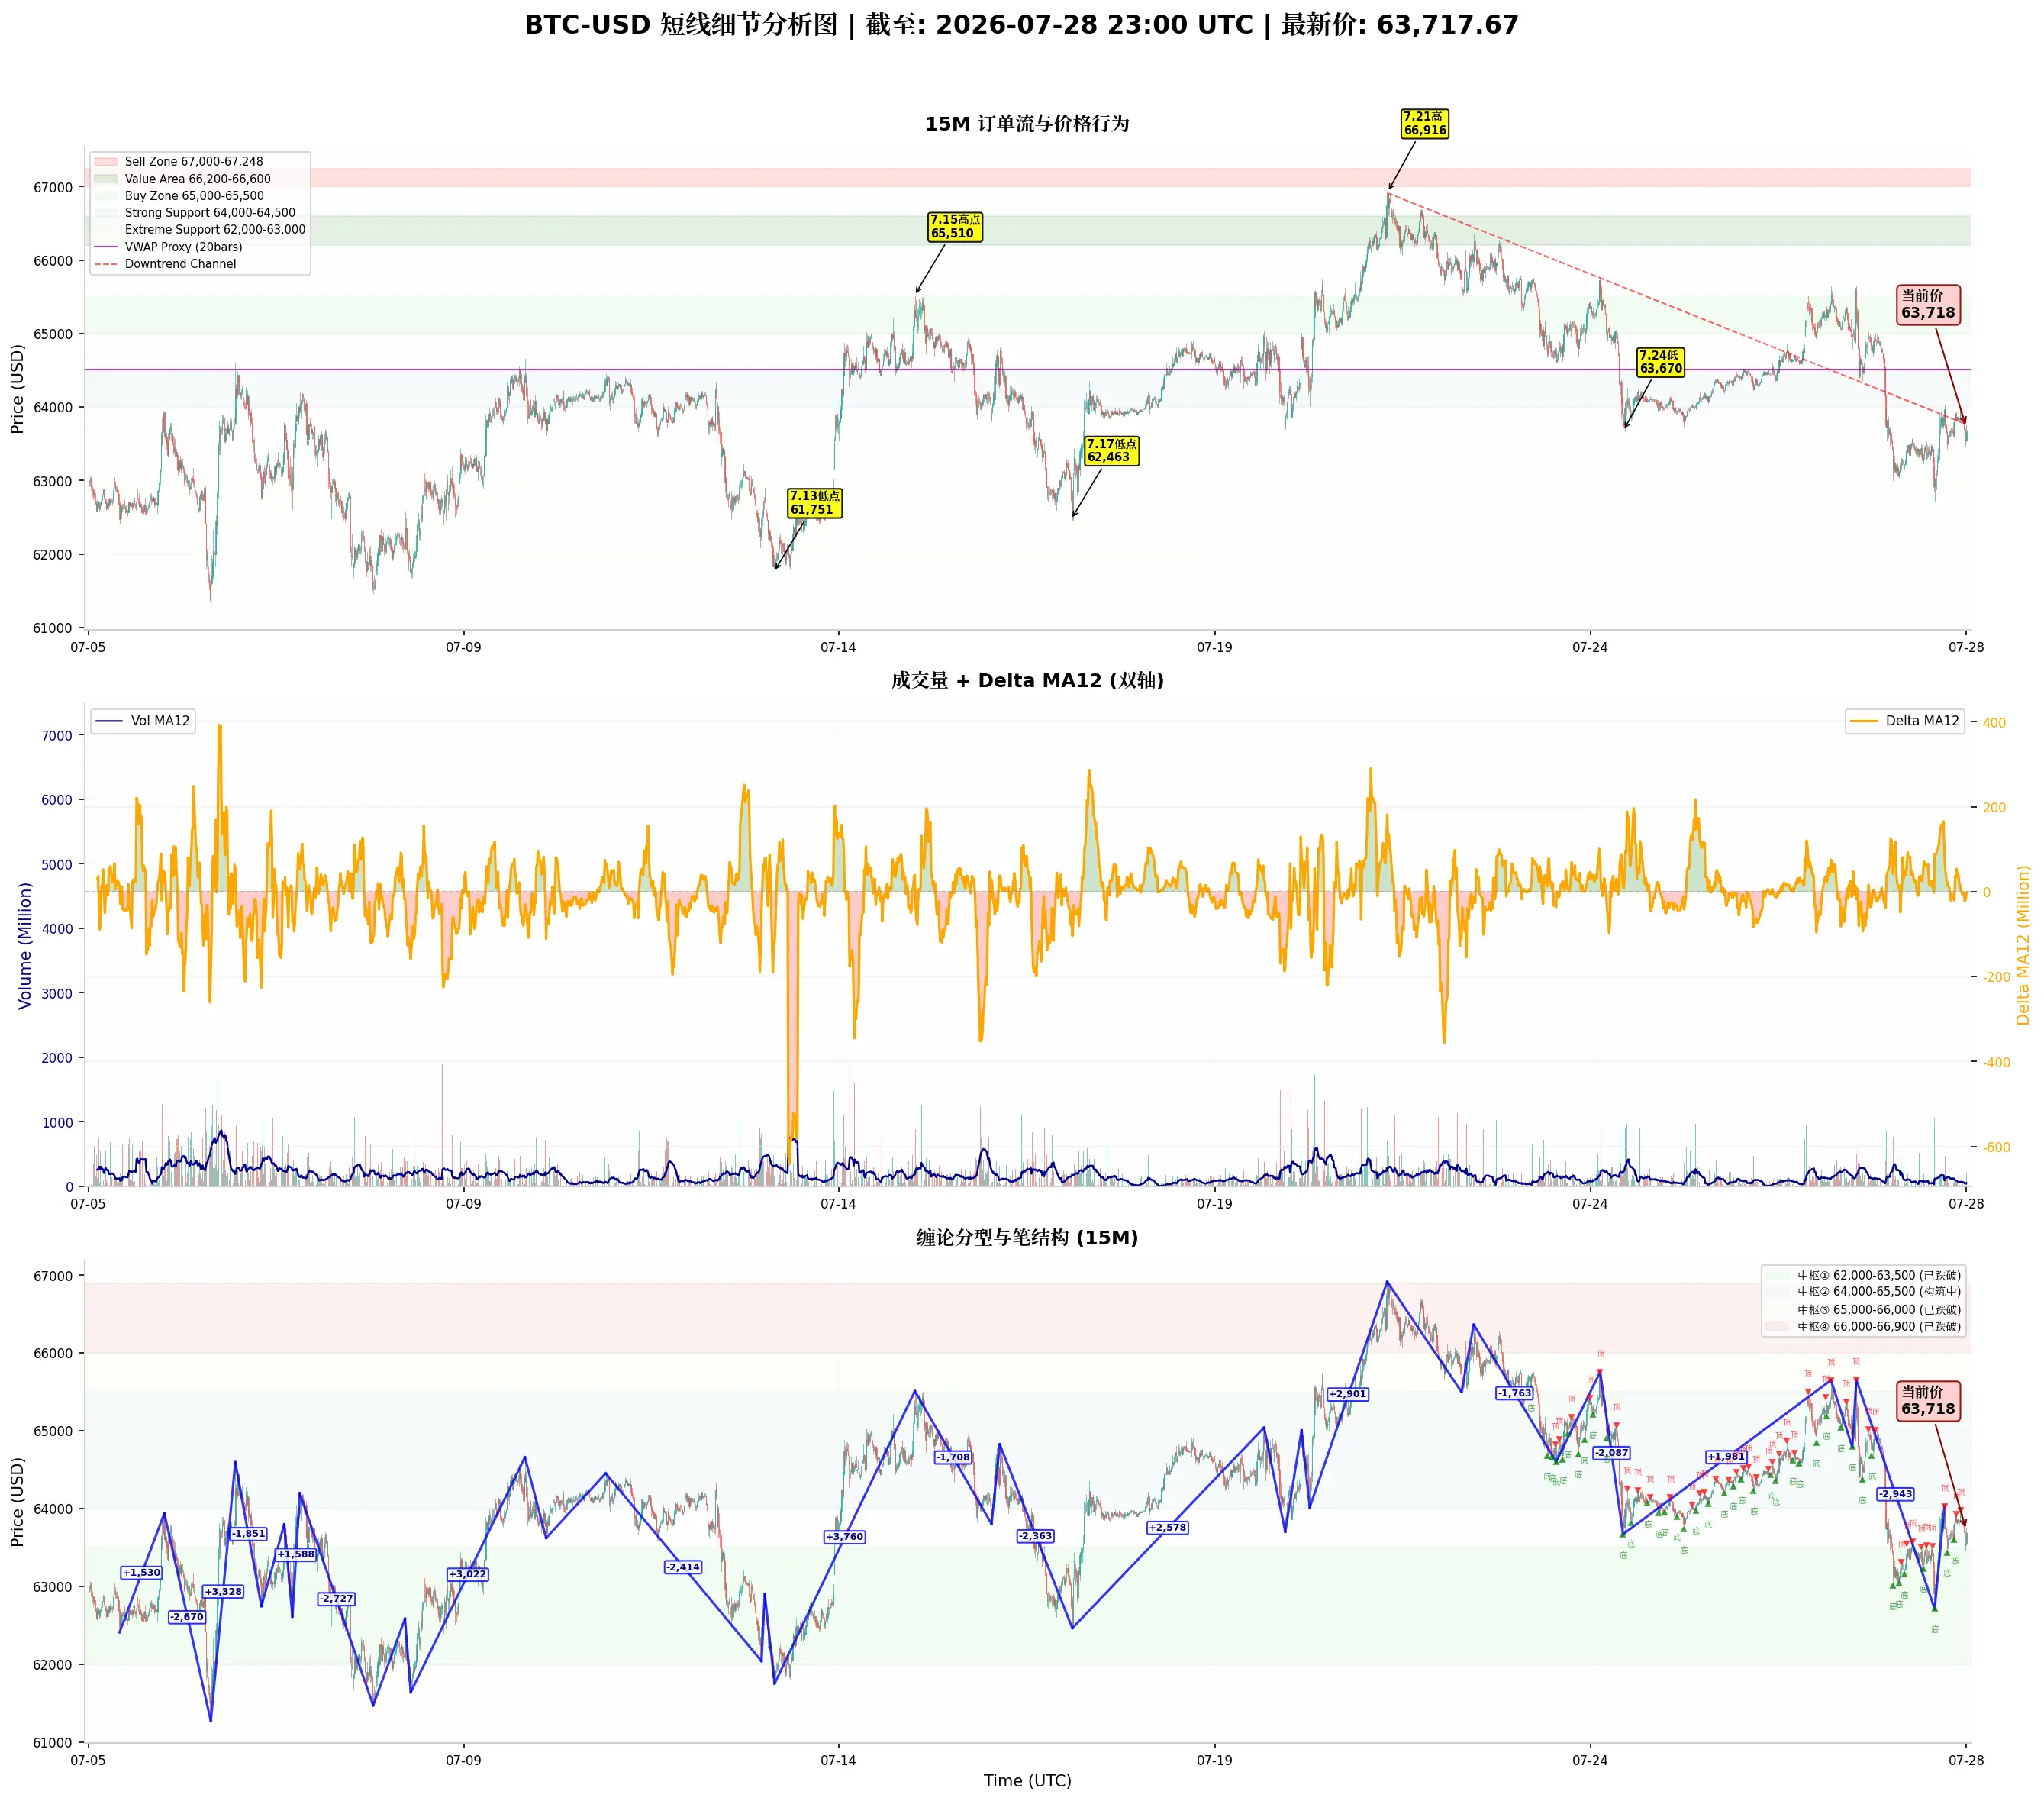
An Introductory Analysis of BTC Short-Term Trends from Dow Theory, Chan Theory, Elliott Wave Theory, Volume-Price Relationship, Order Flow, and Price Action
$BTC #BTC 1. Dow Theory
Major trend (1-hour timeframe): The main downtrend that began from the historical high of 74,462 on May 28 is still ongoing. After the price fell from 74,462 through the June 15 secondary high of 67,255, it dropped all the way to the July 1 low of 57,721, for a cumulative decline of 16,741. After bottoming on July 1, the bulls launched an ABC rebound (Wave A 64,597 → Wave B 61,471 → Wave C 64,660). After the end
BTC1.13%
View Original
post-image
post-image
  • Reward
  • Comment
  • Repost
  • Share
Load More

Join 40 M users in our growing community

⚡️ Join 40 M users in the crypto craze discussion
💬 Engage with your favorite top creators
👍 See what interests you
  • Pinned