
Square
Following
Hot
News
Notifications
Profile
Share your thoughts
placeholder
Article
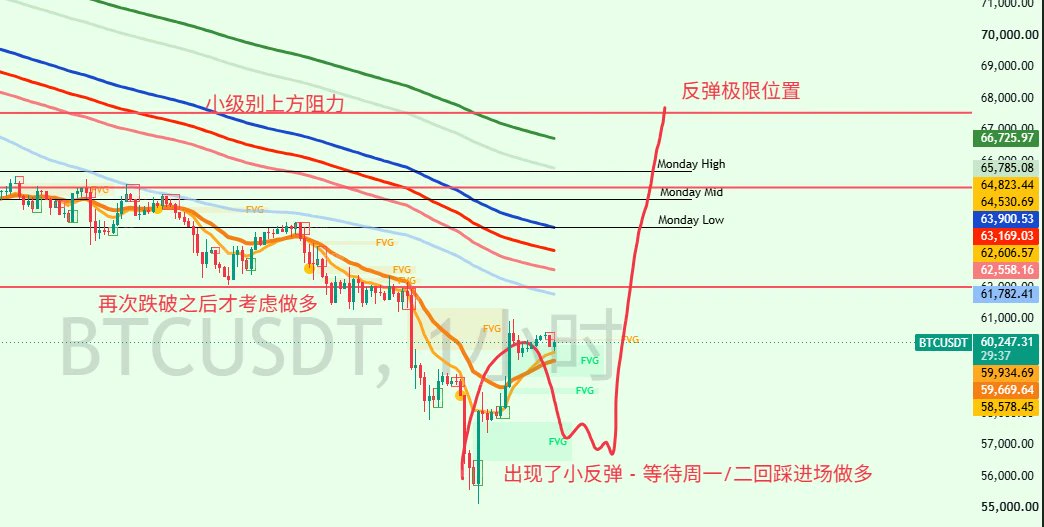
Short-term view on $BTC and U.S. stocks: Bitcoin’s realized price is at $53,000, and the long-term holder cost basis is $48,000. This crash took it from $87,000 to $55,000, a drop of $32,000 already. Even if it falls another $10,000, averaging down means you still wouldn’t be at a loss if it rebounds to $60,000. Bitcoin’s 3-day and 5-day moving averages and weekly KDJ are all already negative, so a rebound could happen at any moment. Wait for a Fibonacci retracement bounce before considering shorting. Given the current market, BTC is only one wave away from completing its seven-wave pattern o
post-image
BTC-0.67%
NAS100-0.07%
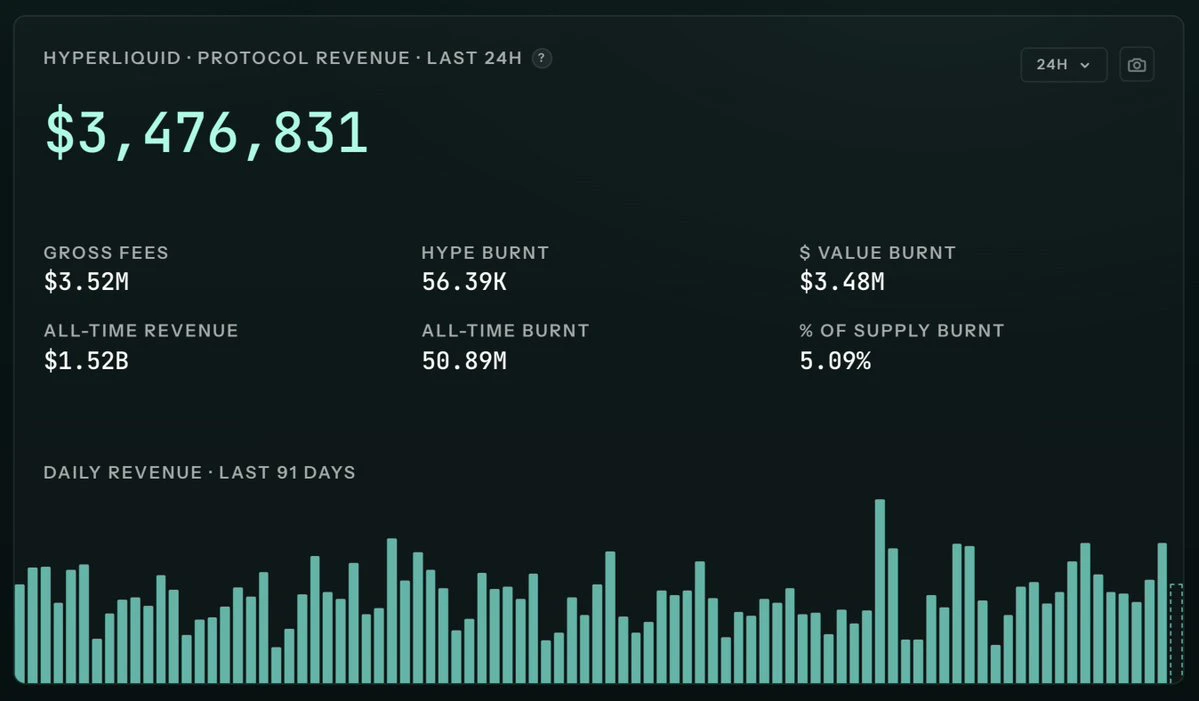
$HYPE is down 40%, but hyperliquid still makes $3M+ a day in revenue
what is zcash doing these days
post-image
HYPE+0.24%
ZEC+1.16%
Trenches
IDOL
I
bade
b
IDOL
0x3b...ab07
Market Cap
$.
Change
.
24h Vol
$.
Holders
.
PIEVERSE
P
bade
b
PIEVERSE
0x0e...25a9
Market Cap
$.
Change
.
24h Vol
$.
Holders
.
FIONA
F
bade
b
FIONA
B34n...pump
Market Cap
$.
Change
.
24h Vol
$.
Holders
.
Singularity
S
bade
b
Singularity
7R4M...pump
Market Cap
$.
Change
.
24h Vol
$.
Holders
.
CLAUDIA
C
bade
b
CLAUDIA
2j5S...W2ZM
Market Cap
$.
Change
.
24h Vol
$.
Holders
.
I’m long $VVV . Trade parameters: Entry: 23.432 - 23.959 Target 1: 25.025 Target 2: 26.089 Exit: 22.495 VVV has temporarily pulled back at MA25 support; it’s time to add to the position again, kick off a new rally, and challenge the highs. Trade here with me. My list today includes
‍$NAORIS and $ETH .
post-image
VVV+0.37%
NAORIS+0.66%
  • 1
EVAA | Long 🟢 | Bullish | 15m24h: +7.97% | Volume: 322.3M USDTLong rationale: Price above EMA200; EMA20/50/200 in bullish alignment; RSI14 at 60.6; MACD histogram positive; ADX14 at 18.5; volume at 0.69x the 20-candle average; trend pullback/continuation. Entry: 6.4238Stop loss: 6.26472Take profit 1: 6.62265 | Take profit 2: 6.74197 | Take profit 3: 6.90105For reference only; do not chase price. This strategy is invalidated if the stop-loss level is hit. Technical analysis strategy only, not investment advice.$EVAA
post-image
EVAA-0.49%
Okay, $SKHYNIX , we understand—the resistance level is hard to break through today. You’ve worked hard enough, and it’s time to catch your breath. Let’s see whether you have the strength to keep going or whether it’s time to call it a day. TP: 734.06SL: 796.72Other coins: $ZEC : Current price 786.23 - 24-hour change: +6.28%$PIEVERSE : Current price 3.4076 - 24-hour change: +14.87%
post-image
SKHYNIX+1.41%
ZEC+1.16%
PIEVERSE+0.58%
#晒出我的合约收益
Take a small bite of IDOL
Seize the opportunity$ANT #IDOL
post-image
ANT-8.68%
  • 4
  • 1
$UNI ’s 5.74% rebound, from 4.18 to 4.78 in a single day, isn’t just a crypto story. Last Friday, the U.S. reported core PCE at 0.2% month over month, below expectations, and the dollar index weakened on the spot. That was the first turn of the faucet. The effect reaches crypto through two steps: a weaker dollar and falling Treasury yields. Money first flows into high-beta tech stocks, then spills over into crypto, at the far end of the risk curve. So $UNI ’s move isn’t independent; it’s following the rhythm of Nasdaq futures.
Looking at the structure, the 4.18 low was carved out as U.S. stocks
UNI+3.05%
  • 1
  • 2
$IDOL No coincidences, only opportunities; the coin lives up to its name: 0.048 is just right, neither more nor less
post-image
IDOL-6.71%
#黄金逼近3500美元关口
Gold at $3,538: The $3,500 Support Battle Could Decide the Next Major Move

Gold is approaching a critical turning point after an aggressive selloff pushed prices toward $3,500. The latest available spot-market quote stands near $3,537.90 per ounce, following a session decline of approximately 2.38%. The metal traded as low as $3,502, bringing the market dangerously close to breaking an important psychological threshold.

What makes this decline particularly significant is that gold is experiencing selling pressure despite broader financial market uncertainty. This reflects a ma
XAU+0.38%
  • 1
  • 1
BTC Market Outlook
Wait for a Pullback to Go Long
After two weeks of waiting, we’re finally nearing a bottom, and the market has seen its first rebound of around 10%—though it was only 5,000 points, it’s still encouraging
Many believe BTC will continue falling below 48,000. I don’t rule out that possibility, but I also think the market will rebound next Monday or Tuesday. At the very least, “there’ll be a rebound to trade”
This rebound is in sync with the rebound I expect in U.S. stocks
After the VIX rose on Friday, I think U.S. stocks will continue falling until intraday Monday or before the
post-image
BTC-0.67%
  • 1
Honestly, altcoins like $JCT are pretty fun too; riding the waves can be quite satisfying!
JCT-3.26%
  • 1
Real and strong communities will be fine, I'm not worried bout them
Fear your fake coins...
Zero
post-image
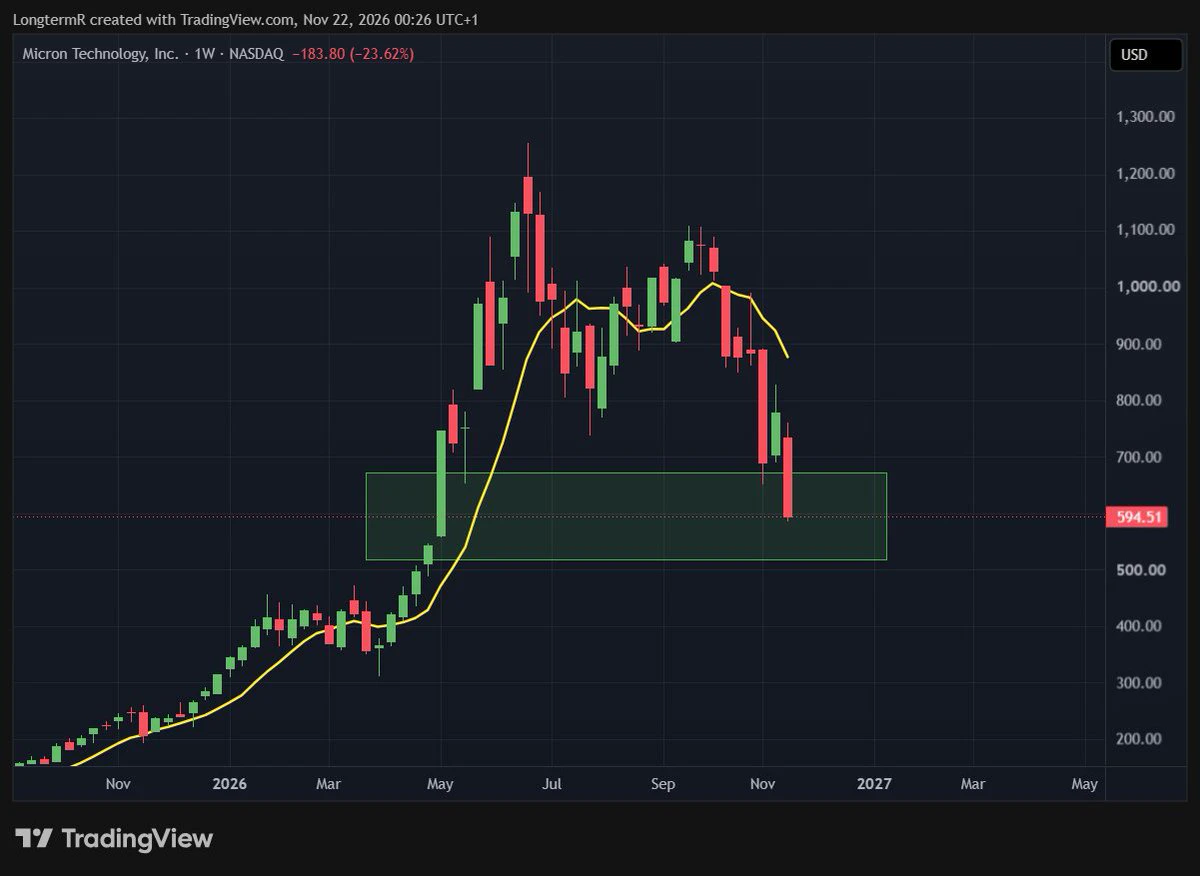
$MU Yeah, I know Micron looks like s*it here.
But it is actually in the Fib retracement area box.
Good to know ✍️🏼
post-image
MU-13.88%
The shady trading signal provider Caishen Nainai 6 blew it all in two days🤬🤬🤬
post-image
  • 1
$NVDA ‌
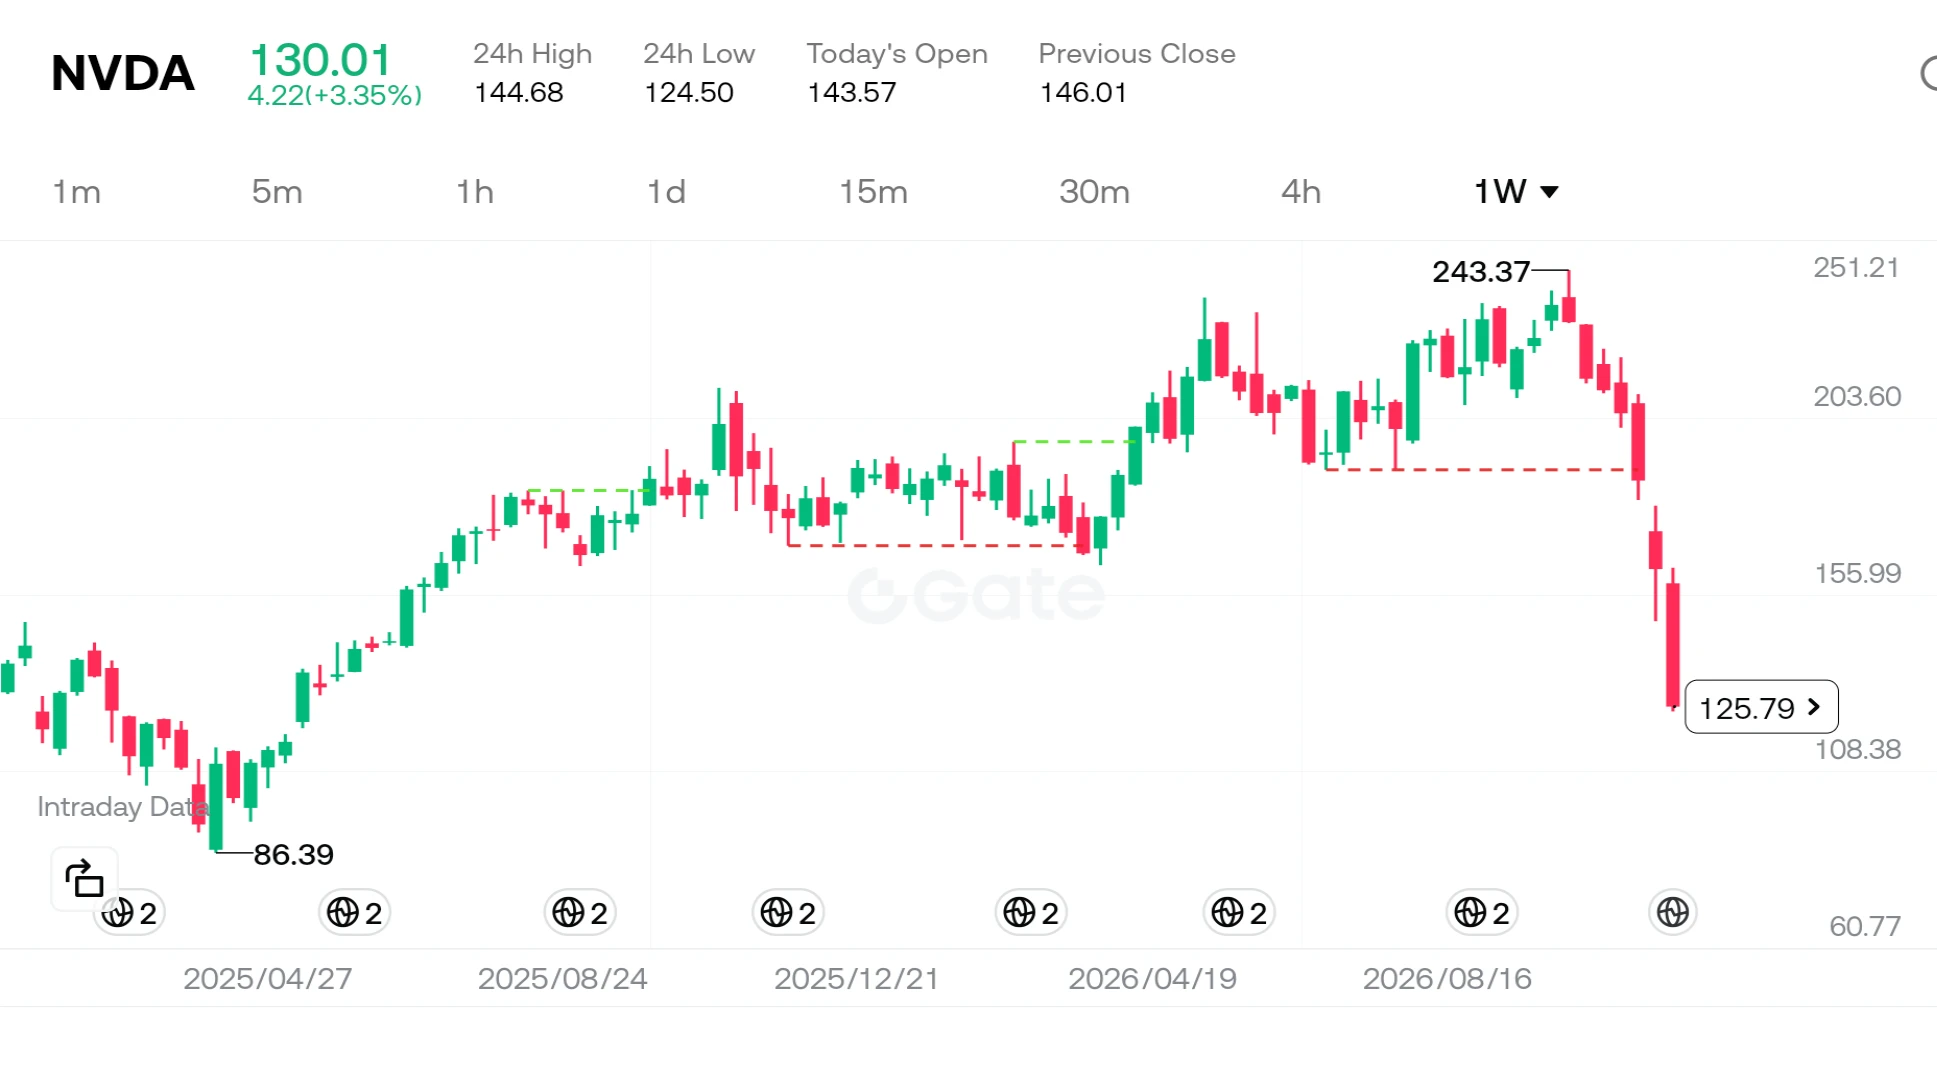
Nvidia has been losing ground for seven consecutive weeks—a trend not seen since 2008. The stock plummeted 14% last Friday alone, bringing its total decline over this seven-week period to approximately 46%. As clearly illustrated on the chart, the price has retreated from a peak of $243 to the $125 range. So, what is the story behind how this once-most-valuable company reached this point?

In reality, this is not merely a stock market correction; it is the result of three major, intersecting storms hitting the same vessel.

First, let’s look at the company’s internal dynamics. Uncerta
post-image
NVDA-13.84%
  • 7
  • 2
$TAO Short thesis update: 186 is a resistance zone on the 4-hour chart. Price has already hit my take-profit target, so I’m watching closely now. If a 4-hour candle closes above 189, I’ll abandon the bearish view.
The current 4-hour price is 185, below the EMA50 (193), and bears still control the momentum. The stop-loss distance is about 1.8%, with 2.9% room to the third target. If TP3 is reached, the risk-reward ratio would be around 1.6R.
Short entry range: 185.2–185.6. Staggered targets: 183.4 → 182.1 → 180.1. Structural invalidation: 188.7
Where would you place your stop loss? This is not
post-image
TAO+0.41%
$NAORIS Up 15% in a day, touching a high of 0.036—is the “breakout pattern confirmed”?
There’s a widely circulated claim: once the price clears the previous high and closes green on heavy volume, the pattern is confirmed and it’ll keep moving up. Sounds convincing, but doesn’t hold up in practice. Today’s 24-hour trading volume was 13.8M. In a 15% green candle, that volume shows there was turnover, but also that selling pressure was absorbed—and being absorbed doesn’t mean it’s all been cleared. Looking at the move from 0.0296 to 0.036, the price has already covered a lot of ground. Structural
NAORIS+0.66%
  • 1
Nvidia intetim ceo colltte kres faces a ......
live-cover
LIVE32
ETH-1.26%
BTC-0.67%
SOL-0.77%
USDC+0.01%
Load More

Join 40 M users in our growing community

⚡️ Join 40 M users in the crypto craze discussion

💬 Engage with your favorite top creators

👍 See what interests you

Trending Topics

BTCBreaksBelow60K

2.1M Views30K Discussing

BTC fell below $60,000 on November 20 for the first time since July, alongside a tech stock selloff and broader pressure on risk assets. Will $60K become resistance, or can BTC quickly reclaim it? What price or volume signals would convince you that selling pressure is easing?

GateDirectIPOPhase3ANTAllocates92100Shares

797.2K Views4.9K Discussing

NvidiaDropsNearly14Percent

333.9K Views7.6K Discussing

View More