
Square
Following
Hot
News
Profile
Share your thoughts
placeholder
Article
$QNT
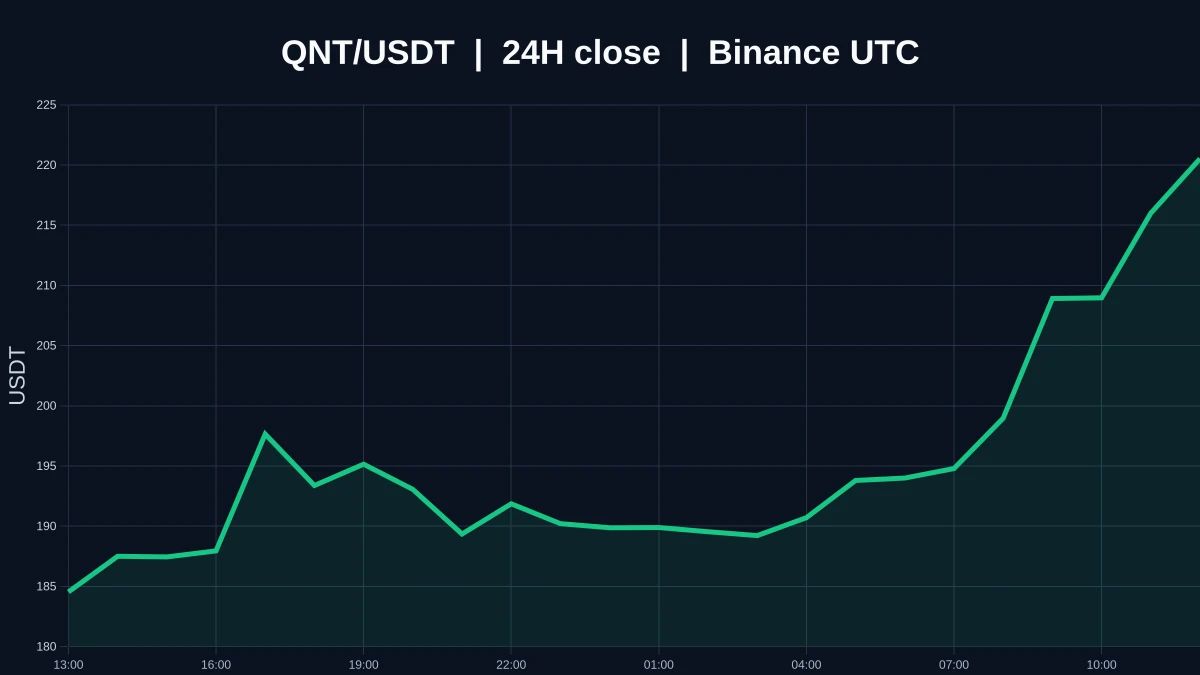
is stuck in an awkward phase, with the founder frantically moving funds to exchanges and retail traders trembling in fear. But the whales are still lurking in the market—who would dare open a heavily leveraged short? A huge bullish candle could teach you a lesson in minutes. Meme coins don’t dawdle; a major move is coming 😏🔥
post-image
QNT-4.22%
SOL one-hour timeframe: After bottoming out following the earlier sharp decline, the price staged a recovery rebound, but insufficient volume follow-through left it under pressure and unable to rise after touching the Bollinger middle band. Funds continue to flow out net, selling pressure remains, and rebound momentum is gradually fading. The overall larger trend remains downward, while weak correlation with BTC is weighing on the token’s performance. The middle band is clearly capping the upside, leaving limited room for a short-term rebound.
Trading recommendation: Short at 111-116, target 1
post-image
BTC-1.13%
$OGN ’s strength remains, and so does the rising crowding risk
$OGN 24-hour +85.19%, current price 0.04228. The 1-hour and 4-hour RSI are 62 and 77, respectively. The strength is real, and so is the crowding. The question is not whether it can continue moving higher, but who will be willing to catch it on the first pullback.
The bears also have clear invalidation lines. A break below the 1-hour support at 0.02243 would mean short-term buying support has failed the test; if the 4-hour support at 0.02034 is also broken, the previous assessment of strength or recovery must be rewritten. Views can
post-image
OGN+86.40%
◆ Morning Briefing · October 09
Bonjour. Welcome to Wall Street High Wealth Invest Channel.
Good morning.
【Core Conclusion】
The S&P 500 and Nasdaq experienced a slight Pullback after a sustained advance, constituting normal Consolidation following a Rally. Our position today is: do not chase highs, maintain position discipline, and wait for better entry points.
【Overnight Market】
U.S. stocks closed lower in the previous session, with the S&P 500 at 7,765.4, down 0.47%; Nasdaq at 27,193.3, down 1.25%; and the VIX closing at 15.4, up 2.19%. Over the past week, the S&P 500 is still up 1.29% cumul
post-image
US500+0.16%
ARK+5.74%
TSLA-0.68%
SPCX-4.18%
GN foxes 🦊🌗
Shill me an underrated #GEM you are scouting 💎
post-image
Smart money is quietly stacking SOXL while the 1h ATR screams consolidation.

$SOXL /USDT - LONG

Trade Plan:
Entry: 142.64 – 144.20
SL: 133.64
TP1: 150.75
TP2: 155.64
TP3: 162.97

Why this setup?
Why now? The 4h trend is range-bound, but the 15m RSI sits at 45.19, showing room for a bullish push without being overbought. The 1h ATR of 3.133575 confirms volatility is compressed, setting up for a potential explosive move. The entry zone at 143.42 aligns perfectly with the current 1h price action, offering a precise risk-defined opportunity. Targets are stacked at 150.75 for the first take-pr
SOXL-9.53%
Technical recovery after a sharp drop
10.9 BTC and ETH current review: market outlook reference
BTC’s 15-minute price has returned near the short-term moving averages. A short-term rebound does not represent a trend reversal, and the medium-term bearish structure remains intact
ETH is moving in sync with BTC. A recovery has emerged after the bearish move played out, but it is still insufficient to confirm a trend reversal
BTC and ETH are currently both experiencing technical rebounds after a sharp drop, with no clear reversal signals yet. For BTC, focus on whether 82,200 can be broken; for ETH
post-image
BTC-1.14%
ETH-3.57%
This profit has me feeling deeply uneasy, worried that the market will catch on tomorrow and blacklist me.
The last thing I looked at before bed was $BTC . Each rebound was weaker than the last, and the volume never followed—there was simply no one buying into the rise. My judgment was straightforward at the time: this wasn't a reversal to strength; it was an opportunity for people to unload. Hold the short and don't touch it.
When I opened the chart this morning, 84292.5 to 81642.6, +548.41% was already sitting there. It felt incredible—the earlier suffering was all worth it.
Pocket the bulk f
post-image
BTC-1.14%
ETH-3.57%
SOL-5.38%
# Samsung Q3 Operating Profit Soars 782.5% #每周来晒
Why can't Samsung's strong earnings support its stock price?
Samsung Electronics' preliminary Q3 earnings guidance released before the market opened handed global tech stocks the "strongest report card in history": quarterly operating profit surpassed the 100 trillion won mark for the first time, reaching 107.4 trillion won (approximately $80.1 billion), a year-on-year surge of 782.5%; sales were approximately 195 trillion won, up 126.6% year on year, setting a new record for the fourth consecutive quarter.
However, this report card not only
post-image
  • 5
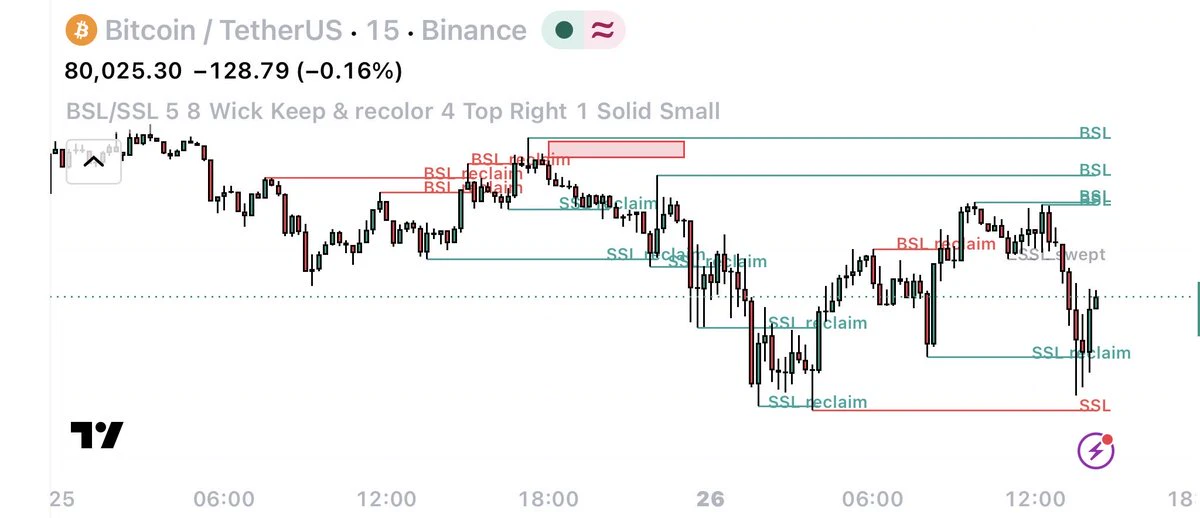
A brief analysis of BTC’s short-term trend from Dow Theory, Chan Theory, Elliott Wave Theory, volume-price relationships, order flow, and price action (strategy recommendations)
Comprehensive assessment
Dow Theory confirms that the downtrend sequence remains intact, with the rebound serving as an exit window
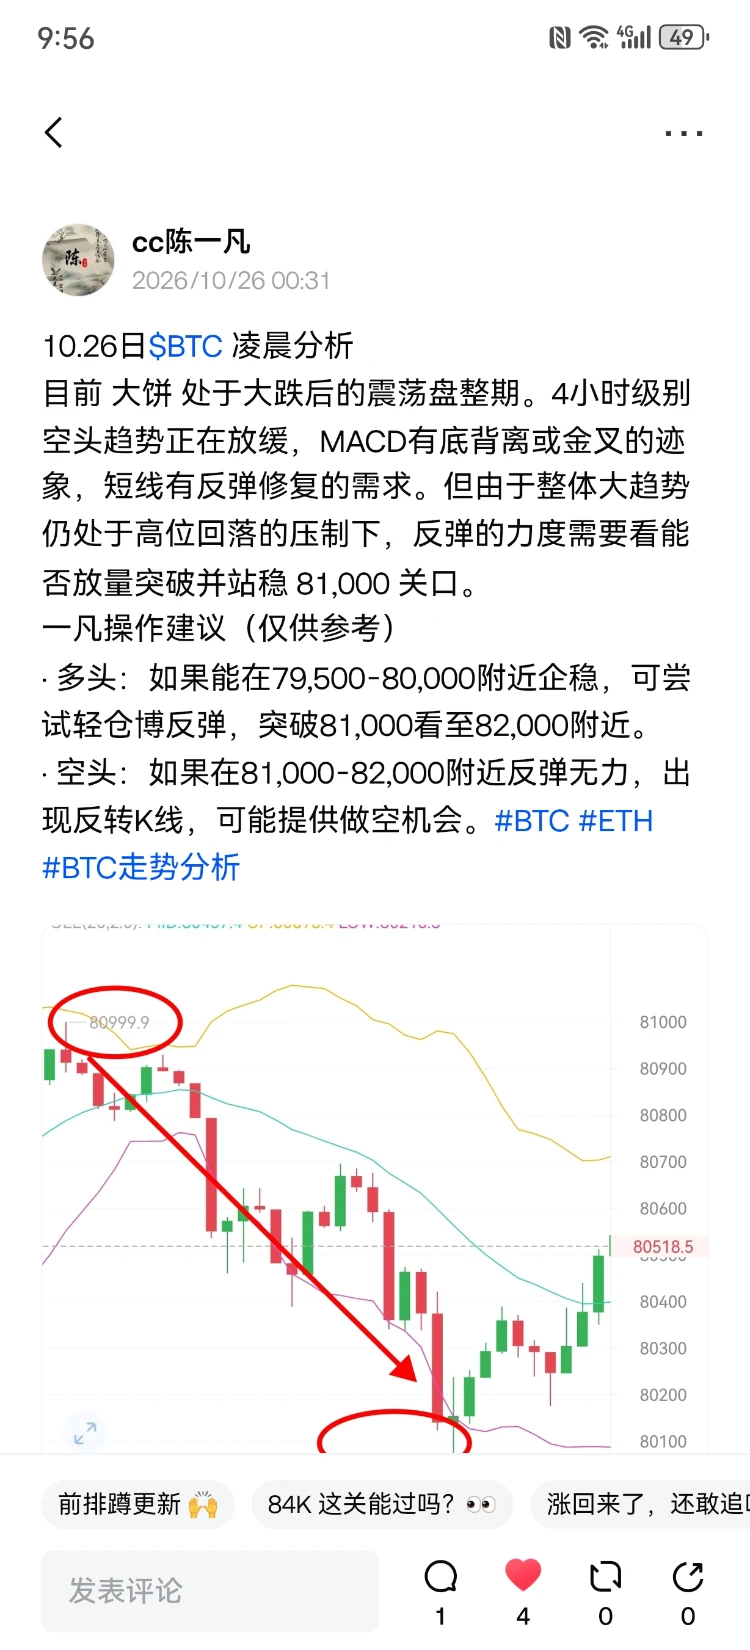
Chan Theory’s center of gravity is moving lower + bearish fractal alignment, with the C-5 target at 79,500-80,000
Elliott Wave Theory indicates the final decline of C-5, with 78,500-79,500 as the completion zone
After a $11 billion contraction over two days, volume has shrunk during the re
BTC-1.13%
The morning livestream starts at 9:15. Stay dry!
post-image
BTC Market Recap — October 9, 2026 Evening
A wick plunged to 80,400 and bounced back to 81,800 in 3 minutes: the night 190k people were liquidated—the truth wasn’t a dump
Last night, BTC plunged to 80,400 in a single wick and bounced back to 81,800 within minutes. $1.2 billion was liquidated over 24 hours, affecting 190k people, more than 90% of whom were long. Many people’s first reaction was: Did someone dump the market? No. This wick was caused by machines, not people.
‍
BTC-1.14%
BTC October 9 Market Analysis
1. The rise of wave 1 has most likely ended, and a wave 2 correction may come next. The larger bull-market cycle is not over, but major pullbacks can also occur within a bull market—even a correction to 72,000-75,000 is possible;
2. BTC in the 70,000s may have a chance to be seen again. In any case, it is now clear that key support has been breached. Consolidation is needed in the short term, and the probability of a direct V-shaped reversal is low. Personally, I believe the decline is not over yet, so do not go long for now; continue to focus on short positions d
post-image
BTC-1.13%
$ICP September trading volume ranked second globally, yet the token price fell 8.9%: bullish above 2.791
The September global public-chain trading volume rankings are out, with Solana and $ICP leading the way. Both processed over 3.8 billion transactions in a single month, with $ICP ranking second globally. Yet the market is cold: after the event, it moved from 2.927 to 2.926, barely budging. Second place paired with a cold market setup—I’m bullish here.
Currently at 2.933, down 8.9% over 24h, with an intraday range of 2.86–3.242; daily RSI is weak at 44.2, while the MACD bearish cross above
ICP-7.00%
Gold’s first intraday win
Above 4150, exited at 4155, 5 points, 832🔪$XAUT #GT三季度销毁近200万枚
post-image
XAUT+0.67%
BTC Scumbag Watch
Haven’t updated Bitcoin for several days.
Without further ado, let’s look at the chart.
Early this morning, Bitcoin broke through the range created by the big bullish candle on 9/21, and has now recovered slightly.
Looking at the liquidation chart, at yesterday’s wick point,
the scumbag will probably open a position at 78888, which is basically the 50% level of the big bullish candle on 9/18. Such a lucky number hahaha.
post-image
BTC-1.14%
We’re legendary across the entire internet—our results speak for themselves, so petty people can step aside.
post-image
Financial News, Crypto Updates, Real Trading Strategies
live-cover
LIVE880
[New Streamer] Market Prediction
live-cover
LIVE56
$WLD Conclusion first: The trend has not recovered; the rebound is a recovery rather than a reversal. The current bias is bearish: only buy dips within the range, and do not chase longs.
Use moving averages to determine whether the trend is healthy, focusing only on two things: the price’s position relative to the moving averages, and the arrangement of the short- and long-term moving averages. Currently, MA5=0.48182 is below MA20=0.49909, confirming a bearish alignment and indicating that the medium-term trend is still dominated by sellers. Any rebound will first face selling pressure near M
post-image
WLD-5.49%
LDO-10.83%
UNI-7.97%
Load More

Join 40 M users in our growing community

⚡️ Join 40 M users in the crypto craze discussion

💬 Engage with your favorite top creators

👍 See what interests you

Trending Topics

Gate Money Officially Launches

3.46k Views12.9k Discussing

Gate officially launches Gate Money, a global integrated financial services app that brings digital assets, fiat, stocks, ETFs, gold, bank accounts, and payments into one Gate App. Users can manage assets, invest, send and receive funds, convert currencies, and make payments — all from a single account. Which use case are you most excited about? [👉 Learn more](https://www.gate.com/announcements/article/102094)

Fed September Minutes Lean Hawkish

64.18k Views2.74k Discussing

Samsung Q3 Operating Profit Surges 782.5%

36.98k Views1.94k Discussing

View More