









#GateSquareNewCreatorProgram 🧧 Your first post could be the beginning of something bigger on Gate Square.
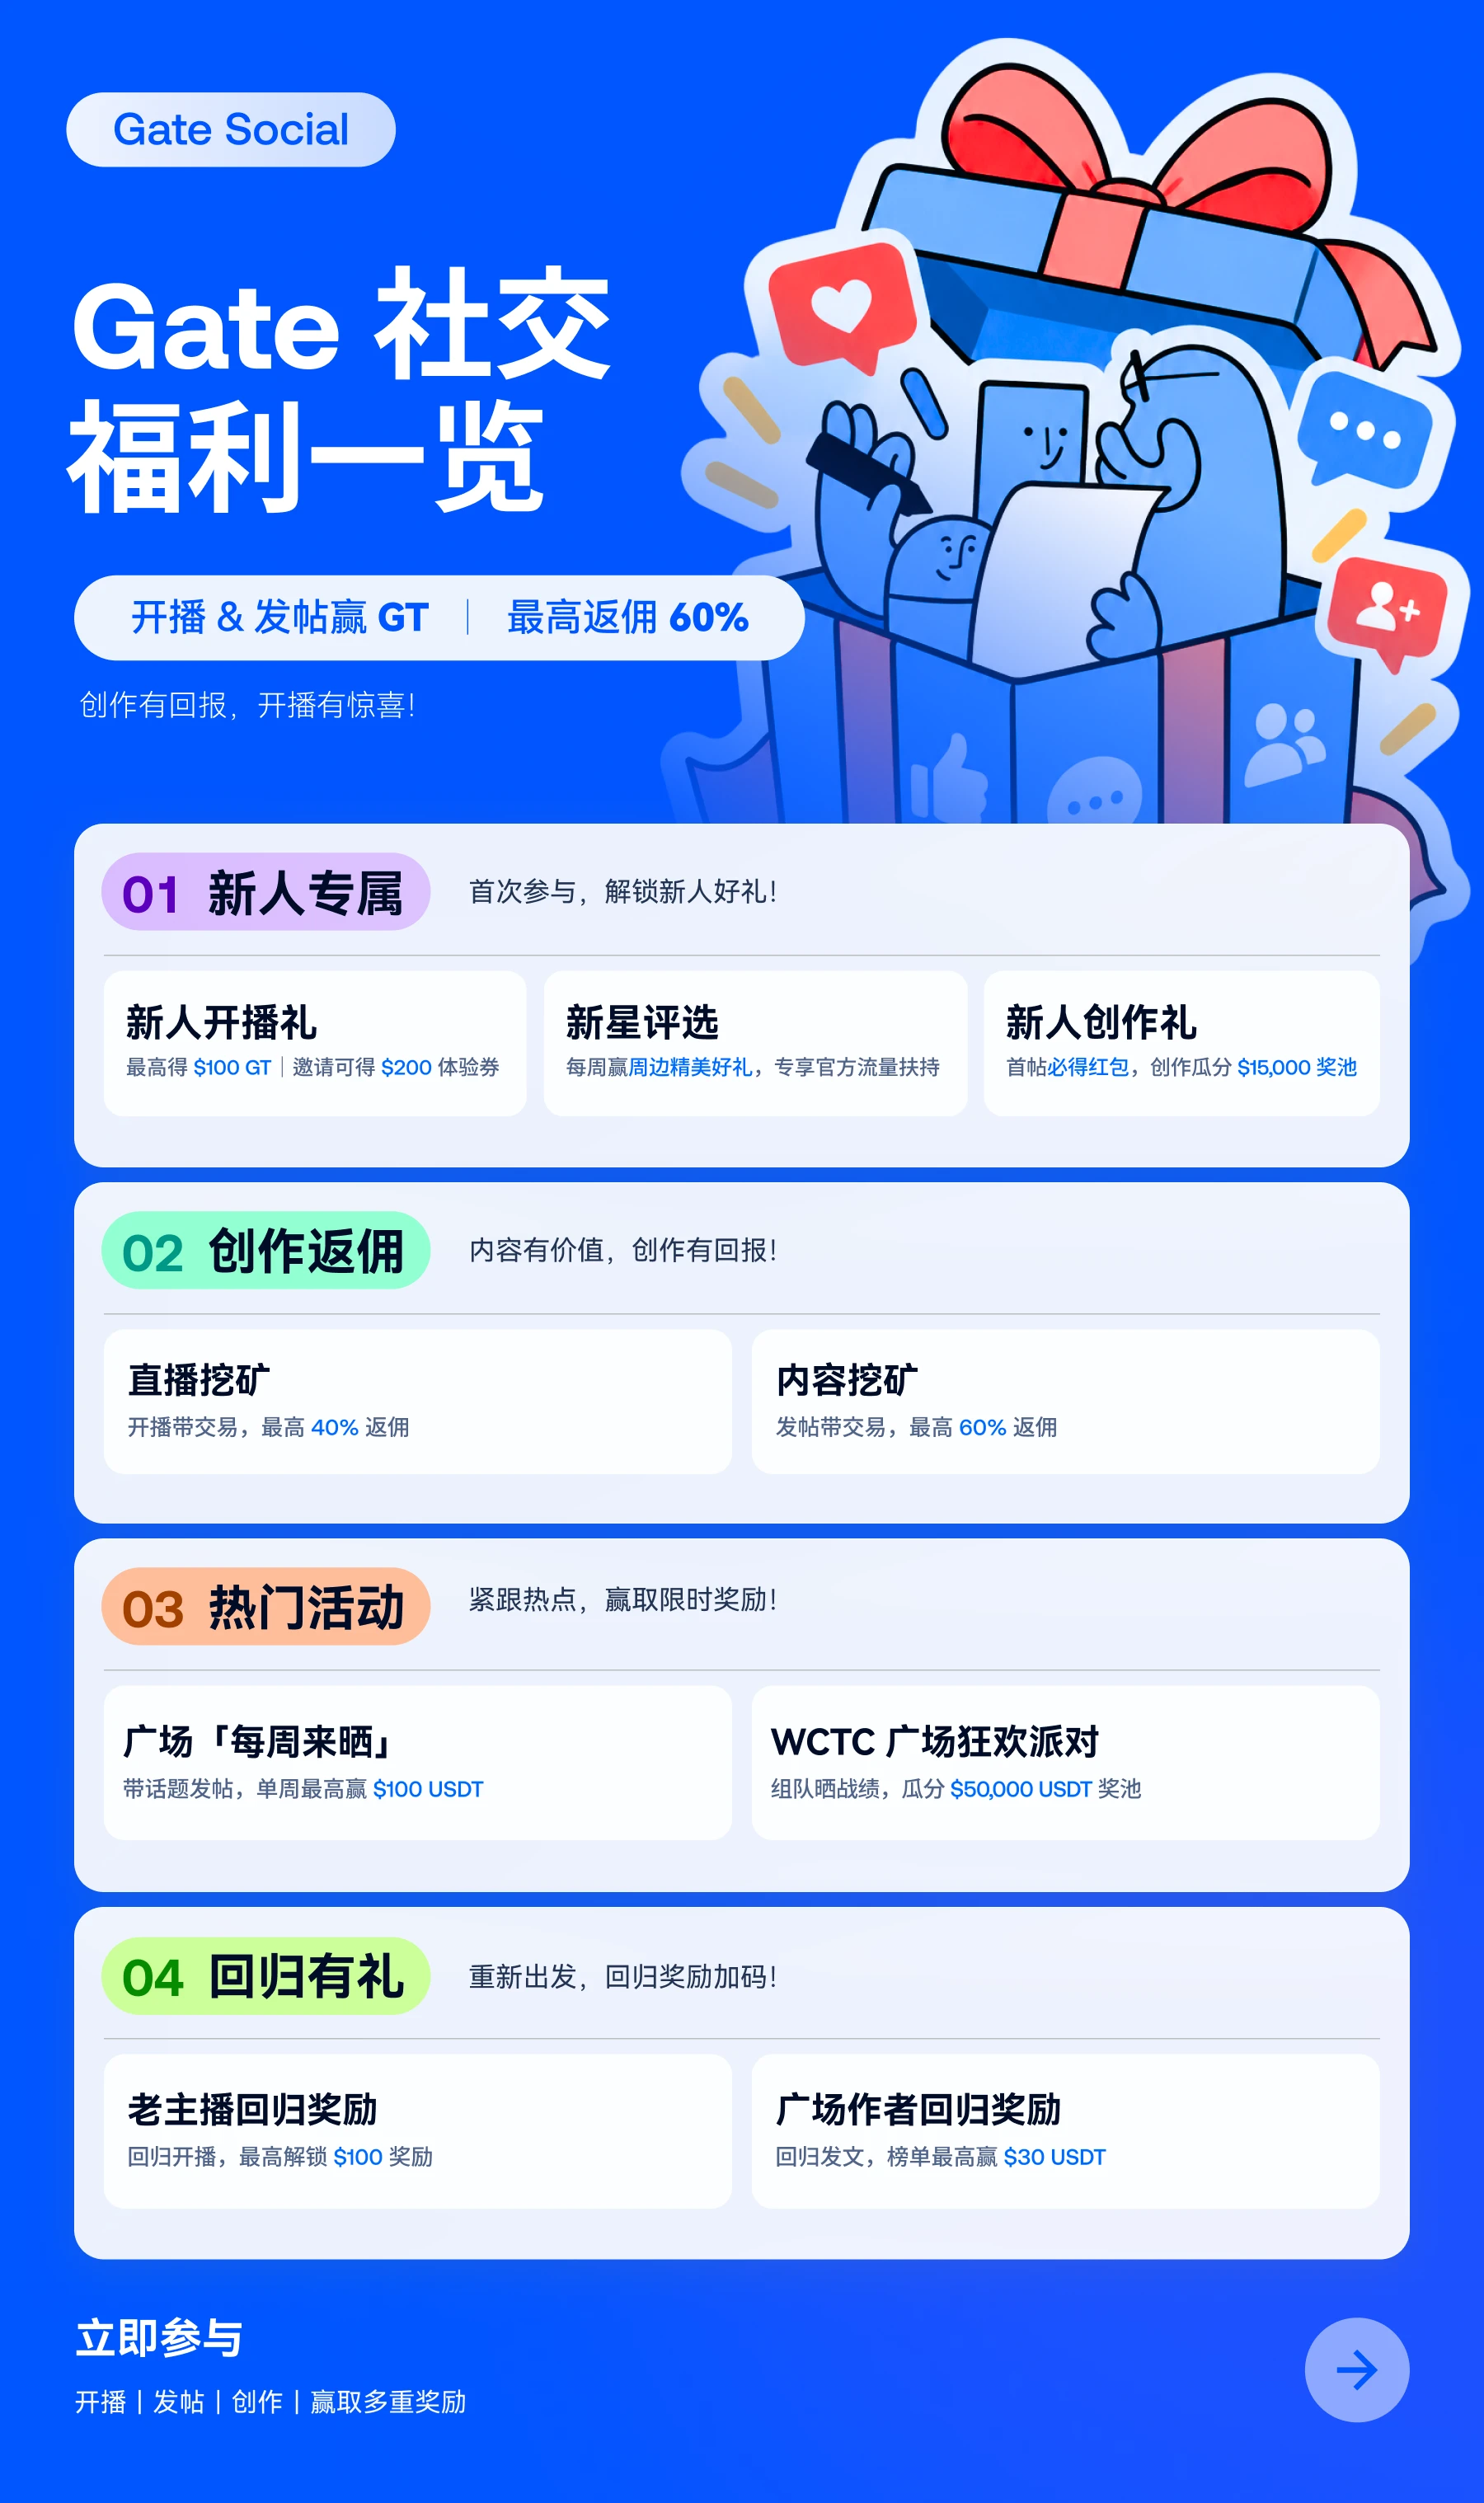
The Gate Square New Creator Program is live from October 15 to October 31, 2026, giving new creators an opportunity to turn market insights, trading experience, and original ideas into rewards. The campaign features first-post red packets, daily creator recognition, a leaderboard, and a share of 15,000 USDT in creator rewards and incentives.
The best part? You don't need to be a professional analyst to start. What matters is sharing useful information, explaining your reasoning, and creating content that gives other traders something meaningful to learn from.
🎁 **Start with your first-post reward**
New users who publish their first qualifying original post can receive a surprise reward packet, with rewards advertised up to 10 USDT. Available rewards include 3 USDT, token rewards worth 1 USDT, and position trial vouchers worth up to 10 USDT.
The reward is guaranteed for eligible first posts under the campaign rules, but the amount varies. Reward packets are limited and distributed on a first-come, first-served basis.
📊 **Quality matters more than posting just for numbers**
Gate Square also selects three outstanding new creators daily. Each selected creator receives a 100 USDT position trial voucher, along with opportunities for official likes, comments, featured recommendations, and additional visibility.
The evaluation focuses on three main areas:
• Content quality — 40%
• Engagement performance — 30%
• Valid views — 30%
That means original analysis, relevant data, clear reasoning, and readable writing can make a real difference. Repeated posts without useful information are not a substitute for quality.
🚀 **The consistency leaderboard brings bigger opportunities**
Creators who continue publishing qualifying original content can compete for additional rewards and Gate merchandise.
Top 1: Gate × Red Bull T-shirt plus a 500 USDT position trial voucher, requiring at least 30 valid posts.
Top 2: Gate car cup plus a 300 USDT position trial voucher, requiring at least 25 valid posts.
Top 3: Gate umbrella plus a 200 USDT position trial voucher, requiring at least 20 valid posts.
Ranks 4–10 can receive 200 USDT position trial vouchers, while ranks 11–50 can receive 100 USDT vouchers. Ranks 51–200 share a 4,500 USDT position trial voucher prize pool. Each tier has its own minimum posting requirement.
The consistency leaderboard is assessed using original post count, content quality, views, and engagement. Publishing more is helpful, but each post must still meet the campaign's validity standards.
💡 **What should you publish?**
Market analysis can explain BTC and ETH price movements, technical levels, and changes in market sentiment. Trading reviews can show how a strategy performed and what could be improved. Trending-topic analysis can connect economic news with crypto market reactions, while product reviews can share genuine Gate user experiences.
A strong post has a clear conclusion, relevant evidence, an explanation of the reasoning, and a realistic assessment of risks. Original thinking is more valuable than simply repeating a headline.
My takeaway: the first post gets you started, consistent quality creates opportunities, and useful analysis gives readers a reason to return.
The campaign runs until October 31, 2026. Eligible newcomers should review the official rules, complete their Gate Square profile, and publish original content that meets the requirements.
#GateSquare #NewCreatorProgram
The Gate Square New Creator Program is live from October 15 to October 31, 2026, giving new creators an opportunity to turn market insights, trading experience, and original ideas into rewards. The campaign features first-post red packets, daily creator recognition, a leaderboard, and a share of 15,000 USDT in creator rewards and incentives.
The best part? You don't need to be a professional analyst to start. What matters is sharing useful information, explaining your reasoning, and creating content that gives other traders something meaningful to learn from.
🎁 **Start with your first-post reward**
New users who publish their first qualifying original post can receive a surprise reward packet, with rewards advertised up to 10 USDT. Available rewards include 3 USDT, token rewards worth 1 USDT, and position trial vouchers worth up to 10 USDT.
The reward is guaranteed for eligible first posts under the campaign rules, but the amount varies. Reward packets are limited and distributed on a first-come, first-served basis.
📊 **Quality matters more than posting just for numbers**
Gate Square also selects three outstanding new creators daily. Each selected creator receives a 100 USDT position trial voucher, along with opportunities for official likes, comments, featured recommendations, and additional visibility.
The evaluation focuses on three main areas:
• Content quality — 40%
• Engagement performance — 30%
• Valid views — 30%
That means original analysis, relevant data, clear reasoning, and readable writing can make a real difference. Repeated posts without useful information are not a substitute for quality.
🚀 **The consistency leaderboard brings bigger opportunities**
Creators who continue publishing qualifying original content can compete for additional rewards and Gate merchandise.
Top 1: Gate × Red Bull T-shirt plus a 500 USDT position trial voucher, requiring at least 30 valid posts.
Top 2: Gate car cup plus a 300 USDT position trial voucher, requiring at least 25 valid posts.
Top 3: Gate umbrella plus a 200 USDT position trial voucher, requiring at least 20 valid posts.
Ranks 4–10 can receive 200 USDT position trial vouchers, while ranks 11–50 can receive 100 USDT vouchers. Ranks 51–200 share a 4,500 USDT position trial voucher prize pool. Each tier has its own minimum posting requirement.
The consistency leaderboard is assessed using original post count, content quality, views, and engagement. Publishing more is helpful, but each post must still meet the campaign's validity standards.
💡 **What should you publish?**
Market analysis can explain BTC and ETH price movements, technical levels, and changes in market sentiment. Trading reviews can show how a strategy performed and what could be improved. Trending-topic analysis can connect economic news with crypto market reactions, while product reviews can share genuine Gate user experiences.
A strong post has a clear conclusion, relevant evidence, an explanation of the reasoning, and a realistic assessment of risks. Original thinking is more valuable than simply repeating a headline.
My takeaway: the first post gets you started, consistent quality creates opportunities, and useful analysis gives readers a reason to return.
The campaign runs until October 31, 2026. Eligible newcomers should review the official rules, complete their Gate Square profile, and publish original content that meets the requirements.
#GateSquare #NewCreatorProgram