Square
Following
Hot
News
Notifications
Profile
Share your thoughts
placeholder
Article
$MU Shares of Micron Technology, Inc. (NASDAQ: MU) closed at $690.00 at the end of the latest trading session on Friday, November 6, 2026. The stock rose strongly by +5.12% (+33.61 USD) from the previous close ($656.39)
MU+4.71%
Oh, beloved village, I’m leaving the city behind
Trenches
ZIG
Z
bade
b
ZIG
0x8c...1145
Market Cap
$.
Change
.
24h Vol
$
Holders
.
STONK
S
bade
b
STONK
6GmA...UNgx
Market Cap
$.
Change
.
24h Vol
$.
Holders
.
CLAUDIA
C
bade
b
CLAUDIA
2j5S...W2ZM
Market Cap
$.
Change
.
24h Vol
$.
Holders
.
BTC
B
bade
b
BTC
C5xp...pump
Market Cap
$.
Change
.
24h Vol
$.
Holders
.
FLOAT
F
bade
b
FLOAT
Bv1a...BMmr
Market Cap
$.
Change
.
24h Vol
$.
Holders
.
Risk Takers, This Is For You.
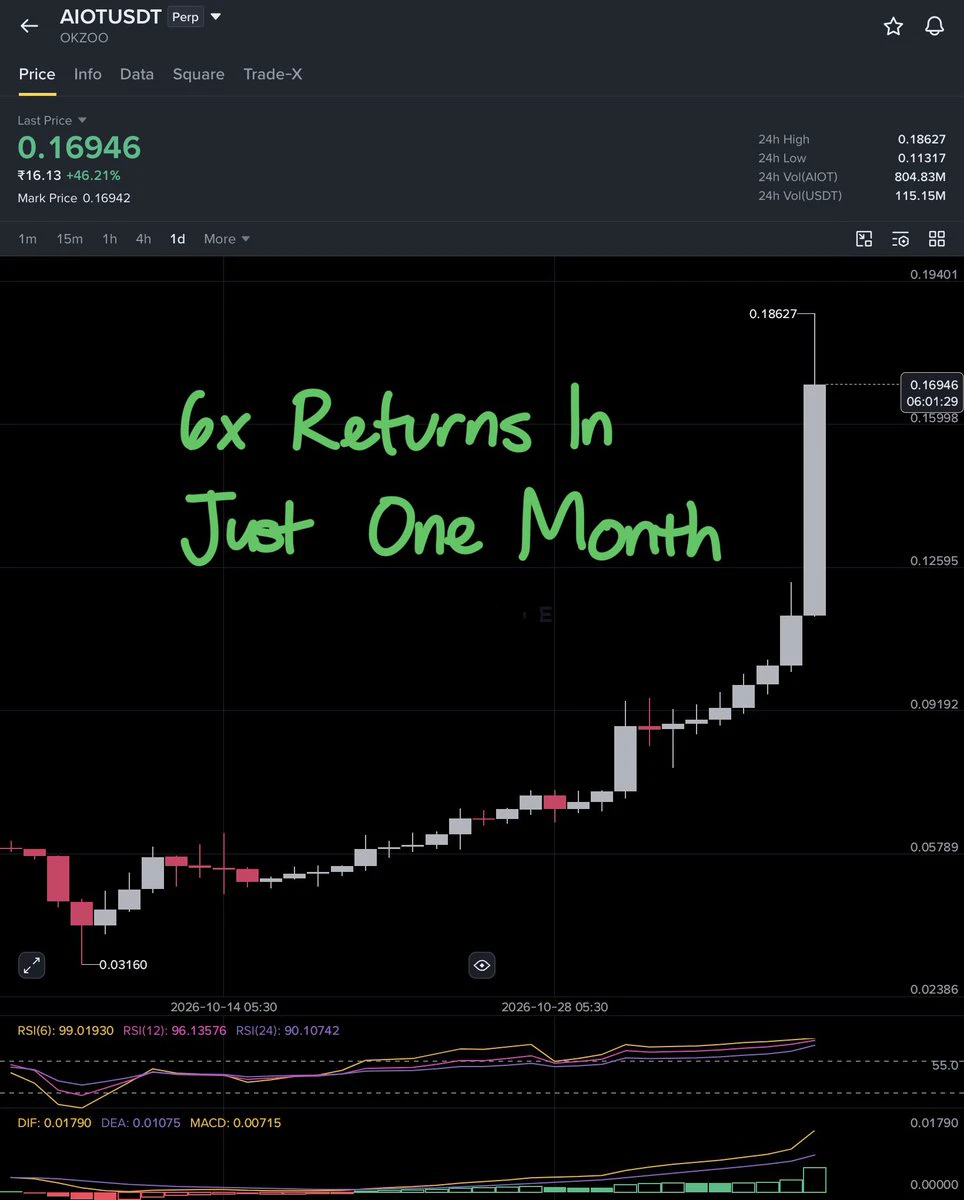
$AIOT went to 0.18627 today, but one month ago it was just 0.03160. That is almost a 600% pump. It’s too late for a safe entry, but momentum is still building upside. We may see 0.2-0.25 at least. 0.3 is also in play; if it happens, that’s a 10x pump in just one month. A big milestone, maybe loading.
The structure may weaken if price loses 0.13. A short-term pullback is possible towards 0.15-0.13, I guess.
Always remember, when you’re riding a wild horse, ride strongly until you’re in a safe and comfortable zone. Once you think you can’t handle it anymore, then ex
post-image
AIOT-2.28%
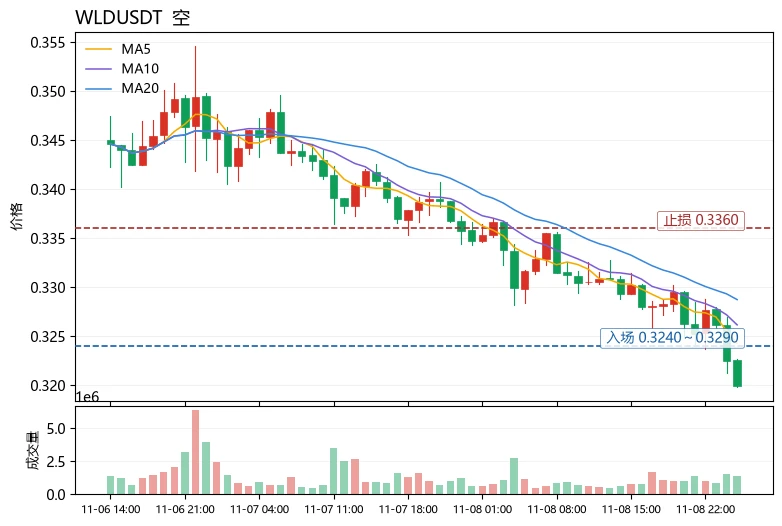
$WLD Current price is 0.3199, below the lower Bollinger Band at 0.321834. MA5 at 0.3243 is below MA20 at 0.328745, with short-term moving averages in a bearish alignment. RSI is just 27.1, in oversold territory but with no divergence yet. The MACD histogram at -0.0004331 continues to show bearish momentum. The range over 30 candlesticks is about 6.53%, indicating medium-high volatility. The funding rate is -0.0157%, meaning shorts pay longs and suggesting short positions are already crowded, making it less attractive to chase the decline; the Fear & Greed Index is 28, reflecting fearful marke
post-image
WLD-5.61%
BNB-0.76%
LINK-0.18%
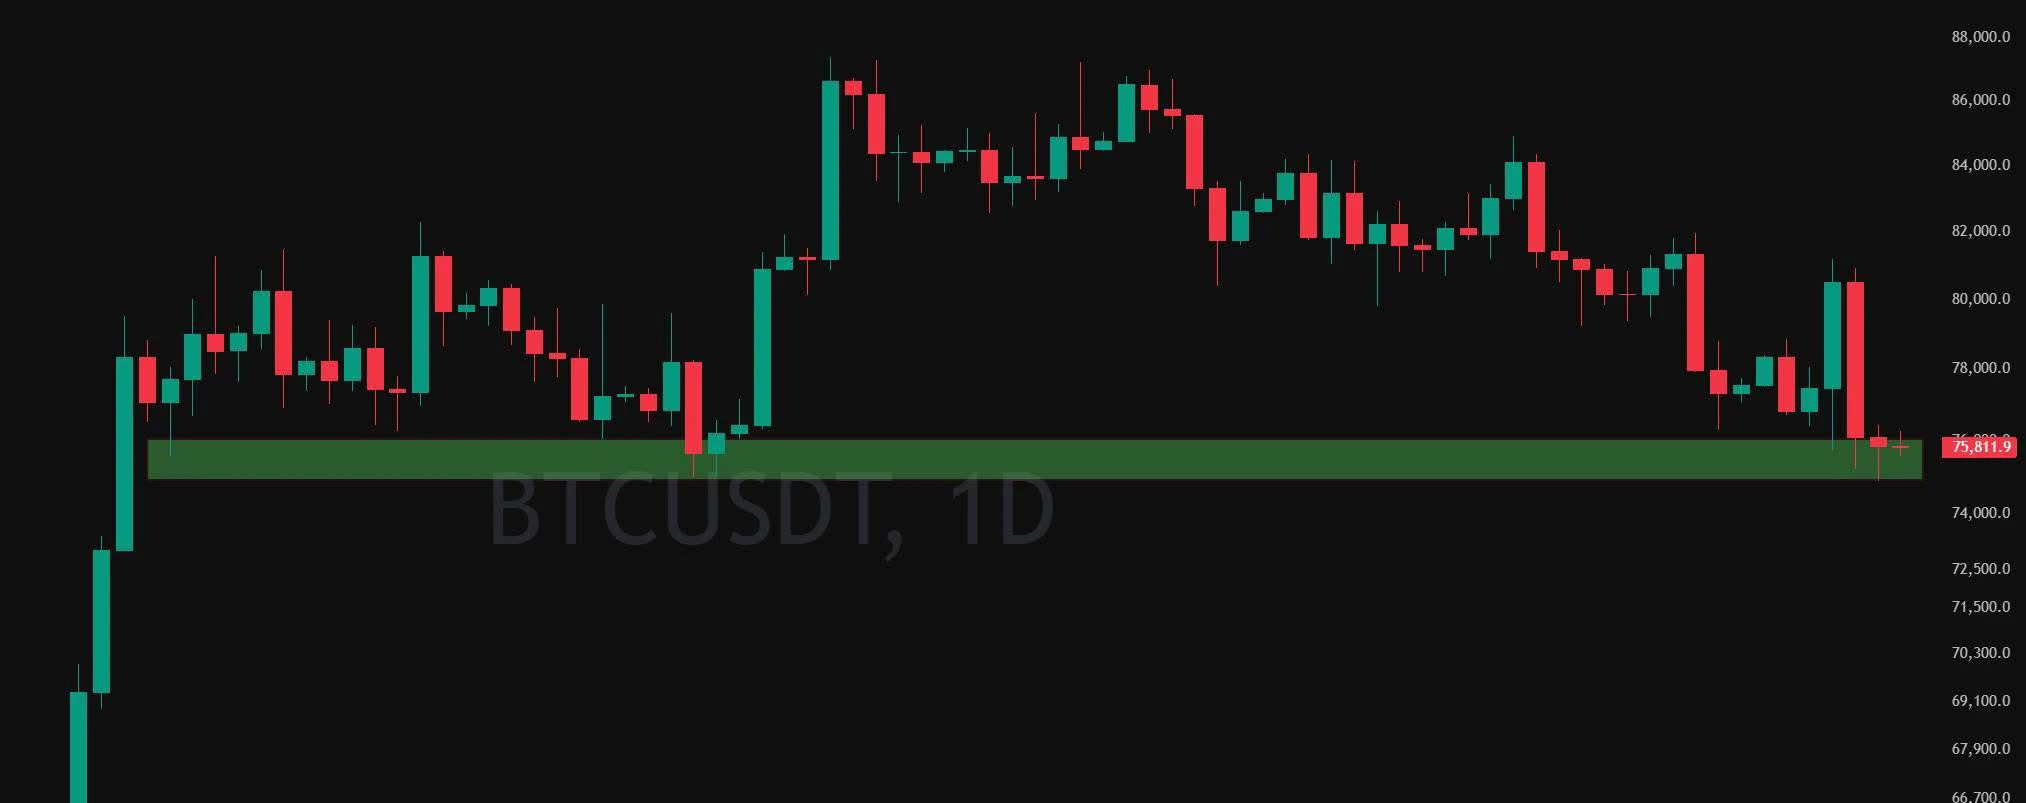
BTC MARKET prediction
live-cover
LIVE1,507
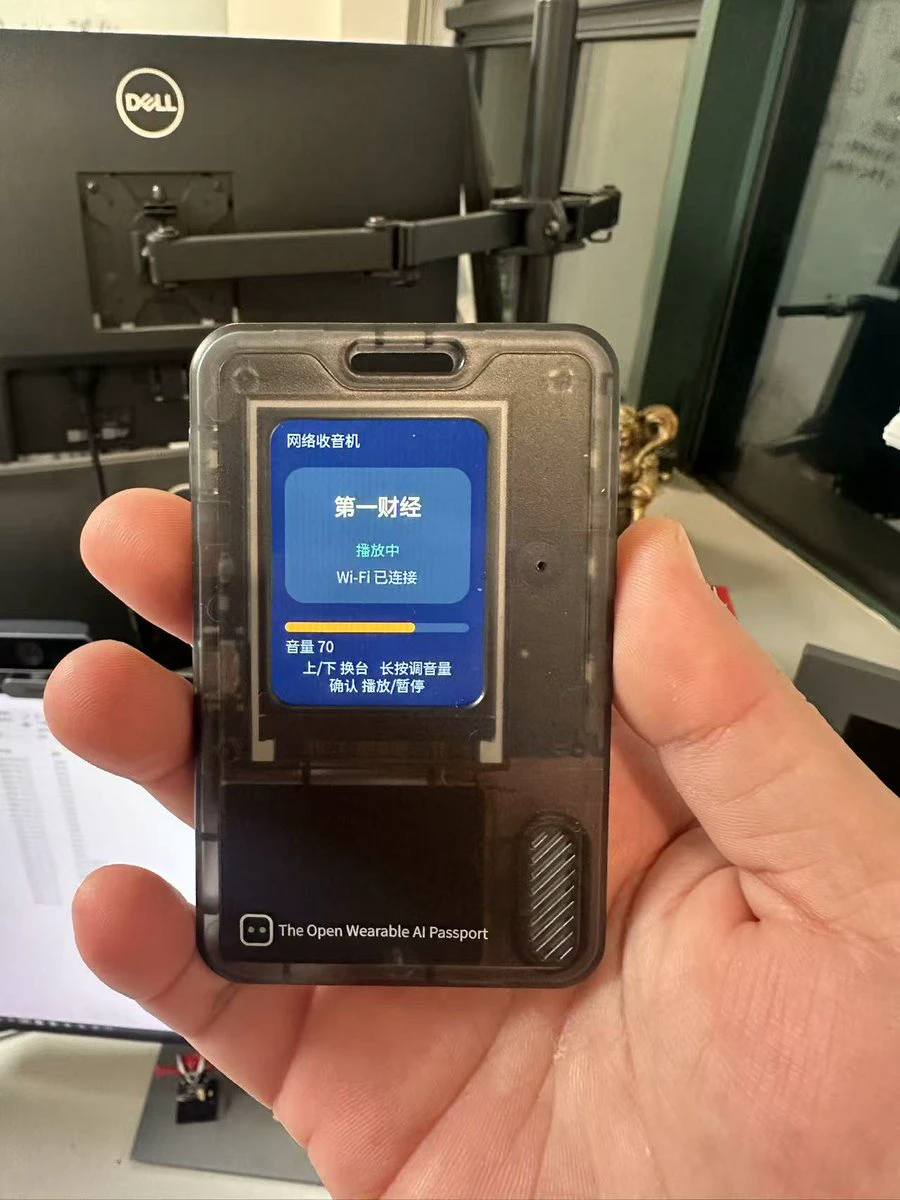
This thing's hardware is way too weak... It's just a badge 😂

Smooth video playback is pretty much impossible. After going around in circles, we still ended up reinventing the wheel.
post-image
GN to those who GN💤
post-image
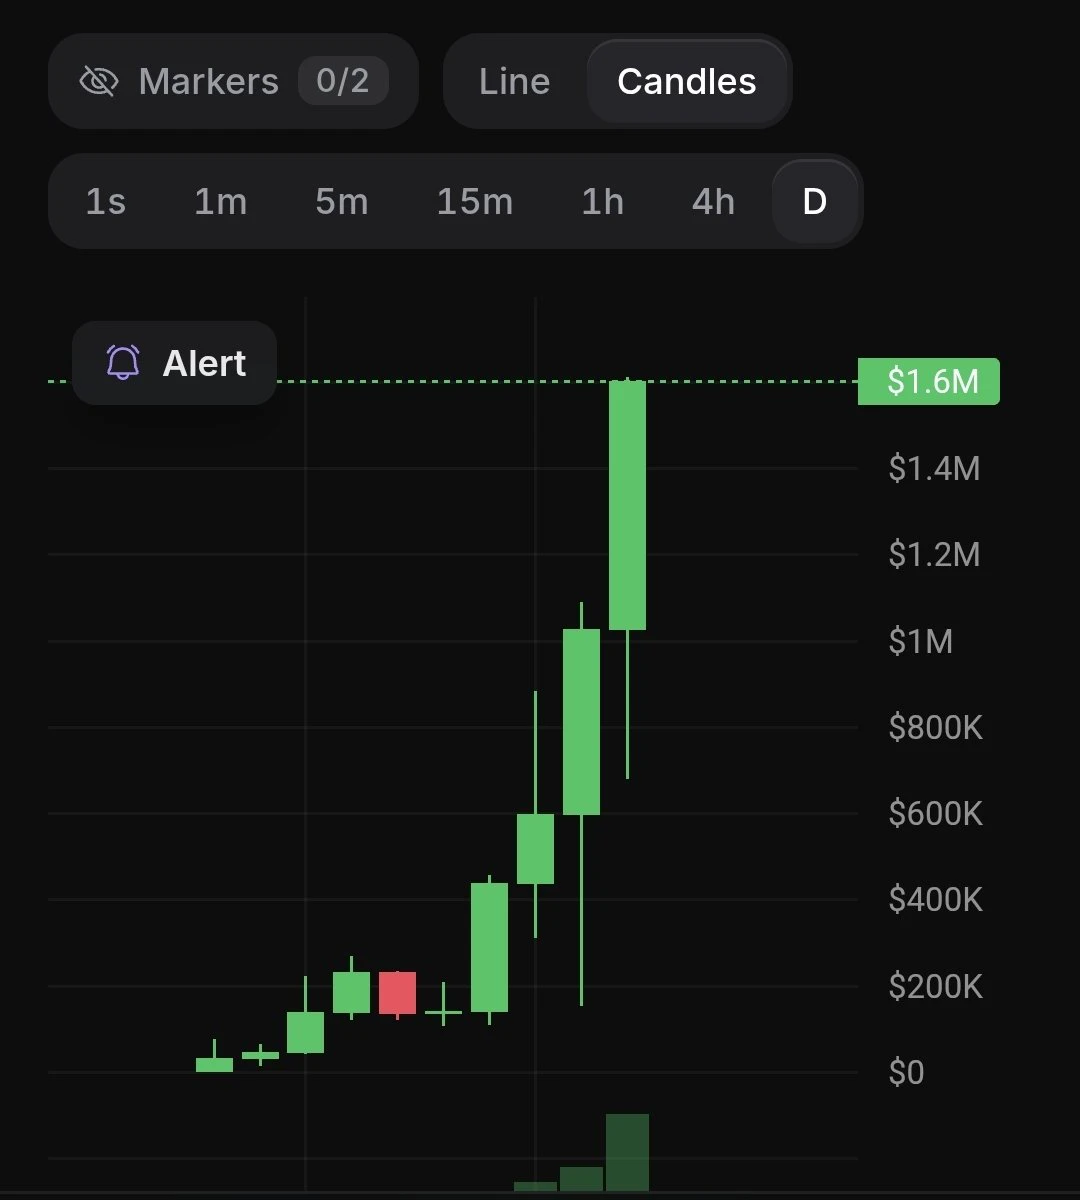
$AGORA preparing for mainnet launch......
What a beast 🔥🔥🔥
post-image
the image lost its pixels but gained a political career
radbro
post-image
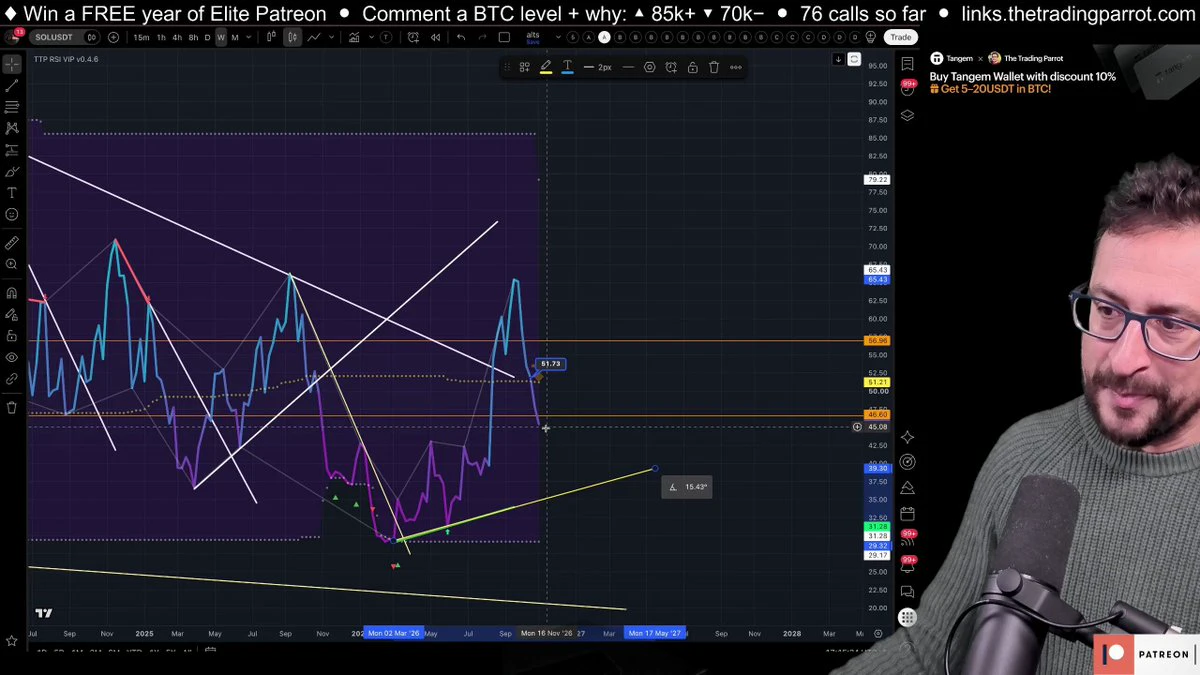
Solana is sitting on weekly support at $87, with the point of control at $86. The weekly RSI has come down from 65 to 45, and Mariano explains where it would meet its own support (35 to 36). At 5:24 in the video.
#Solana #SOL #Crypto #RSI
post-image
SOL-0.77%
Bitcoin fell about 5% today, while TRX barely moved. HYPE and OKB each slid more than 4%. Overall risk appetite remains subdued, but fund flows suggest this is not a broad-based flight to safety.
$TR is currently around $0.318, with minimal movement over the past 24 hours. The $0.315–$0.316 range forms the first line of defense, while $0.321–$0.324 presents resistance. A sustained recovery above $0.325 could open the door to a rebound; if $0.312 gives way, watch for the pullback to continue. TRX has recently held up noticeably better than the broader market.

$HYP is currently around $78.7,
post-image
OKB+1.38%
$RSR It’s thousands of kilometers away from my entry price $RSR
post-image
RSR-1.93%
I just came across a message and was completely stunned—is this actually true or not?
Let me make my stance clear first: I'm bullish, no hesitation.
$SOX $BNB $BTC I'm keeping an eye on all three of these assets.
I took a quick look at the trading ledger for the past 90 days, and the numbers speak for themselves: +1,500.08+66.06%
Now let's look at their short-term performance: $BNB +0.18%$BTC -0.17%$SOXL +0.24%
Let's set aside whether the news is true or not—positions and profits and losses don't lie. A 66% return over 90 days comes not from chasing news, but from holding steady and reading t
post-image
BTC-0.67%
The Options Market’s “Chain-Reaction Meltdown” — Why Was This Sell-Off So Relentless?

Guys, many people are wondering: Sure, U.S. stocks fell, but how could the Nasdaq drop 5.5% in a single day, while the Philadelphia Semiconductor Index plunged 12%? Did all the institutions in the market somehow agree to dump everything on the same day?

Actually, behind this lies an extremely brutal mechanism: options market makers’ “Gamma squeeze.”

Before this crash, large numbers of retail traders and institutions bought call options, thinking AI stocks could keep rising. To hedge the risk of selling tho
NVDA+2.80%
Will global markets see a “bloodbath” or a “surge” next week? Don’t rush to buy the dip before these 3 data releases!

⏰ 11/10 (Tue) 21:30|U.S. October CPI: Pricing of the Fed’s December rate-cut path. A lower-than-expected reading could spark a rebound, while a higher-than-expected reading could trigger a second wave of selling.

⏰ 11/13 (Fri) 21:30|U.S. October PPI release: A preview of costs on the corporate side, determining whether expectations for AI infrastructure profit margins will take a hit.

⏰ 11/14 (Sat) 05:00|U.S. stocks close Friday (positioning ahead of Nvidia earnings): The op
post-image
BTC-0.65%
Financial knowledge is common.
The rare edge is behaving well when prices fall and headlines scream.
Most permanent losses come from selling during temporary volatility, not from the market itself.
Patience under pressure is the skill that actually compounds.
Knowledge without composure is just expensive entertainment.
post-image
KOR Launches CandyDrop, Offering 18,000,000 KOR

https://www.gate.com/share/act/373fc617
post-image
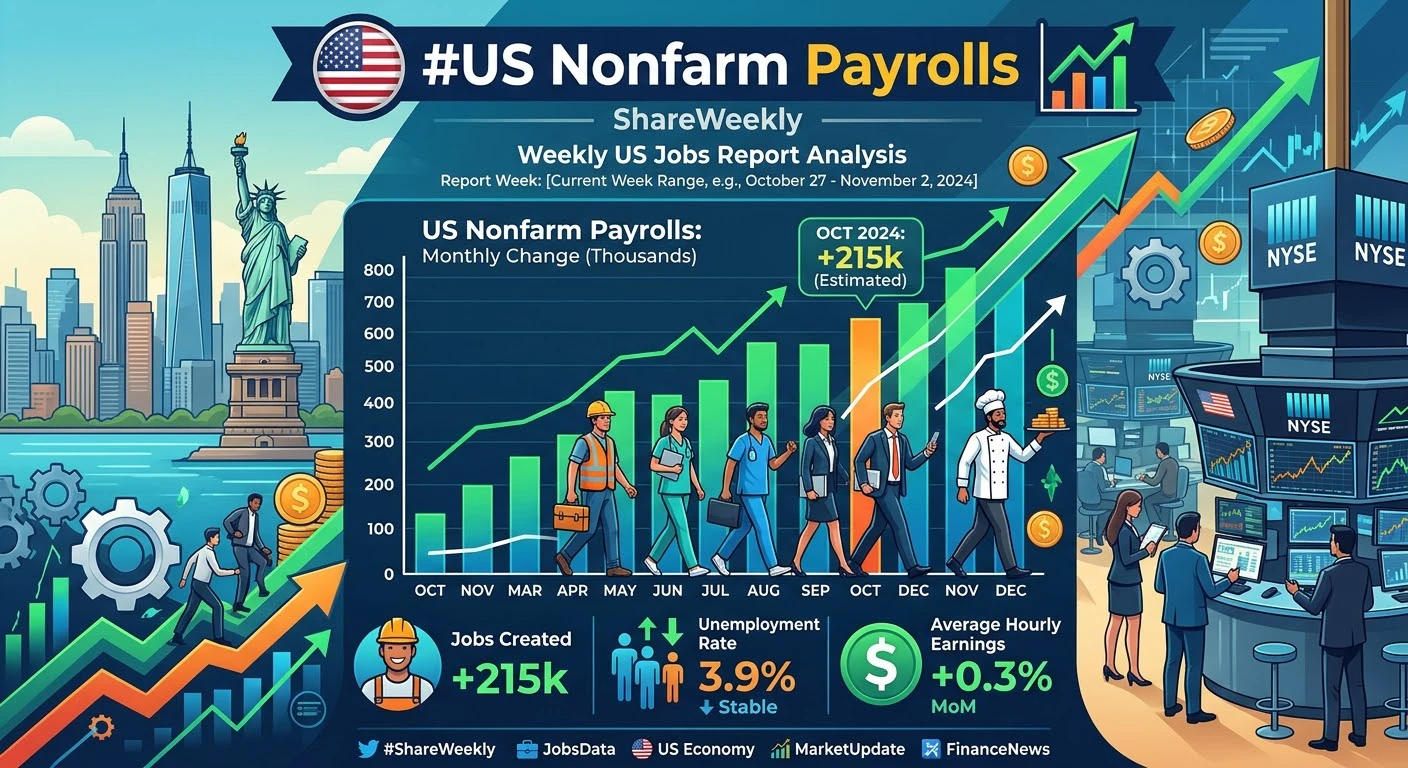
#USNonfarmPayrolls #ShareWeekly
US Nonfarm Payrolls: A Critical Indicator for the Global Financial Markets
The U.S. Nonfarm Payrolls (NFP) report is one of the most influential economic indicators in global financial markets. Released monthly by the U.S. Bureau of Labor Statistics, this report measures the number of jobs added or lost across the U.S. economy, excluding agricultural workers, private household employees, and certain other categories.
Why Nonfarm Payrolls Matter
Nonfarm Payrolls provide valuable insights into the health of the U.S. labor market and the overall economy. Strong em
post-image
BTC-0.67%
XAU+0.38%
On Monday, November 9, several economic data releases and central bank officials’ speeches are worth watching. At 9:30 Beijing time, China’s October CPI annual rate will be released, reflecting domestic inflation. At 15:00, Germany’s September seasonally adjusted trade balance will be released; at 17:30, the Eurozone’s November Sentix Investor Confidence Index will be published. At 23:00, the U.S. September wholesale sales month-over-month rate will be released, while Federal Reserve’s Goolsbee speaks. At 00:00 the following day, the U.S. October New York Fed 1-year inflation expectations data
Load More

Join 40 M users in our growing community

⚡️ Join 40 M users in the crypto craze discussion

💬 Engage with your favorite top creators

👍 See what interests you

Trending Topics

USCPIDataIncoming

13.55k Views1.64k Discussing

The U.S. October CPI report will be released on November 10 at 8:30 a.m. ET. September CPI came in at 3.7% year over year, and markets will be watching closely for signs that inflation is cooling, especially in core CPI. A softer-than-expected reading could strengthen rate-cut expectations, while hotter inflation may pressure risk assets through higher Treasury yields and a stronger dollar. How do you think this CPI print will move $BTC, U.S. stocks and gold?

USAIStocksHitHard

28.45k Views3.74k Discussing

USNonfarmPayrolls

54.47k Views4.49k Discussing

View More