Square
Following
Hot
News
Profile
Share your thoughts
placeholder
Article
Find opportunities in $DOGE using price-volume confirmation; key levels and exit lines are here
What stands out most in this $DOGE chart is not the 2.33% 24-hour decline itself, but that the 1-hour and 4-hour charts are both weak yet haven’t delivered the same answer.
My view is that direction is taking shape for now, but low participation has reduced the credibility of this move.
$DOGE The current price is 0.07917, with a 24-hour range of 0.07702–0.08107. The 1-hour support is at 0.07702, with resistance at 0.08096; the two more distant 4-hour boundaries are 0.07702 and 0.08566. These numbers
post-image
DOGE-1.74%
Trenches
AGT
A
bade
b
AGT
0x5d...e274
Market Cap
$.
Change
.
24h Vol
$.
Holders
.
CNPY
C
bade
b
CNPY
0xc6...ddd2
Market Cap
$.
Change
.
24h Vol
$.
Holders
.
COVENANT
C
bade
b
COVENANT
0xcd...de79
Market Cap
$.
Change
.
24h Vol
$.
Holders
Q
Q
bade
b
Q
0xc0...0589
Market Cap
$.
Change
.
24h Vol
$.
Holders
.
Gato
G
bade
b
Gato
55A3...pump
Market Cap
$.
Change
.
24h Vol
$.
Holders
.
Next week: October 19 (Monday) — October 25 (Sunday) Daily Macro + Geopolitical Preview

Sources: CCTV, Cailian Press, Federal Reserve website, public schedules

✅October 19 Monday
📊Macro: The Financial Street Forum Annual Conference opens, with senior officials from the PBOC, SAFE, and CSRC delivering policy speeches; the Federal Reserve holds a closed-door discount rate meeting
🌍Geopolitics: Ukraine-U.S. talks may begin; the European Parliament opens discussions on Black Sea shipping security

✅October 20 Tuesday
📊Macro: China announces its LPR loan prime rate; closed-door meeting of F
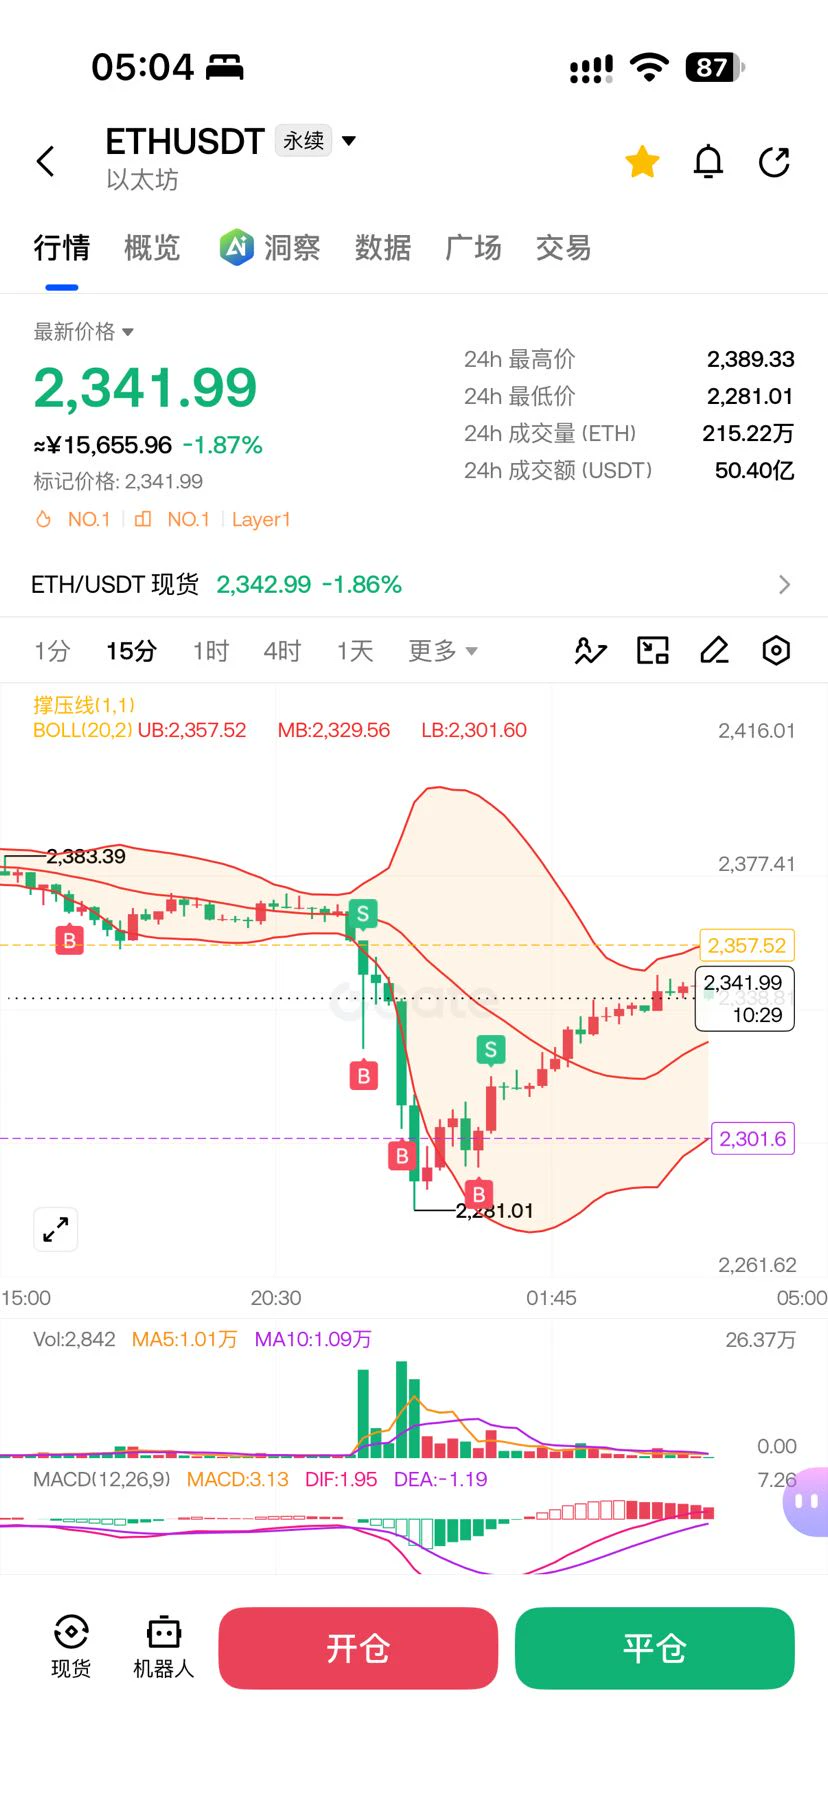
10.17$ETH
Last night's market action was like riding a roller coaster
Longs launched a fierce attack, then suddenly collapsed, smashing straight through 2400
Upside momentum faded; I cut losses decisively in time, exited at breakeven, and avoided a deep pullback
Price is now stuck in a narrow 2415-2425 range
Moving averages are converging near 2420, with bulls and bears evenly matched
Volatility is under 10 points—the calm before the storm!
The range is tightening and building momentum, with a major one-way breakout imminent
Watch the range closely; once volume expands and direction emerges,
post-image
ETH-0.88%
The morning sunlight shines on the flower’s center,
making it especially radiant.
May your mood bloom like a flower
🐷🐷🐷🐷
post-image
Gate square new creator Share to win red packet
post-image
Crypto Market update BTC
live-cover
LIVE1,927
$ETH is currently at 2,396.89, down 1.15% over 24 hours, with volume at 0.12 times the average over the past 20 candles. Put these figures together, and the key point to explain is that $ETH’s price has already moved, but trading activity and volume have not followed.
One verifiable update: Gate’s official announcement reads, “Gate Research: Corporate Earnings Support U.S. Stocks, KR1 Launches Ethereum Validator Nodes…”. It may explain why people are paying attention, but it cannot answer which way the price will move.
You can tentatively trust the direction, but not assume the move will conti
post-image
ETH-0.88%
Let’s start with a term: weekend gold prices.
The $XAU on screen isn’t gold moving now; it’s quotes with no takers shifting around.
Only 5.97 million traded in the last hour, compared with 150 million in a single hour a few days ago.
“Breaking above 4205 means a new rally.”
I’ve heard that twice in the past three days. Here are the numbers:
1. 4205.65 was touched only once, at 10-16 22:00, and it hasn’t gone higher since.
2. Since then, over the past 34 hours, it has steadily ground back to 4164.07.
3. The 24-hour range is 4157.36 to 4173.66, a spread of 0.39%.
With a range this narrow, it’s
post-image
XAU-0.19%
#日韩股集体大跌
KOSPI +3.3%: A relief bounce or the start of a recovery?
My initial assessment: This appears to be a potential relief rally; however, a single strong session is not enough to confirm a broader recovery. The key question is whether semiconductor stocks can sustain this rebound following the sharp sell-off, or if the gains are merely driven by short covering and bargain hunting.
The gains seen in Samsung Electronics (+3.6%) and SK Hynix (+3.4%) are particularly significant, as the South Korean market is highly sensitive to semiconductor sentiment and the global AI-memory trade.
What is
post-image
ybaser
#日韩股集体大跌
KOSPI +3.3%: A relief bounce or the start of a recovery?
My initial assessment: This appears to be a potential relief rally; however, a single strong session is not enough to confirm a broader recovery. The key question is whether semiconductor stocks can sustain this rebound following the sharp sell-off, or if the gains are merely driven by short covering and bargain hunting.
The gains seen in Samsung Electronics (+3.6%) and SK Hynix (+3.4%) are particularly significant, as the South Korean market is highly sensitive to semiconductor sentiment and the global AI-memory trade.
What is driving the recovery?
1. The sell-off may have overshot the fundamentals
On October 15, the KOSPI fell by 7.57%, closing at a six-month low following seven consecutive days of losses. During this sell-off, Samsung and SK Hynix lost 23.9% and 31.5% of their value, respectively—creating an opening for bargain hunters to return.
2. Memory chip fundamentals remain supportive
Analysts continue to highlight tight memory supply, robust demand related to artificial intelligence, and expectations for rising DRAM prices. This supports the view that the sell-off was driven more by sentiment and positioning than by a collapse in earnings expectations.
3. Global risk appetite has improved
A recovery in U.S. equities, combined with easing concerns regarding AI-related credit risks, has helped fuel a rebound in Asian technology stocks. However, concerns regarding returns on investment in artificial intelligence, financing costs, and interest rates have not dissipated.
A relief rally or a sustainable recovery?
Bullish scenario — a lasting recovery
* The KOSPI remains above its recent low.
* Samsung and SK Hynix continue their recovery.
* Foreign investors return as net buyers.
* Earnings forecasts and expectations for memory chip prices remain robust.
Bearish scenario — a short-lived rebound
* The index rises toward a resistance level and then reverses.
* Foreign investors continue to sell Korean stocks.
* U.S. bond yields rise, or renewed concerns regarding AI valuations weigh on chip stocks.
* Samsung and SK Hynix fall back below their recovery levels.
What should investors watch for next?
The most critical indicator is not the magnitude of the initial rebound, but whether buying pressure is sustained.
Indicator Bullish interpretation
Foreign investor flows Consistent net buying
Samsung and SK Hynix Gains sustained over several sessions
Memory chip pricing Continued strength in DRAM and HBM
U.S. Treasury yields Stabilization or decline
Earnings expectations Maintenance of upward revisions
A key distinction: On October 16, the KOSPI recorded an intraday gain of up to 3.17%, but closed the day up 2.05% at 5,668.05. Consequently, the sharp intraday rally made the final gain at the close appear more significant than it actually was.
My View
Short-term: Cautiously optimistic
A recovery is possible.
Oversold conditions and attractive entry points could support further gains, though volatility is likely to remain high.
Medium-term: Conditional
Not yet confirmed.
A more substantial recovery would require the stabilization of foreign investor inflows, supportive earnings data, and a more durable improvement in sentiment toward the global technology market.
In summary: I view the 3.3% move not as proof that the downtrend has ended, but as a promising first step. Earnings expectations for the semiconductor sector provide a firmer foundation for this recovery—moving it beyond a mere technical rebound—but the market must demonstrate that buyers are willing to hold their positions, even amidst renewed volatility.
A key factor to watch in the near term will be the earnings outlooks from SK Hynix and Samsung Electronics, set to be released on October 28 and October 29, respectively. These reports could prove decisive in determining whether the recent sell-off was an overreaction or if it reflects a more fundamental reassessment of the AI-driven memory market.
$MU ‌
$SNDK ‌$NVDA ‌
repost-content-media
  • 3
#TeslaRoadsterSparksMemeCoinSurge
Tesla’s Rocket Roadster Meets Crypto Hype: Can FTR Turn Viral Attention Into a Lasting Rally?.
The connection between futuristic technology and cryptocurrency speculation is becoming increasingly visible. Tesla’s rocket-powered Roadster demonstration has created a powerful online narrative, attracting attention from technology enthusiasts, traders, and meme-coin communities. Now, the key question is whether this attention can translate into sustained market participation or whether the excitement will fade as quickly as it appeared.
For me, this story is not
hyperliquid:native is back at the 77–75 support area, the same zone that started the September rally.
A short-term bounce is around the corner. A break above the descending trendline would open the way back to 82–84.
Will this support hold again?
post-image
HYPE-2.58%
Sunday, October 18 [Macro]
✅The US postpones imposing a new round of large-scale sanctions on Russia
✅The ECB warns that geopolitical conflicts are driving up inflation risks
📅Sunday, October 18 [Geopolitics]
✅Strait of Hormuz: Iran opens fire to intercept vessels in violation, and an oil tanker hits a mine and catches fire
✅Ukraine: Ukraine and the US may begin a new round of talks as early as next week
✅Egypt says it can provide security protection at Saudi Arabia's request
🤖 NEW PREDICTION MARKET: Can Gemini 4 Argon (High) finish first on Oct. 19?
Gemini 4 Argon (High) leads at 93.5% in the Oct. 17 snapshot. Rivals need an eligible Text Arena entry; the noon ET ranking decides the result.
post-image
EIA data determines the short-term direction of crude oil
live-cover
LIVE16
The ETH subscription signal called for a long near 2364; we hit take-profit perfectly and banked gains.
Subscribers are feasting every day
post-image
ETH-0.88%
  • 1
Everyone, $AVA is showing signs of rejection after a sharp rally, with resistance strengthening around $0.383–$0.400. If sellers take control, a deeper pullback may follow.
$AVA — Short entry: $0.3830–$0.3900 Take-profit 1: $0.3600 Take-profit 2: $0.3400 Take-profit 3: $0.3142 Stop-loss: $0.4112 Will AVA pull back further, or break back above resistance?
post-image
AVA+37.16%
Last month altcoins against $BTC closed first whole monthly candle above the bull market support band.
This month retesting ✅
Look where we are 👇🏼
Next 6 months will be good 💵
#OTHERS
BTC-0.21%
$ELA SEND IT TO THE STARS!
post-image
ELA+12.13%
Load More

Join 40 M users in our growing community

⚡️ Join 40 M users in the crypto craze discussion

💬 Engage with your favorite top creators

👍 See what interests you

Trending Topics

USSeptemberPPIBeatsExpectations

91.35k Views1.93k Discussing

US September PPI came in at 6.3% YoY, well above the 5.3% market expectation, pointing to renewed producer-side inflation pressure. Weekly jobless claims were 199K, broadly in line with forecasts. Could hotter inflation further reduce room for rate cuts, and what does it mean for $BTC, US stocks, and gold?

GateWCTCS9GlobalTradingCompetition

37.87k Views6.68k Discussing

GateBTCAndETHFuturesVolumeRanksTop3

53.8k Views1.81k Discussing

View More