Square
Following
Hot
News
Profile
Share your thoughts
placeholder
Article
$ENA Right now it feels like a multiple-choice question with no standard answer, but the answer will not be hidden in emotions.
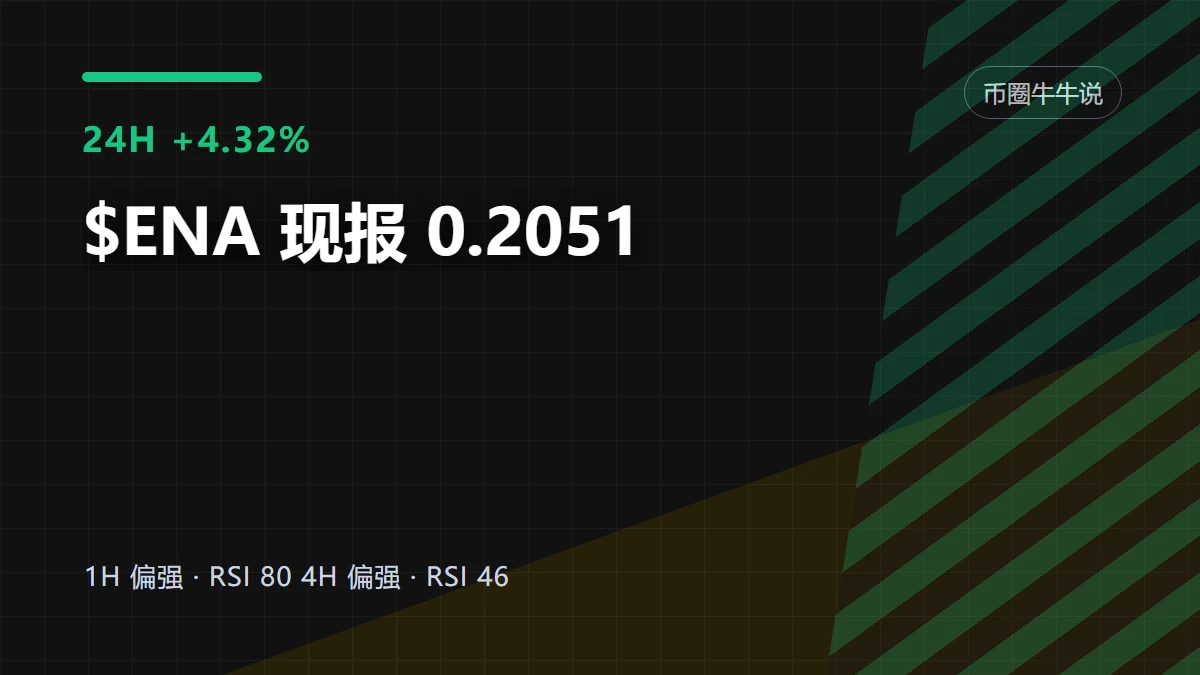
First, let’s copy the full question: $ENA is currently at 0.2051, up 4.32% over 24 hours. The 1-hour support is 0.1825, resistance is 0.2069, and current volume is 0.43 times the average volume of the past 20 candles. The 1-hour trend is strong, with RSI at 80; the 4-hour trend is strong, with RSI at 46.
The angle I’m watching is that $ENA remains strong, while the crowded positioning is already on the table. I acknowledge that the trend is strong, but what matters ne
post-image
ENA+4.48%
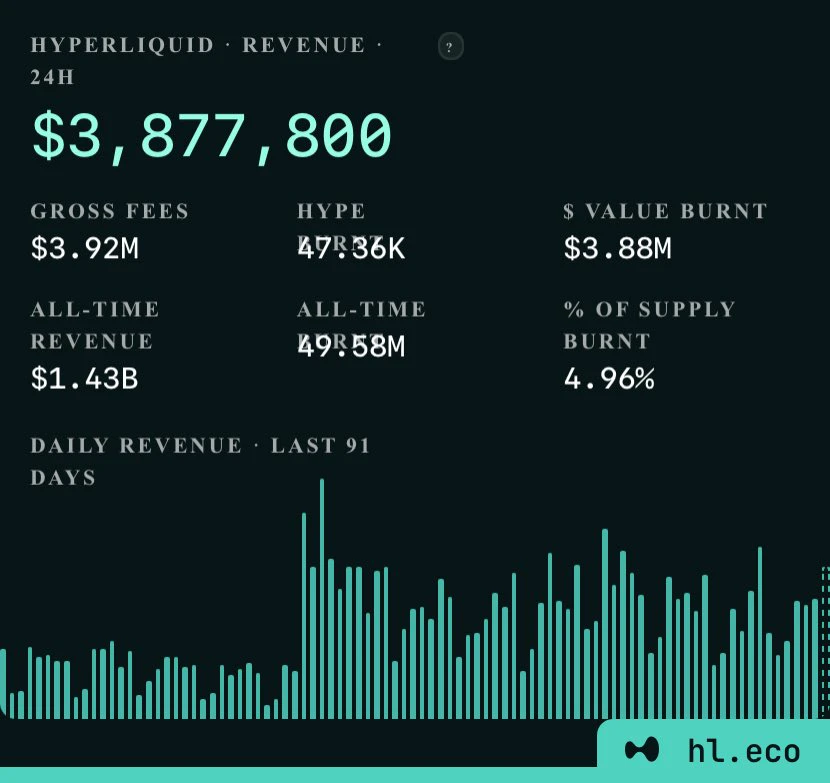
We are getting closer to $4M in fees per day on Hyperliquid again.
Add the $500k from the yield reserve and we are already there
post-image
HYPE+1.66%
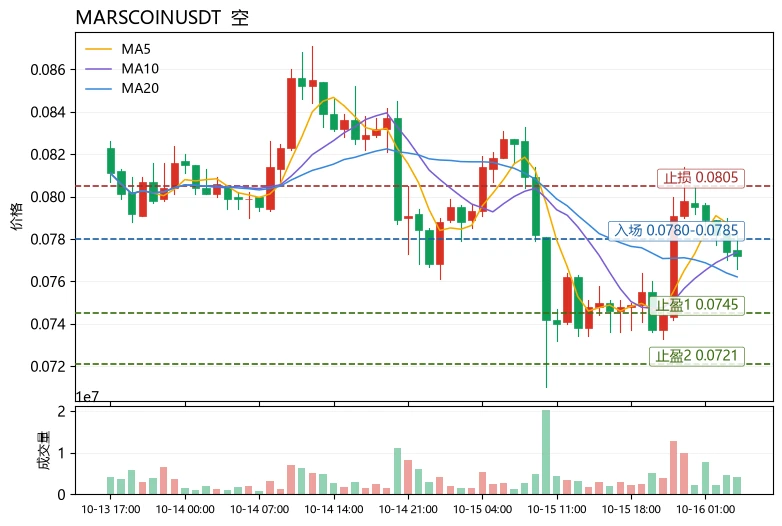
$MARSCOIN is currently in a high-volatility, weak-trend phase. Conclusion first: short-term bias is bearish; chasing longs is not recommended. If it rebounds to around 0.0782, a small short position may be cautiously attempted, but a hard stop-loss must be used.
The reasoning is as follows. MARSCOIN is currently at 0.0772, down 5.04% over 24h, with the amplitude over 30 candles reaching as high as 15.93%. Its volatility is significantly higher than BTC's 3.44%, making it a typical high-risk asset. In terms of moving averages, MA5=0.07824 remains above MA20=0.07621, so the apparent bullish ali
post-image
MARSCOIN-6.36%
BAT+28.99%
BTC+0.94%
I can't be the only one 😭
post-image
Insiders are quietly stacking shorts on BTW while the 1h ATR screams volatility.

$BTW /USDT - SHORT

Trade Plan:
Entry: 1.875069 – 1.928019
SL: 2.155704
TP1: 1.710924
TP2: 1.583844
TP3: 1.393224

Why this setup?
Why now? The daily trend is range-bound, which favors mean reversion and gives the short bias a structural edge. The 15m RSI sits at 49.09, hovering just below neutral and signaling that momentum is not yet oversold enough to invalidate a pullback. The 1h ATR of 0.1059 confirms that the asset is in a high-volatility phase, making the entry zone between 1.875069 and 1.928019 a preci
BTW-20.20%
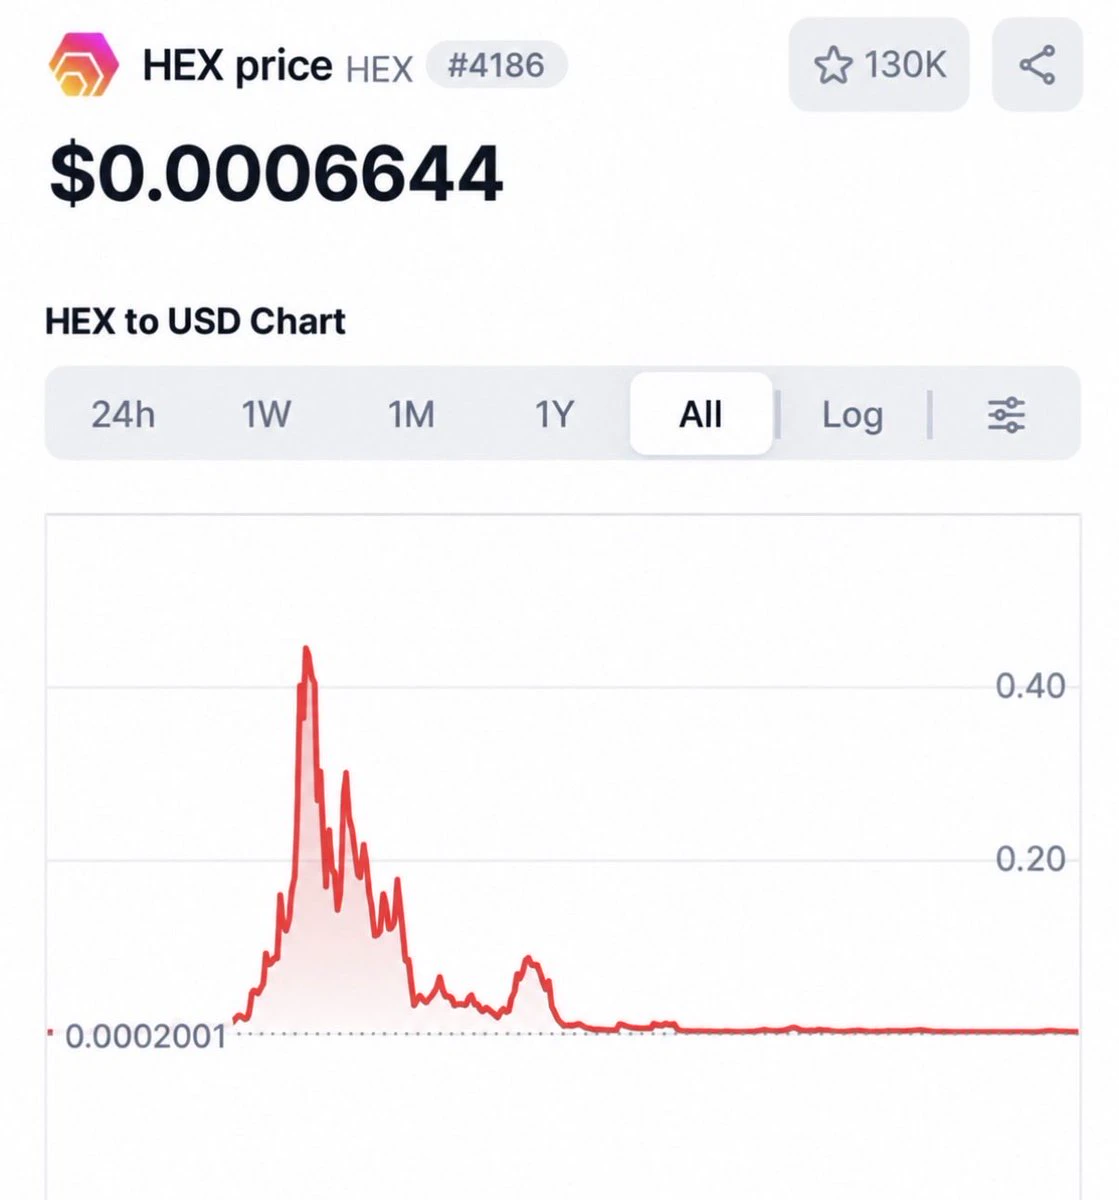
If you had put $10,000 into Richard Heart’s Hex token at the 2021 all time high you would only have $11 left and be down over -99.9%.
post-image
America before websites had pop up ads
post-image
$AGT Square has scored a resounding victory for the fifth consecutive month. The more people try to suppress us, the more we stand out; the more people try to suppress us, the better we perform; the more people try to suppress us, the stronger people's trust in us becomes.
1,200 traders, 1,200 qualified individuals. Thank you to each and every one of you. $ZE
$ETH
post-image
ETH+1.67%
Who is truly leading the gains in the same sector? The answer points to $INJ
.
A horizontal comparison makes it clear: $INJ rose 10.92% over 24h, with a trading volume of 24.0M USDT, while $JTO fell 3.94% and $DOGE barely moved (-0.28%) over the same period. All three have an MA5 crossing above MA20, but only $INJ ’s RSI surged to 71.2, with the MACD histogram expanding significantly to +0.136. Its price of 8.379 is already approaching the Bollinger upper band at 8.618, and its 30-candle amplitude of 17.89% shows far greater volatility elasticity than the other two. The funding rate of +0.0
post-image
INJ+11.34%
JTO-2.75%
DOGE-0.24%
$XAU Initial indicators point to an upcoming rise in gold after the liquidity withdrawn yesterday entered, with a strong timeframe breakout above $4,180.
post-image
CPI Comes in Hotter Than Expected
live-cover
LIVE80
Nothing says privacy like walking around with a phone with the Ledger logo on the back
post-image
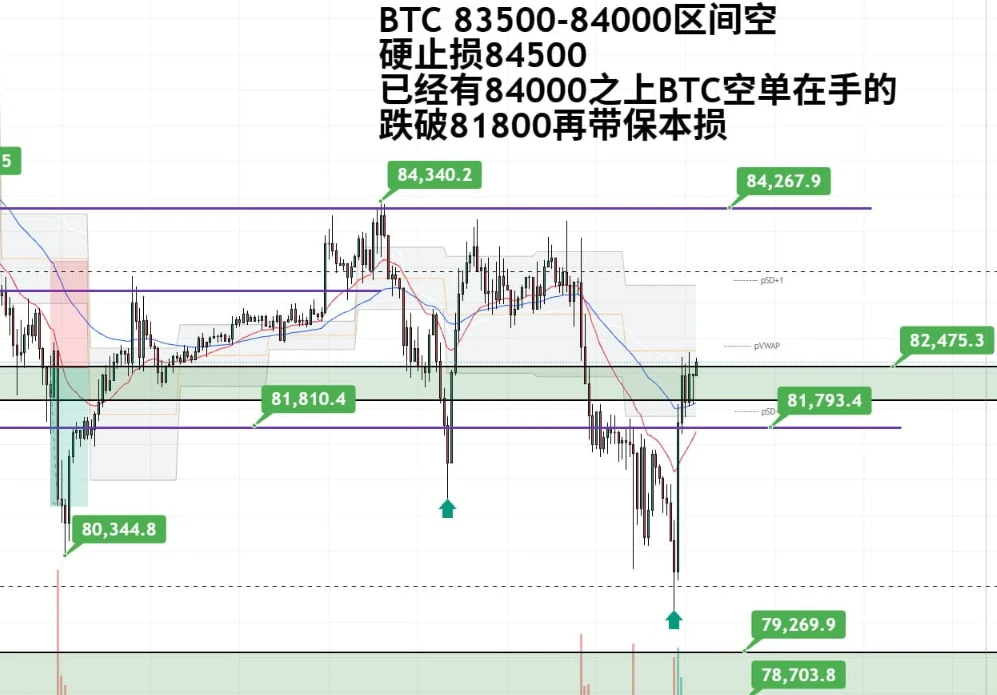
October 16 $BTC Strategy: Based on the current market, BTC's upward movement is being blocked by the 84200 resistance level. We continue to expect a pullback in the near term, but the decline has not been deep.
Do not rush to buy the dip. Open short positions in the 83500-84000 range, with a stop loss at 84500 (the starting point of the decline on October 7). If a solid bearish candle continues to break below 81800, keep the stop loss at breakeven.
Wait for a new low to appear. Reduce short positions in the 79200-78000 range and look for an opportunity to enter long positions.
post-image
BTC+0.96%
SK Hynix Plunges 11%, but Gate’s Open Interest Accounts for 15.8% of the Total Market, Ranking Second—What Are Traders Thinking?

SK Hynix closed down 11.06% yesterday, hitting a new low since April this year and retreating 57% from its June high. Interestingly, the more volatile the market, the higher the trading attention related assets are receiving.

According to Odaily, CoinGlass data shows that open interest in SK Hynix contracts on Gate reached 147,300, accounting for 15.8% of the market and ranking second across the entire market. What does this mean? It means that amid the sharp dec
SNDK-0.56%
Trade is actually an old script. In the 1980s, Japan’s economy was at its peak, with GDP reaching nearly 70% of the United States’, while its semiconductor industry was putting immense pressure on the US. Japan also wanted to improve relations with China and bring China in to counterbalance the US. What happened? The US launched a combination of measures: the 1985 Plaza Accord forced the yen to appreciate; the 1986 US-Japan Semiconductor Agreement forced Japan to open its market and restricted its exports; and the constraints of the US-Japan security alliance kept Japan firmly in line. From th
post-image
AAPL-0.31%
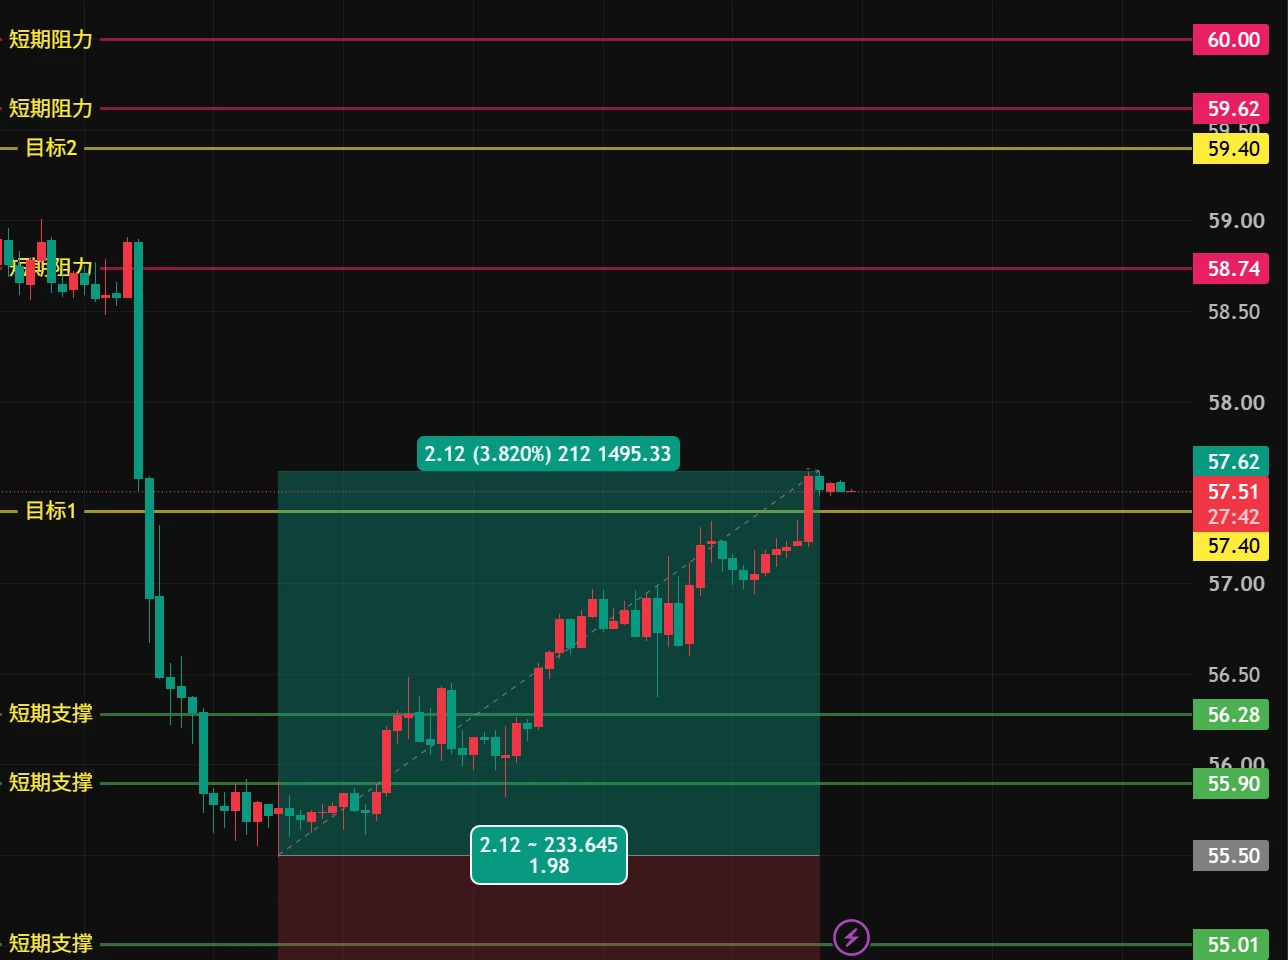
Silver surges! From 55.5 to 57.6. Completed ✅ target 1, up 3.8%. Short sellers, keep it up 💪 Dump it down with all kinds of selling pressure so I can go long lower 🤭 #XAG $XAG
post-image
飞鱼2026祝福版
Latest Silver Strategy!!!
XAGUSD-0.02%
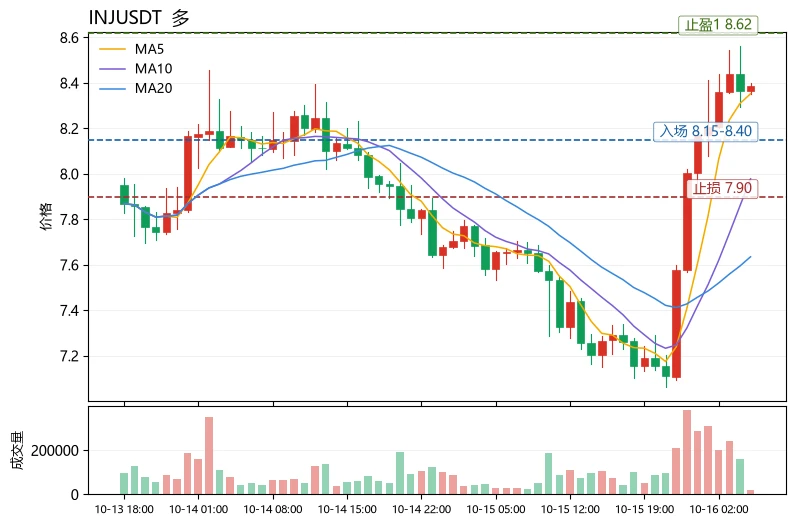
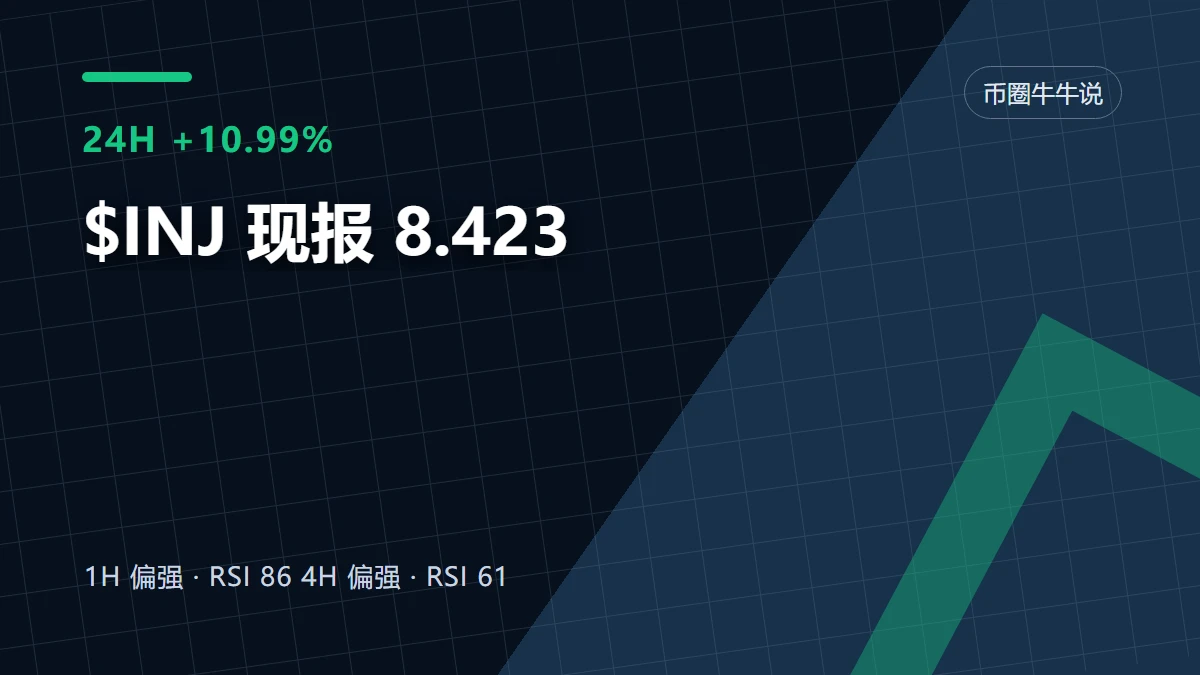
An unpopular take: $INJ ’s current +10.99% gain is not as conclusive as it looks.
$INJ is currently at 8.423, up +10.99% over 24 hours. The 1-hour support is 7.061, resistance is 8.562, and current volume is 0.77 times the average volume of the past 20 periods. What is truly useful in these numbers is where 7.061 and 8.562 are containing the range.
This is where I currently stand: I acknowledge that the trend is strong, but what matters next is not how much higher it can surge, but whether buyers step in during the first pullback. The 1-hour trend is strong, with an RSI of 86; the 4-hour trend
post-image
INJ+11.20%
In this $ZRO move, which step is easiest to be fooled by?
When I looked at $ZRO again, I first covered up the 24-hour +9.37%. It’s not that this number is unimportant, but it is too good at grabbing attention. What really needs explaining right now is that after $ZRO’s sharp 24-hour rise, momentum and continuation are not the same thing. I won’t extrapolate the large move that has already happened into the next leg; I’ll first see whether the price can hold in the new range.
The most convenient—and easiest to get wrong—reading is that the gainers and losers list records the past, while the mo
post-image
ZRO+9.15%
solana:7b6dX3nE25xrfNViEKZHL9wVJFcBxQYuWPpmzHUxx28H 🥀 Zero or Hero there is no in between
7b6dX3nE25xrfNViEKZHL9wVJFcBxQYuWPpmzHUxx28H
#Crypto #memecoin $sol
post-image
SOL+1.25%
Bitcoin Support and Resistance Levels
live-cover
LIVE14
Load More

Join 40 M users in our growing community

⚡️ Join 40 M users in the crypto craze discussion

💬 Engage with your favorite top creators

👍 See what interests you

Trending Topics

USSeptemberPPIBeatsExpectations

91.35k Views1.88k Discussing

US September PPI came in at 6.3% YoY, well above the 5.3% market expectation, pointing to renewed producer-side inflation pressure. Weekly jobless claims were 199K, broadly in line with forecasts. Could hotter inflation further reduce room for rate cuts, and what does it mean for $BTC, US stocks, and gold?

DrLinHanSpeaksAtOxfordUnion

135.63k Views1.86k Discussing

JapanAndKoreaStocksPlunge

47.27k Views1.76k Discussing

View More