Square
Following
Hot
News
Profile
Share your thoughts
placeholder
Article
Semiconductor Stocks Recover as Investors Revisit Long Term AI Industry Growth
live-cover
LIVE649
I lost half in one day, and I’m ready to leave the casino, brothers—when you don’t gamble, you’re already winning
post-image
Trenches
AGT
A
bade
b
AGT
0x5d...e274
Market Cap
$.
Change
.
24h Vol
$.
Holders
FOLIO
F
bade
b
FOLIO
0x5f...e411
Market Cap
$.
Change
.
24h Vol
$.
Holders
.
CNPY
C
bade
b
CNPY
0xc6...ddd2
Market Cap
$.
Change
.
24h Vol
$.
Holders
.
FTR
F
bade
b
FTR
DFMt...pump
Market Cap
$.
Change
.
24h Vol
$.
Holders
.
DOPE
D
bade
b
DOPE
0xf9...8899
Market Cap
$.
Change
.
24h Vol
$.
Holders
.
$BAT The current price is 0.1773, below the lower Bollinger Band at 0.182405. MA5 at 0.18626 is below MA20 at 0.19555 and diverging downward, completing the bearish alignment. RSI at 28.9 has entered oversold territory, while the MACD histogram at -0.002467 remains bearish, though a short-term rebound warrants caution. The funding rate of -0.0113% indicates crowded shorts, while the Fear and Greed Index at 55 leans toward greed, suggesting selling pressure is driven by leverage rather than panic selling. Overall, the trend remains bearish, but oversold conditions combined with negative funding
post-image
SUI-5.47%
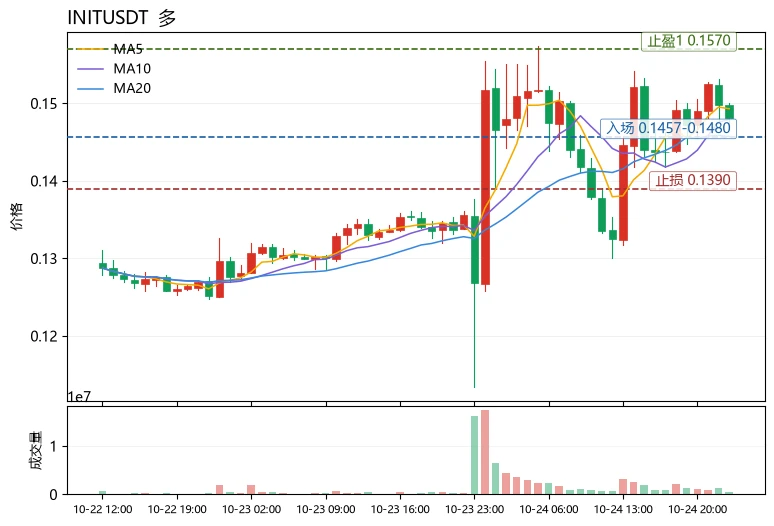
$AGT ‌AGT/USDT – Perp
🪂 Why did AGT fly so high? Because it forgot gravity exists in crypto. 📉📊
Bias: Parabolic +95% pump, now in a volatile pullback. Overbought conditions guarantee high risk. Watch for continuation or a deeper correction. 🔥
📈 Long – Pullback Buy
Entry: 0.0650 – 0.0680
(Confluence: prior consolidation zone)
TP1: 0.0750
TP2: 0.0850
TP3: 0.0950
SL: 0.0600
📉 Short – Rejection
Entry: 0.0860 – 0.0900
(Rejection from local peak 0.086983)
TP1: 0.0750
TP2: 0.0650
TP3: 0.0550
SL: 0.0950
📉 Short – Breakdown
Entry: 0.0650 – 0.0670
(Break below current support)
TP1: 0.0550
TP2: 0
post-image
AGT+98.82%
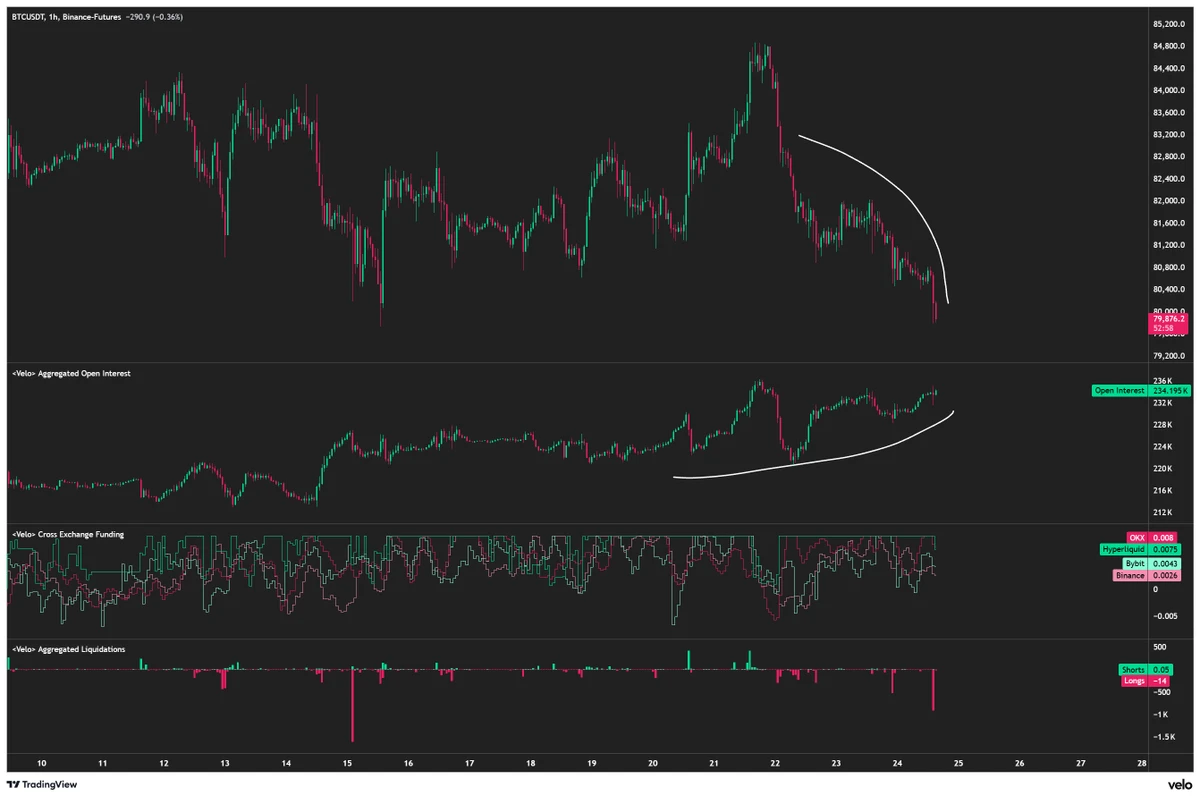
$BTC — Join me in opening a large short position, brothers. You’ll thank me soon.
Stop-loss: 81,700 Take-profit: 80,800 Third round, big profits are coming soon $BTC 👇
post-image
BTC-1.02%
This is what real love looks like.
I’m so jealous.
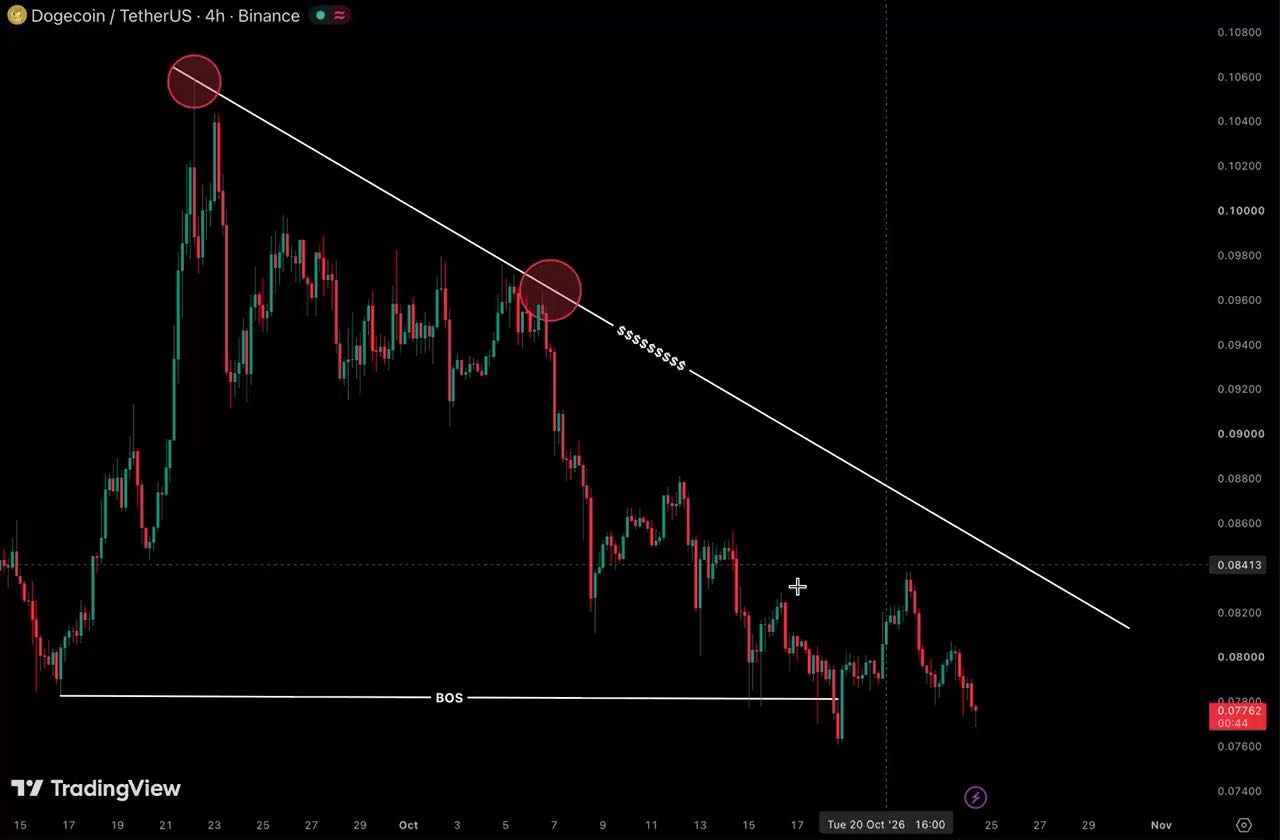
#DOGE DOGE ETFs switch from consecutive net inflows to redemptions! Can the $0.08 support hold?
Dogecoin hype cools! ETF funds flee, with $0.08 becoming a make-or-break line🐶
Dogecoin DOGE, once hugely popular, is now facing a subdued market atmosphere. Dogecoin ETFs had previously seen three consecutive weeks of inflows, but the trend completely reversed in October as institutional funds began to pull out, putting significant pressure on the price.
📉ETF funds see $540,000 in outflows over two days.
According to SoSoValue data, from October 1 to 9, flows in and out of Dogecoin spot ETFs were
DOGE-2.41%
#WCTCS9
an amazing activity from the best platform of the world
$META
post-image
META-3.68%
#BitcoinTops$82K
#ShareWeekly
**BTC Market Analysis: Inflation Shock, the $80K Test, and the Next Move**
Bitcoin has spent the past week trading in a tight, nervous range, and the reason is inflation. Hotter-than-expected US CPI data on Wednesday (October 14) pushed traders to price in a higher-for-longer Fed. BTC rose to about $84,000 right before the print, then sold off. It briefly dipped below $80,000 as rate-hike fears and a global tech selloff hit risk assets. It then rebounded toward $82,000 on Friday, October 16, helped by easing Treasury yields and softer oil. Even so, BTC was still
post-image
BTC-1.03%
I was today years old when I found out that fomo has 4x more daily users than the pump fun app
post-image
PUMP+2.25%
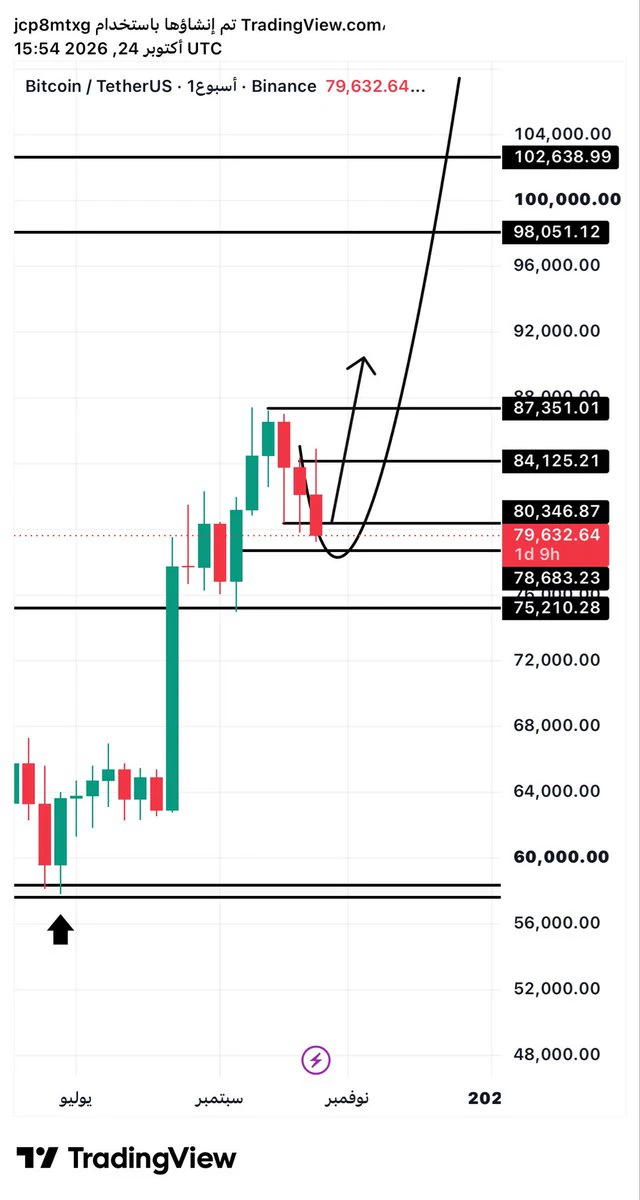
Key Bitcoin Levels to Watch:
$78,000
$74,000
$62,000
If we drop to here (no guarantees), these are good levels to buy the dip!
Save them. 🤝
post-image
BTC-1.03%
#ShareWeekly ‌$SOL Weekly Report: range, position and indicators at $104.27
Solana trades around $104.27 today. It is a week of tight ranges, a defended $100 floor and a major network upgrade on the calendar. Here is the full picture.
Price position: how high and how low
SOL slipped to $100.43 this week, its lowest since mid-September, before buyers defended $100 again. A rebound from $100.62 reached $106.20 on Thursday, and today's session high is $107.44. By my math, price now sits about 3.8% above the week low and about 3% below today's high.
Performance against the market, measured as the
post-image
SOL-1.90%
ETH-2.00%
BTC-1.03%
This is the company SOL set up in Shanghai, with registered capital of 5 million. It was only established this June, yet started promoting itself publicly in October. Who is actually behind it? $SOL ‌
post-image
SOL-1.89%
  • 1
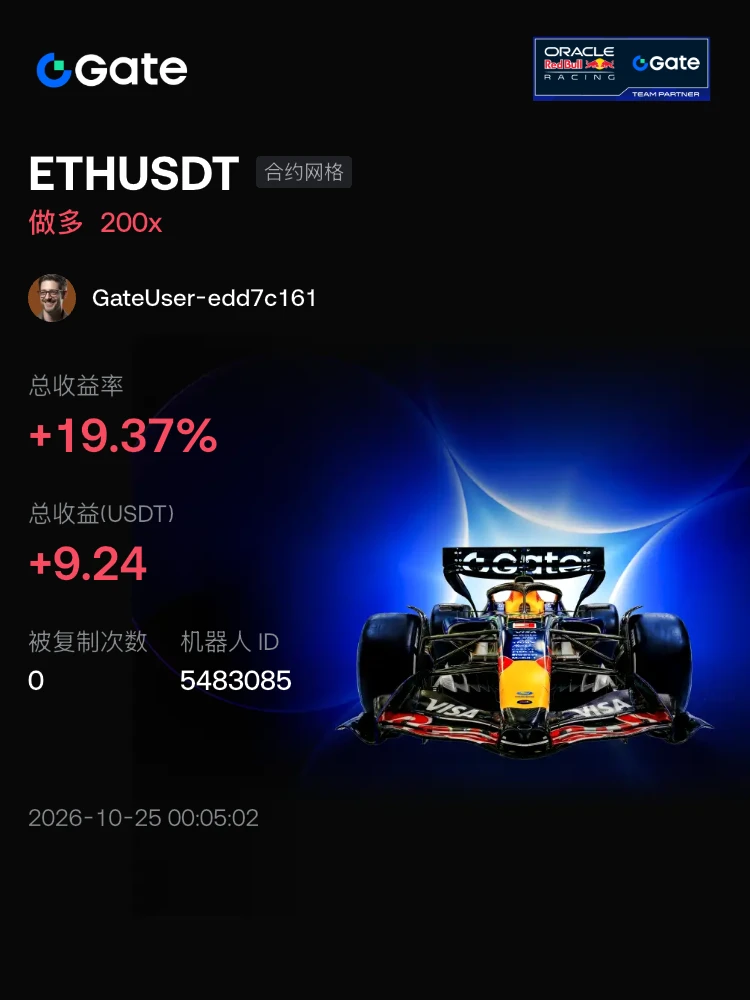
#交易机器人 I'm using a TLTON/USDT spot grid bot on Gate. Join me in copy trading!
post-image
TLTON-1.62%
[New Streamer] Market Prediction
live-cover
LIVE1,917
$BTC — Join me in taking a large short position, guys. You'll thank me soon.
Stop loss: 81,700 Take profit: 80,800 Third round, big profits are coming soon $BTC 👇
post-image
BTC-1.02%
📶 $SKHYNIX Long Setup: Basing After the Capitulation
Pair: $SKHYNIX /USDT
Direction: LONG
Entry: 929.11
TP1: 950.5 +2.3%
TP2: 964.77 +3.8%
TP3: 986.16 +6.1%
SL: 900.59
Chart Structure:
- Sharp capitulation from ~1030 down to a low near 890, followed by a multi-hour base/consolidation between 900-980
- Price is tightening just above MA7/MA25 basing rather than breaking down further
- RSI recovered from the low-20s to ~45-50 and is ticking back up momentum stabilizing, not yet strong but no longer deteriorating
- MACD flipped positive during the bounce and has flattened near zero rather tha
SKHYNIX-2.60%
📊 Copper hit a record: US$ 6,95 per pound, outpacing gold by ~20% in 2026. What lesson does this hold for people holding USDT in Venezuela?
The metals market is putting on an uncommon show. Copper climbed to a new record of US$ 6,95 per pound on September 22, gaining close to 20% so far this year and more than 46% over twelve months. Meanwhile, gold—the traditional safe haven—barely moved: just +0,02% over the same period.
For Venezuelan traders who check the USDT exchange rate on P2P markets every day, this story hits close to home. It’s the same movie we see on our exchange platforms: when
post-image
Why, with CPI so high, will the Federal Reserve not raise interest rates in October?
The U.S. Treasury Department released its fiscal year 2026 report, showing that total interest expenses on U.S. Treasury debt for the year reached as high as $1.36 trillion, up 12% from the previous fiscal year.
If rates continue to rise, interest rates on U.S. Treasury debt will also increase, putting greater pressure on the U.S. government's interest payments.
Although the Federal Reserve is independent, it cannot completely ignore the risks associated with U.S. Treasury debt.
The risks of U.S. Treasury debt
post-image
Load More

Join 40 M users in our growing community

⚡️ Join 40 M users in the crypto craze discussion

💬 Engage with your favorite top creators

👍 See what interests you

Trending Topics

USSeptemberPPIBeatsExpectations

91.35k Views1.92k Discussing

US September PPI came in at 6.3% YoY, well above the 5.3% market expectation, pointing to renewed producer-side inflation pressure. Weekly jobless claims were 199K, broadly in line with forecasts. Could hotter inflation further reduce room for rate cuts, and what does it mean for $BTC, US stocks, and gold?

GateWCTCS9GlobalTradingCompetition

37.87k Views6.65k Discussing

GateBTCAndETHFuturesVolumeRanksTop3

53.8k Views1.78k Discussing

View More