

Square
Following
Hot
News
Profile
Share your thoughts
placeholder
Article
$SAND bouncing nicely from the local bottom 👀
I think we will see similar moves with other gaming tokens soon!
post-image
SAND+12.77%
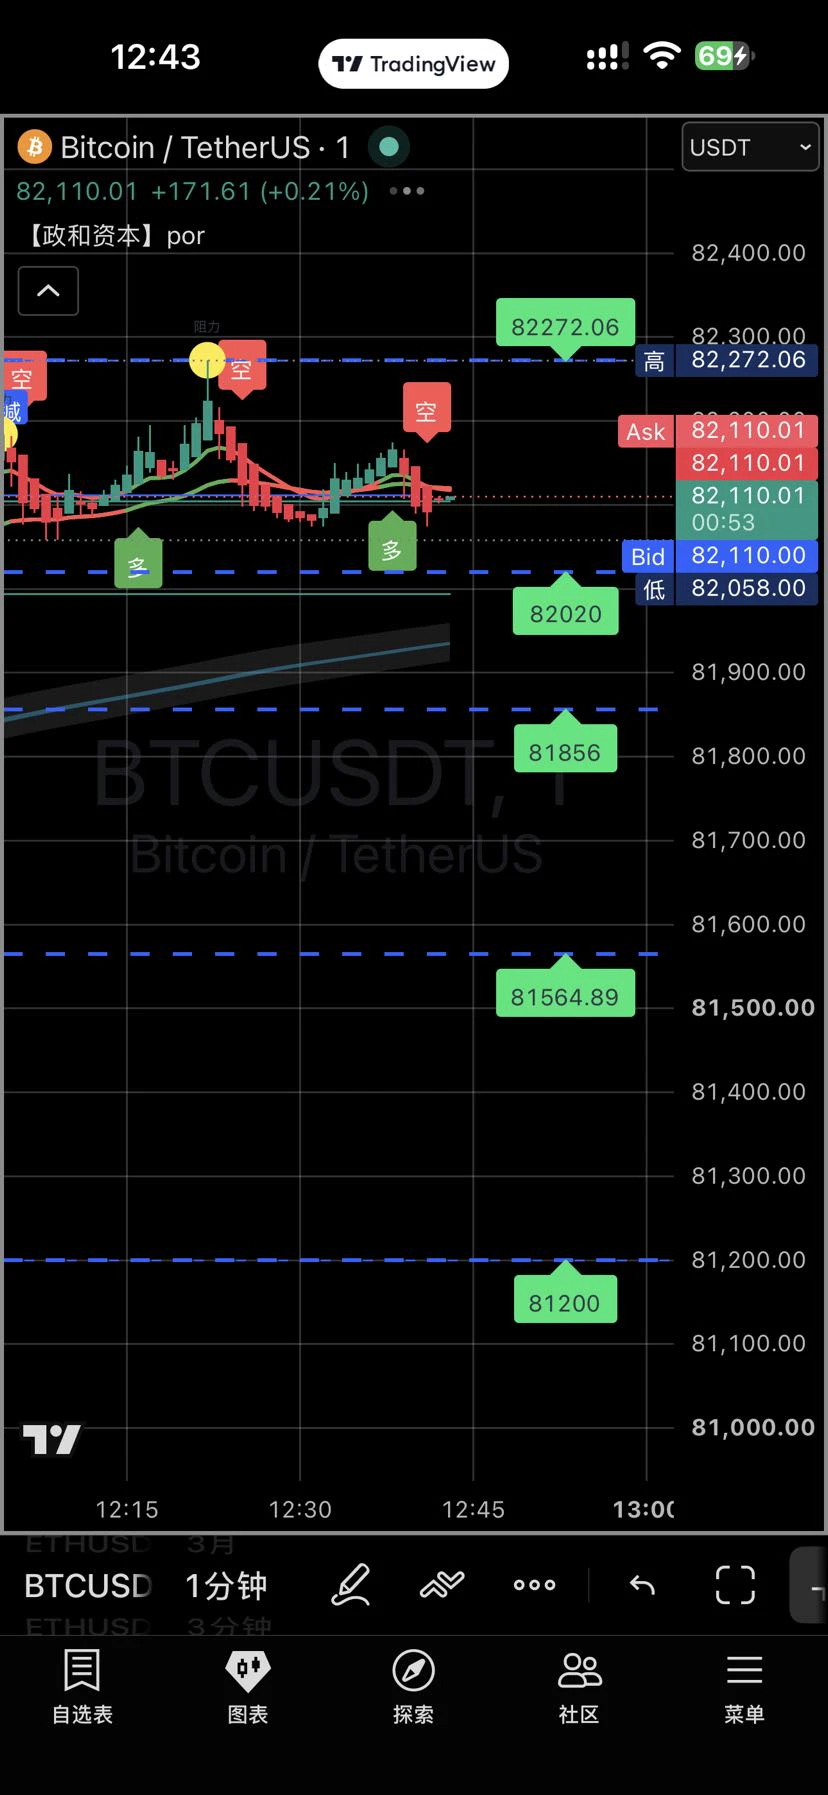
Yesterday, went long on BTC around 80,700—once again got in right at the wick tip.
(For subscribers: trades right at the wick tip every day, taking profits + setting take-profit orders)
post-image
Trenches
AGT
A
bade
b
AGT
0x5d...e274
Market Cap
$.
Change
.
24h Vol
$.
Holders
.
CNPY
C
bade
b
CNPY
0xc6...ddd2
Market Cap
$.
Change
.
24h Vol
$.
Holders
.
FOLIO
F
bade
b
FOLIO
0x5f...e411
Market Cap
$.
Change
.
24h Vol
$.
Holders
.
FTR
F
bade
b
FTR
DFMt...pump
Market Cap
$.
Change
.
24h Vol
$.
Holders
.
DOPE
D
bade
b
DOPE
0xf9...8899
Market Cap
$.
Change
.
24h Vol
$.
Holders
.
MARKET UPDATES
live-cover
LIVE1,477
HOT TOPIC PREDICTION
live-cover
LIVE1,211
Current price 1301.92, down 5.09% in 24h, trading volume 36.2M USDT; MA5=1300.92 is below MA20=1304.94, RSI=36.9 is nearing oversold territory, the MACD histogram at +2.42 has turned bullish, Bollinger range [1280.22,1329.66], 30-candle amplitude 9.35%, and the Fear and Greed Index at 55 remains in greed territory. Price is hugging the lower Bollinger Band, short-term moving averages are flattening, and initial signs of bullish MACD divergence indicate bearish momentum is fading. However, greed has not been flushed out, so a rebound is more likely to be short covering than a trend reversal; m
post-image
SNDKB
SNDKBSNDKB
Four.meme
MC:$3.87KHolders:1
0%
SUI-5.05%
🔥 $STX
After facing resistance near the $0.45 resistance zone, it is showing strong bearish signals! The price has fallen nearly 10% in the past 24 hours, and sellers have begun actively entering after the recent rebound. If bearish momentum continues and support gives way, STX could fall further to lower levels. 📉Take-profit: 0.0218 Stop-loss: 0.4521 Short $STX 👇
post-image
STX-9.92%
#晒出我的持仓收益 HSBC may switch to spot if the opportunity arises. Keep some funds ready to trade BTC!!
post-image
HSBC+0.02%
BTC-0.95%
$BTC Evening outlook: 10.17.
The consolidation zone marked by the red box above has broken down. Repeated rebounds failed to break above the 82614 resistance and hold there; a failed attempt to break resistance inevitably leads to a pullback.
The pullback then broke below the 81788 support. After that, there were several attempts to reclaim and trade above 81788 resistance, as indicated by the white arrow above, but they failed. Is there any problem with opening a short here?
No, because it meets the conditions for a short. Which conditions are those?
First, the current trend is down, because
BTC-1.00%
$NEAR INTENTS VOLUME IS ONLY THE START OF THE TOKEN STORY
The number I care about comes after the swap: how much revenue does the protocol retain?
Intents fees are shared with ecosystem participants. Revenue-share payouts are denominated in $NEAR, and product revenue has already funded token buybacks.
That creates a connection between usage and the token, but gross trading volume alone doesn’t tell us how strong it is.
My focus is retained revenue, actual buybacks and their size relative to new issuance.
For $NEAR, growing usage becomes more compelling when the economics grow alongside it.
post-image
NEAR-3.87%
I've used liquid dishwashing detergent for decades
Today I saw this kind of “solid dishwashing detergent” for the first time
It looks like ice cream🍦
The lemon scent🍋 smells quite nice
Have you ever used it?
post-image
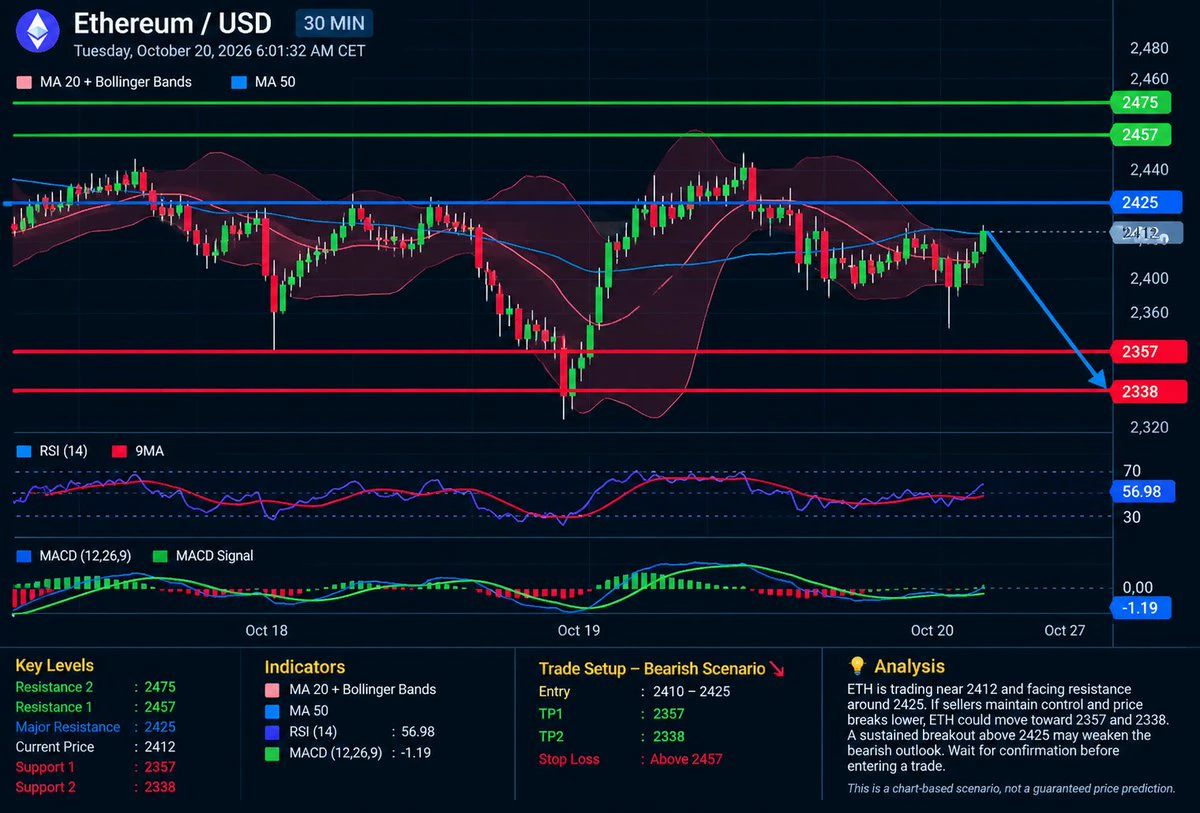
Today’s core assessment: ETH is currently in a post-decline consolidation and recovery phase, with a cautious-to-bearish short-term bias. The priority is to wait for signals to short a rebound, while keeping a breakout-long plan in reserve. Blindly chasing rallies or selling off at current levels is not recommended.
The latest market reports show ETH at approximately $2,413–$2,460 on October 17, with quote times varying by source; BTC is trading around $81,000. Whether ETH can regain and hold $2,450–$2,480 will be an important indicator of whether the short-term rebound can continue.
The follo
ETH-1.79%
BTC-0.96%
NAS100-2.28%
MSCI-1.02%
$METIS I checked the gainers list this afternoon and spotted this one right away. It's up more than 7% today and over 20% for the week, with bulls and bears battling it out halfway up the mountain. The project itself hasn't had any major new developments; the latest is that support for Stargate will end on the 23rd of this month, so liquidity will have to be withdrawn manually. I said this morning to stay away, and the price is even higher now. My view hasn't changed: it's fine to watch from the sidelines at this stage high, but chasing it isn't a good idea. It's only up a little compared with
post-image
METIS+2.94%
$ETH ‌ is looking a bit weak here.
• Lost the $2,550 level
• Trading back below the April highs
• $2,450 is now the key level to watch
If Ethereum fails to close the week above $2,450, another flush could be on the table.
Watching the weekly close closely. 👀
#USSeptemberPPIBeatsExpectations
#GateWCTCS9GlobalTradingCompetition
#GateBTCAndETHFuturesVolumeRanksTop3
post-image
ETH-1.74%
Agents have wallets and can pay for things.
However, they still can’t borrow.
$PRIORS is the credit layer for AI agents on Robinhood Chain.
How it works:
➜ New agent starts with a small USDG line (as low as $5 from the treasury)
➜ It borrows, uses the capital, and repays on-chain
➜ Every repayment is public and builds a score/record anyone can check
➜ Defaults burn a large portion of the backer’s $PRIORS stake
You can also put your own $PRIORS or stock tokens behind lines.
Next step is credit sized to verified x402 income, so an agent’s real revenue automatically repays the loan first.
Revi
post-image
USDG+0.02%
Longs have been badly shaken out at support; it’s time for a relief bounce after oversold conditions! Open a long position $TI .
Entry: 0.661 - 0.666 Take Profit 1: 0.6980 Take Profit 2: 0.7256 Stop Loss: 0.641 Trade the chart here. Let’s take a look at $SO and $EPIC .
post-image
EPIC+29.34%
Can you always chase longs when the moving averages are in a bullish alignment? No—the key is the price’s position relative to the upper Bollinger Band and the direction of the funding rate.
$SAND is a textbook example. MA5=0.060036 has crossed above MA20=0.056368, confirming a bullish moving-average structure; however, the current price of 0.0623 is above the upper Bollinger Band at 0.0615327, and RSI=73.7 is in overbought territory, making this a “healthy trend, but elevated price” in the short term. The right move here is not to chase at market, but to wait for a pullback to the moving-ave
post-image
MSTRB
MSTRBMSTRB
Four.meme
MC:$3.29KHolders:4
0.07%
SAND+12.77%
AMP+6.05%
Saw this online—mad always complains about not making money
On Pinduoduo, someone group-bought a 121-piece auto repair tool set for 56.98
Then listed it on Xianyu for 355 a set, making nearly 300 net per order
So stop saying you can’t make money and look harder for the reasons on your own side🤣
post-image
$APT This bearish candle hit pretty hard: down 7.75% in 24 hours, with the current price at 0.8183, hovering just above the low of 0.8166. Think of it like the last half hour before a market closes: vendors are desperate to clear their stock, calling out lower and lower prices, but trading volume is shrinking instead—54.7M in trading volume isn’t much, which suggests this isn’t panic selling so much as buyers collectively sitting on their hands, with nobody catching the falling knife.
Market sentiment is pretty clear: everyone who chased above 0.89 is now stuck holding the bag, and the intrada
APT-7.59%
$LSK #LSK
Breaking Falling Wedge.
Successful retest could trigger 50-55% rise during short term✍️
LSK+1.34%
  • 1
Load More

Join 40 M users in our growing community

⚡️ Join 40 M users in the crypto craze discussion

💬 Engage with your favorite top creators

👍 See what interests you

Trending Topics

USSeptemberPPIBeatsExpectations

91.35k Views1.92k Discussing

US September PPI came in at 6.3% YoY, well above the 5.3% market expectation, pointing to renewed producer-side inflation pressure. Weekly jobless claims were 199K, broadly in line with forecasts. Could hotter inflation further reduce room for rate cuts, and what does it mean for $BTC, US stocks, and gold?

GateWCTCS9GlobalTradingCompetition

37.87k Views6.62k Discussing

GateBTCAndETHFuturesVolumeRanksTop3

53.8k Views1.77k Discussing

View More