Share your thoughts
placeholder
Article
The only 2 tokens I hold on Stable chain.
These are $pumper & og $fefer:
> $pumper — launchpad on stable, fees go back to buyback and burn, holders and stakers;
> og $fefer — the first and main meme coin on Stable chain.
P.S: might ape into a business cat later... still thinking.
post-image
STABLE+4.04%
MEME0.00%
I originally just wanted to freeload a breakfast, but the market ended up serving me dumplings for half a year. 🔥
A few days ago in the early hours, $AKE pulled back to around 0.0088431. The key level held, with clear buying support below. After grinding sideways for half a day without breaking down, I went straight long and entered without hesitation. 💪
When I opened the chart this morning, the price had shot up to 0.0159464, handing me +1970.24%. This long trade delivered the answer. It was truly sluggish beforehand, but the breakout feels absolutely great. 😎
In terms of execution, I fir
post-image
AKE+22.73%
ETH-0.08%
BTC-0.81%
I just deposited $10K into my FOMO acc.
I’m not the biggest fan of this bubble, but curiosity finally got the better of me.
Now shill me your best pick, WHAT DO I BUY?! 👇
post-image
#GateLaunchesTrenchesWith0GasFee Gate Launches Trenches — On-Chain Trading Product
Gate has officially launched Trenches, a new all-in-one on-chain trading product designed to make meme-coin and early-stage token trading faster and simpler. The launch was announced on September 7, 2026, with a limited-time gas-fee waiver aimed at reducing the cost of on-chain transactions.
One of the main features is a unified 0.5% trading fee for both buying and selling. In addition, users trading eligible assets on Robinhood Chain through Trenches can temporarily receive zero gas fees. The end date for the
MEME0.00%
SOL-1.48%
ETH-0.10%
BNB-1.49%
Why is SYMBOL about to break lower when everyone expects a bounce?

$SLX /USDT - SHORT

Trade Plan:
Entry: 0.06923 – 0.06963
SL: 0.07139
TP1: 0.06796
TP2: 0.06698
TP3: 0.06551

Why this setup?
Why now? The daily trend is range-bound, which often precedes a sharp directional move once momentum decides. The 1h ATR sits at 0.000816, meaning the average candle range is tight enough for a clean breakdown to deliver a high-ratio entry. The 15m RSI reads 42.92, confirming sellers are in control but not yet exhausted. The entry zone is 0.06923 to 0.06963, targeting the 1h price of 0.06943 as a prec
SLX+0.60%
After stalling at a high level, price broke below the range, and I began focusing on short opportunities from that point. The rebound lacked strength and fell back below the previous low, so I entered a short position with the stop set above the previous high, taking profits from this downward structure.
The intraday decline was not decisive and went through several rounds of back-and-forth grinding. I took 80% off at the first support level, and continued trailing the remaining 20% with the stop. I exited during the final accelerated drop, and the profit on the single trade was considerable.
post-image
DOGE+0.70%
LAB-1.99%
ETH Major Market Forecast: Steady Profits
live-cover
LIVE85
BTC gives me the feeling that it doesn’t want to fall, but it also doesn’t dare to rise.
USDT’s market cap has been fluctuating within a range since August 27.
There have been no capital inflows, but for now there have also been no obvious outflows. (There has been a slight outflow, and USDT has shown a slight tendency toward a negative premium, but it is not significant.)
Friday’s CPI data may come in line with or even below expectations, but there may still be no clear downward trend, and it may not necessarily provide a definitive answer on whether rates will be raised.
Brother Feng does no
BTC-0.82%
MSTR-1.49%
market update sol and btc
live-cover
LIVE2,081
Why is everyone ignoring the bullish setup forming right now?

$UNI /USDT - LONG

Trade Plan:
Entry: 6.924 – 6.990
SL: 6.643
TP1: 7.192
TP2: 7.349
TP3: 7.585

Why this setup?
Why now? The daily trend is bullish and the 1h price is holding at 6.958, which confirms momentum is building. The 15m RSI sits at 55.0, showing room to run before overbought exhaustion. The 1h ATR of 0.130738 means each candle can swing enough to reach the entry zone at 6.957 with real volatility behind it. From there, a clean break targets TP1 at 7.192 and then TP2 at 7.349, but the invalidation level of 6.051 is the
UNI-2.28%
$SPCX /USDT is range-bound on the daily trend but the 1h ATR whispers a short is forming.

$SPCX /USDT - SHORT

Trade Plan:
Entry: 150.04 – 150.28
SL: 151.35
TP1: 149.27
TP2: 148.67
TP3: 147.78

Why this setup?
Why now? The daily trend is range, which means the 1h price of 150.16 sits at a natural magnet for mean reversion. The 15m RSI reading of 48.86 confirms the short-term momentum is neither oversold nor overbought, allowing a clean entry within the 150.04 to 150.28 zone. The 1h ATR of 0.496517 quantifies the volatility contraction before a potential snap-back toward TP1 at 149.27. If t
SPCX-0.53%
Everyone winning on my timeline except me.
Send Epp
post-image
$XLM /USDT is range-bound, but the 1h setup hints at a short squeeze nobody is talking about.

$XLM /USDT - SHORT

Trade Plan:
Entry: 0.19221 – 0.19365
SL: 0.19983
TP1: 0.18775
TP2: 0.18430
TP3: 0.17913

Why this setup?
Why now? The daily trend is range, yet the 1h ATR of 0.002876 shows volatility is compressing, which often precedes a directional burst. The 15m RSI at 58.47 is neither overbought nor oversold, meaning the next impulse can run hard without a warning divergence. The entry zone at 0.19293 aligns perfectly with the 1h price, giving a clean trigger for a short bias. TP1 at 0.187
post-image
XLM+4.01%
I didn’t chase the first leg of that drop just now, as the breakdown moment is when fake moves are most common. I’ll only enter short after the price rebounds to below the former platform, with the stop-loss above the platform—that’s when the risk-reward ratio is worth trying.
The decline after entry wasn’t particularly smooth; a false-breakout-style rebound occurred midway and nearly swept the protective stop. Once the first target was reached, I took 80% off the table, moved the protection up on the remaining position, and didn’t fight the trade.
The remaining position was fully closed durin
post-image
BNB-1.54%
ZEC-4.96%
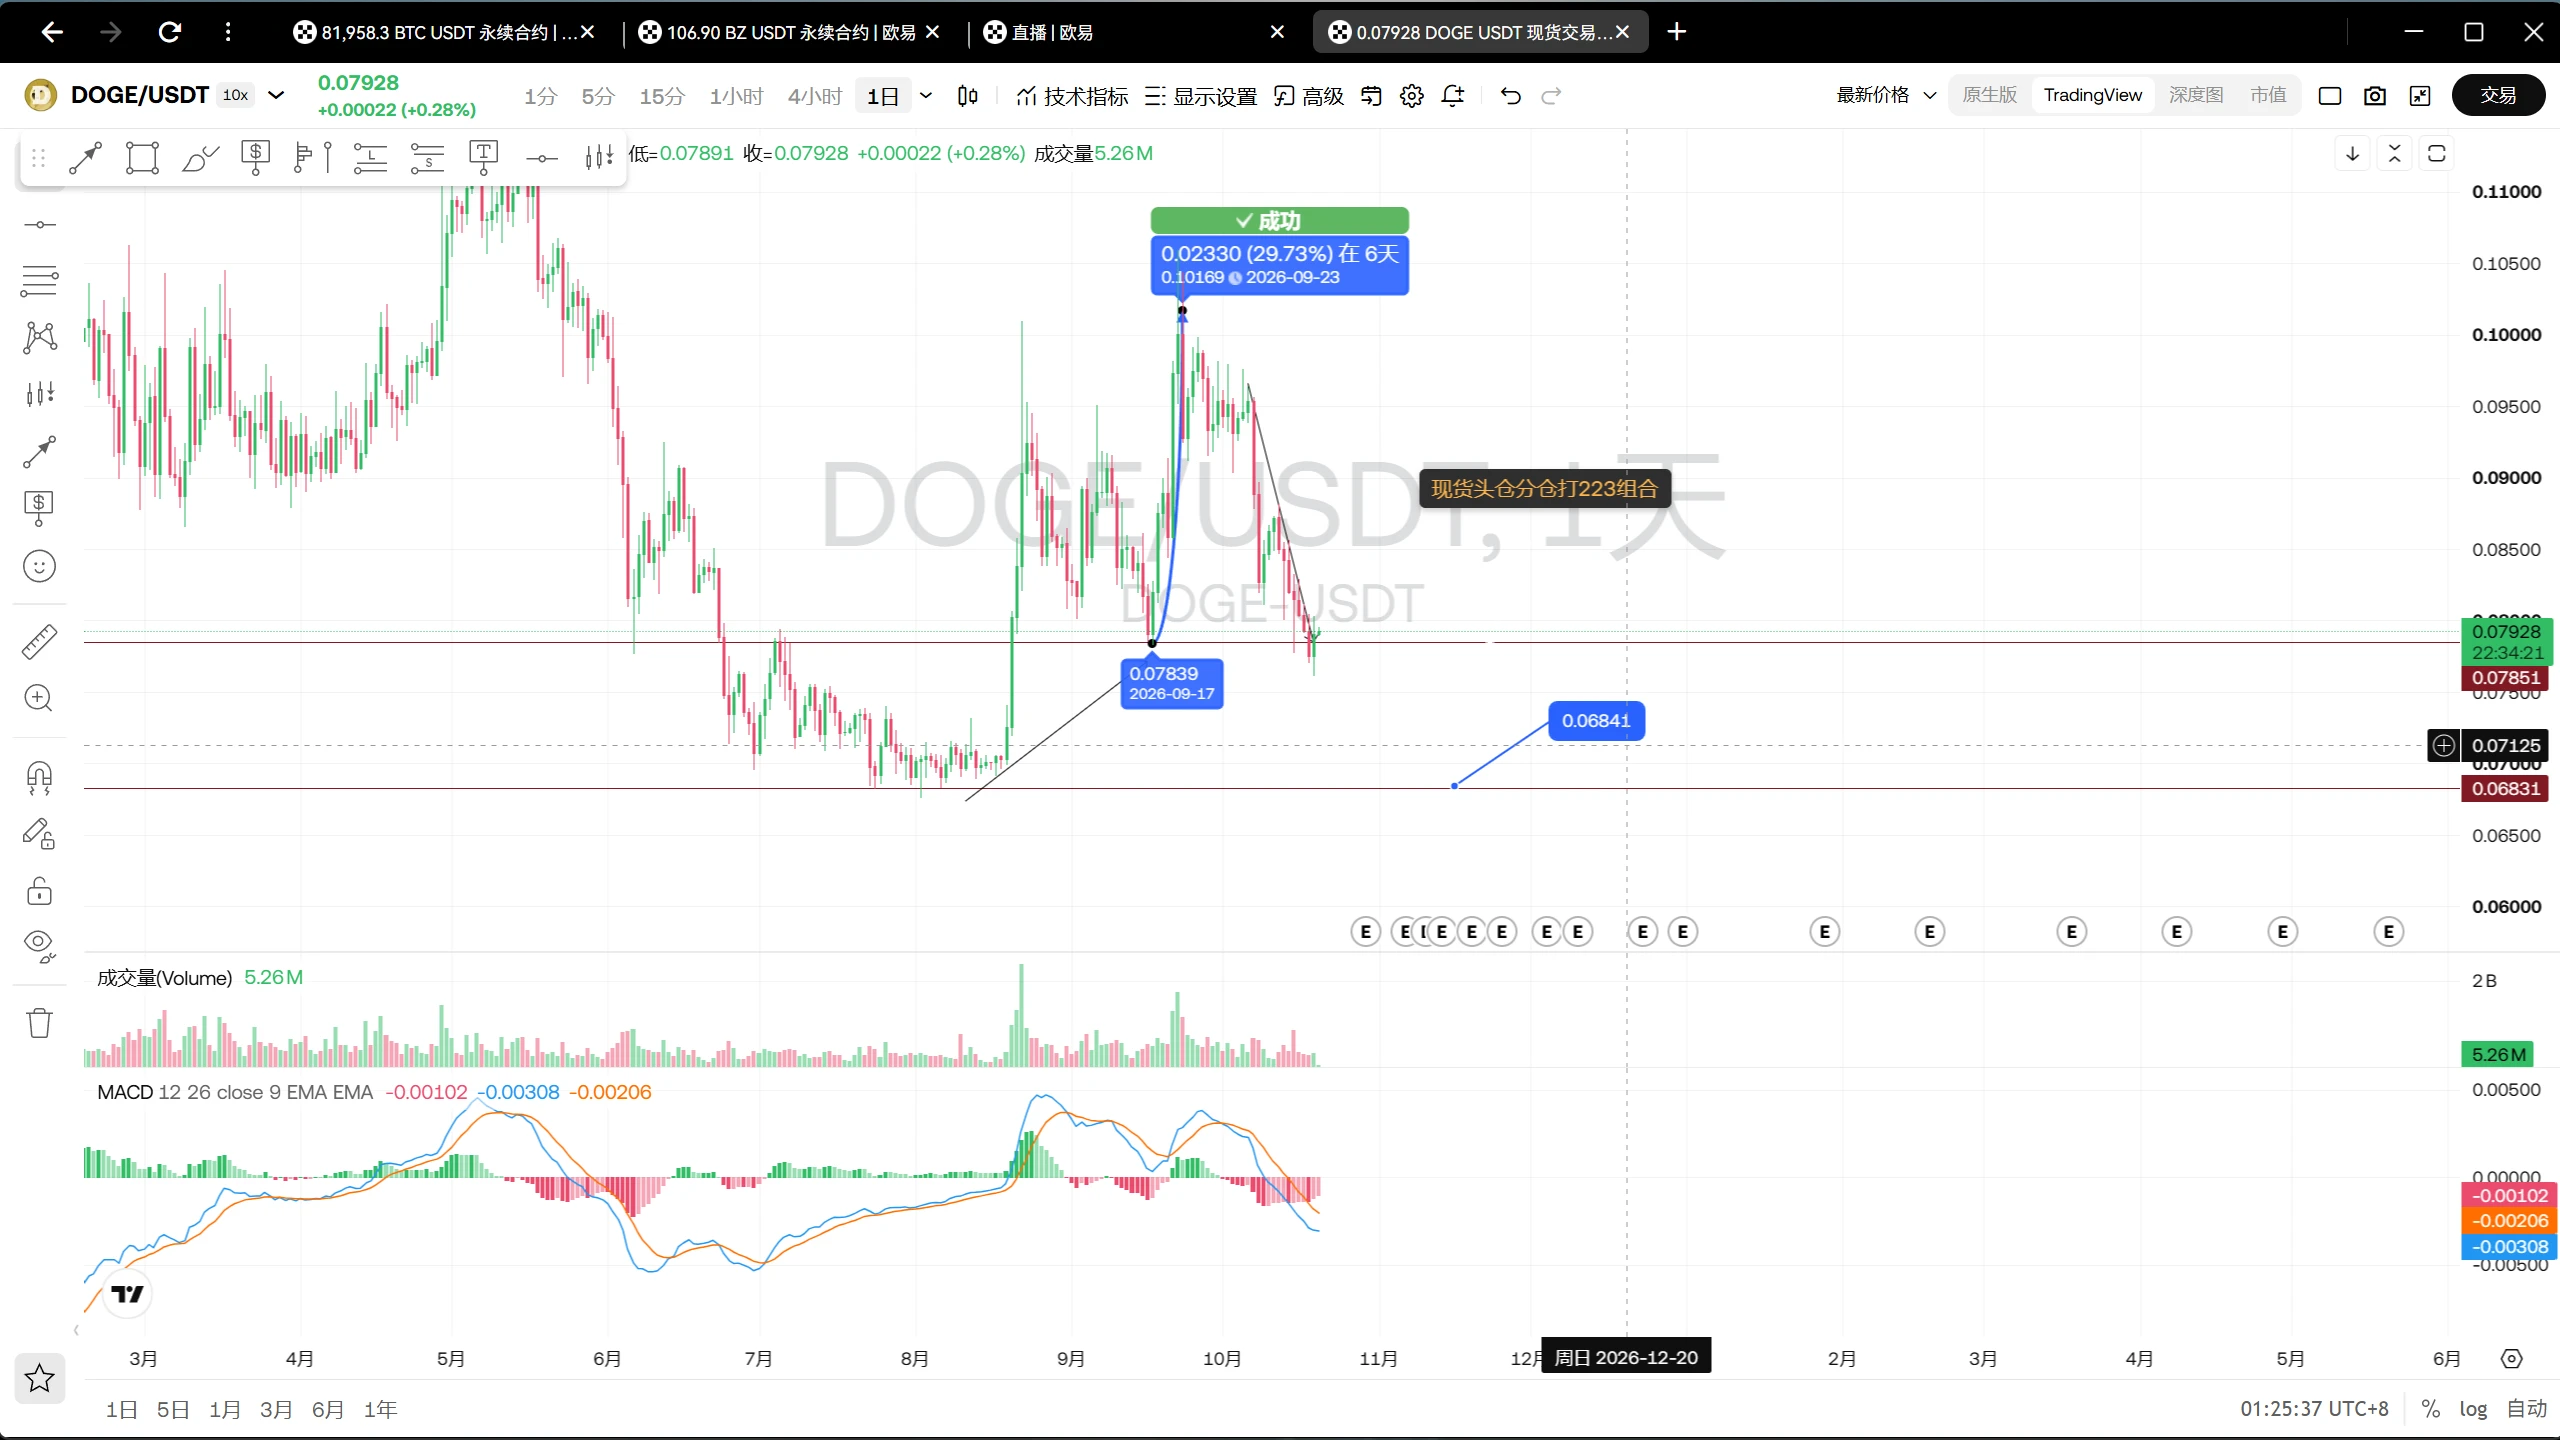
My hand trembled slightly when I set the stop-loss a few days ago; this morning I realized that was an unnecessary act of filial piety. $DOGE With this trend, I don't even need to think—the account is partying on its own.

The last thing I wondered before bed was whether to exit immediately. Luckily, I held back. During the intraday bottoming process, it repeatedly tested the waters, but every dip was pulled back up. As long as the key level held, the thesis remained intact. Panic is instinct; following the plan is the real skill.

My original entry was 0.08349. I dared to buy then precisel
post-image
DOGE+0.70%
SOL-1.46%
XRP-1.53%
#Solana: $105 Is the Key Level
$SOL ’s momentum is improving, but the weekly trend still needs confirmation.
• $105 = major resistance — Fibonacci, trendline and moving averages converge here.
• RSI bullish divergence suggests selling momentum weakened into the June low.
• Death cross remains active, keeping the broader trend under pressure.
• Stablecoin supply is around $16.4B, but DEX and perps volumes are declining — liquidity is rising, yet active demand remains unconfirmed.
Weekly close above $105 + successful retest → stronger recovery structure.
Rejection below $105 → broader downtrend
post-image
SOL-1.48%
when someone tells me I made a bad trade
post-image
This move is so obvious I don’t even need to think—the account is dancing on its own. 💃

I didn’t chase during the intraday plunge. When everyone else is running, that’s exactly when you need to stay calm. Once $ERA bounced back to around 0.06560, selling pressure clearly strengthened and no one was taking it higher, so I followed the trend and placed a short. Those few bounces looked convincing, but it couldn’t even touch the previous high—pure weakness. If it doesn’t reach my level, I don’t trade; anything outside the plan is gambling.

I just checked and it has already touched 0.06058,
post-image
ERA+1.34%
XRP-1.53%
BNB-1.54%
$IOST $DENT 【On-chain Asset Liquidity × Global eSIM Connectivity】
IOST: This wave is not a pullout of nowhere. IOST is currently focusing on multi-chain RWA infrastructure, the PayPIN payment application, and the upgrade path to IOST 3.0: only if asset issuance, cross-chain liquidity, and compliant identity capabilities continue to be implemented will they bring real use cases to the ecosystem. On the market, the current price is 0.0009614 USDT, up 31.82% in 24 hours, with a high-low range of 0.000694–0.0009838 and trading volume of about 51,600 U; the 15-minute chart has quickly risen from a
post-image
IOST+35.90%
DENT+28.51%
Insiders are watching $ZEC /USDT like a hawk right now.

$ZEC /USDT - LONG

Trade Plan:
Entry: 1156.80 – 1168.38
SL: 1106.97
TP1: 1204.31
TP2: 1232.12
TP3: 1273.84

Why this setup?
Why now? The daily trend is bullish with high conviction, the 1h price sits at 1162.59 inside a tight entry zone, the 15m RSI at 48.0 shows room to run without being overbought, and the 1h ATR of 23.18 confirms active volatility. Target 1 is 1204.31, target 2 is 1232.12, and the invalidation level of 971.33 acts as the hard line in the sand protecting the long.

Debate:
Are we heading to TP2 at 1232.12 or is 971
ZEC-4.96%
Load More

Join 40 M users in our growing community

⚡️ Join 40 M users in the crypto craze discussion

💬 Engage with your favorite top creators

👍 See what interests you

View More