Share your thoughts
placeholder
Article
After $ONDO rallied, I did not exit the entire position. I took profit on 80% first and moved the protection level for the remaining position above breakeven. Just now, a quick pullback swept out the remaining position, successfully locking in the profit.

The reason for entering was simple: on the hourly timeframe, the pullback to the previous high did not continue lower; instead, price reclaimed the moving average with increased volume. This was a typical pullback confirmation. After going long, I kept the stop-loss below the lower boundary of the small range.

After the pullback swept the
post-image
ONDO+2.44%
XRP-0.59%
SOL+2.28%
This was purely the market being in a good mood and casually scattering some gold coins—one just happened to hit me on the head. A few days ago in the afternoon, while watching $CLO ’s order book, I noticed something was off: the price kept hovering around 0.06977, but every dip was quickly bought back up. Signs of strengthening bottom-side buying like that can’t be faked. I added to my long position amid the repeated intraday swings and didn’t say much to anyone, posting only one line: “If the retest holds, I’ll test the waters.” Not long after, the move started paying me back.

I just check
post-image
CLO-5.78%
XRP-0.59%
DOGE+0.17%
BTC & ETH Face a Major Price Test Around the $83K Resistance Zone
live-cover
LIVE298
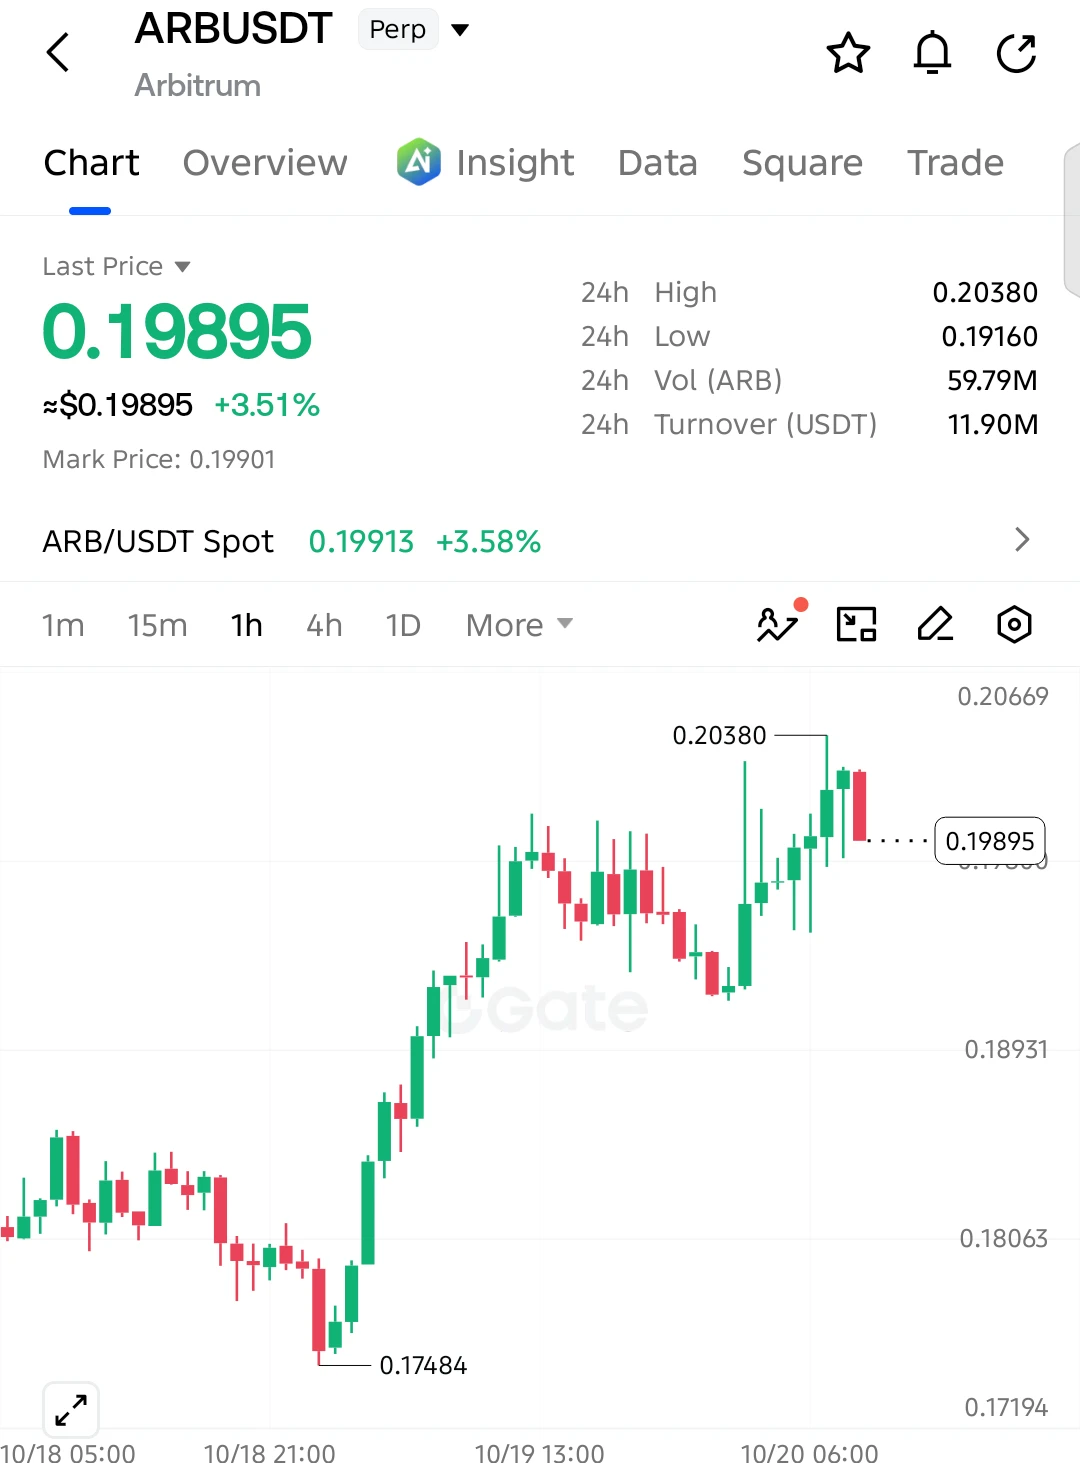
Nobody’s watching ARB bleed while the 4H chart whispers a dirty secret.

$ARB /USDT - SHORT

Trade Plan:
Entry: 0.18290 – 0.18696
SL: 0.20439
TP1: 0.17034
TP2: 0.16061
TP3: 0.14602

Why this setup?
- Price is pinned at **0.18493** with a **range-bound 1D**—that’s a coiled spring, not a floor.
- RSI 15m at **46.4** = no bounce fuel left; momentum is rolling over into the kill zone.
- ATR 1h (**0.0081**) says volatility is compressing—breakouts here are violent.
- Targets: **TP1 0.17034**, **TP2 0.16061**—that’s a 13% drop from entry before you blink.
- Why now? The “Armed” status on
ARB+38.69%
Nine years ago, a video appeared on YouTube. In this video, three memes are mentioned in the so-called video “Story Of a Meme”.
To be precise, only three memes are mentioned here: $PEPE , $DOGE , and yes, indeed: the $YEE meme.
What happened next with $PEPE and $DOGE will go down in crypto history. There’s one meme left to complete this mission: and that’s $YEE.
You can see at what level $YEE is trading right now. Will the story be completed?
post-image
PEPE-0.05%
DOGE+0.13%
  • 2
I wasn’t expecting this move to hold anyway, but the market directly handed me a big gift in the form of a short position. Now that’s what I call great service.
When I checked the charts after lunch, $COLLECT was still stubbornly holding up, but every rebound looked increasingly weak, with volume shrinking each time while the sell orders showed no mercy. With fewer and fewer buyers stepping in, I knew it was time to act. I entered a short around 0.06470 and left the rest to time.
The current price has now slipped to 0.04253, pushing the return to +674.69%. This profit feels great; even the lo
post-image
COLLECT-34.51%
ZEC+16.71%
LAB-2.88%
Selective capital rotation into catalyst-backed assets like $ZEC and ripple:native signals localized strength rather than a full market-wide altseason.
Bitcoin dominance remains elevated at 57.5%, meaning capital is not cascading down the risk curve into mid- or micro-cap altcoins. The current moves are isolated narrative surges driven by ETF developments and regulatory milestones rather than broad liquidity expansion.
A true altcoin season requires Bitcoin dominance to break down sharply while overall market liquidity accelerates. Until that shift occurs, these rallies represent tactical rota
post-image
ZEC+16.41%
BTC-0.42%
#GateEventContractTradeSharingChallenge #ZEC
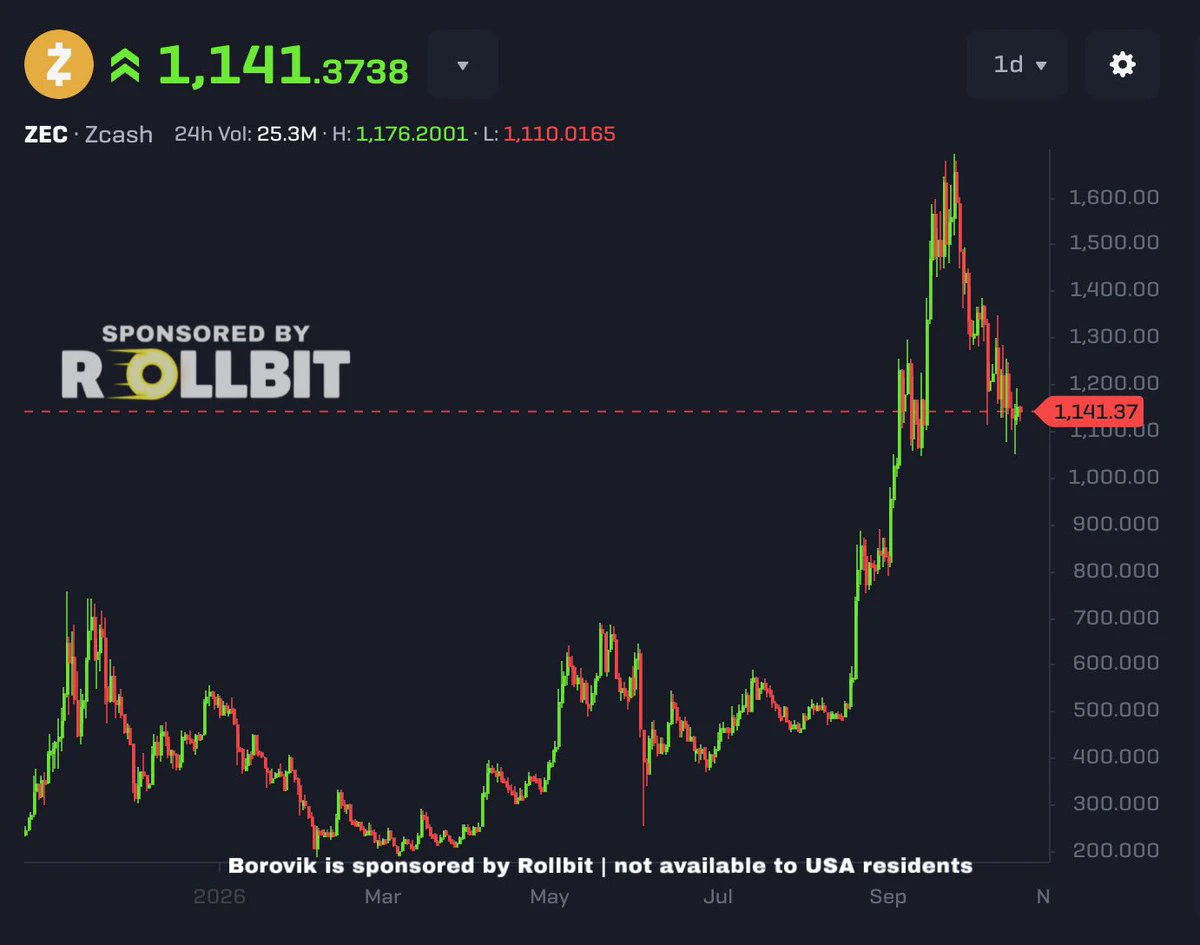
Zcash (ZEC) is showing exceptionally strong momentum. With your quoted current price around $1,189, the latest market data places ZEC around $1,184, with an intraday high near $1,204 and low around $1,005. That means the 24-hour move is roughly +16–19%, depending on the exchange and exact snapshot.
The most important development is that ZEC has successfully moved above the psychological $1,000 area after breaking through a major multi-year resistance zone. Recent reports attribute the acceleration partly to a short squeeze, with roughly $13M+ in Z
post-image
ZEC+16.41%
Altcoin Open Interest is picking up again 👀
Part of the overall increase is coming from TradFi linked tickers, but momentum is clearly spreading across the altcoin market.
$SOL , $BNB , $ARB , $XRP , $ETH and $ZEC have all recorded rising OI over the past few days.
Traders are gradually increasing their exposure.
post-image
SOL+2.28%
BNB-3.70%
ARB+38.69%
XRP-0.59%
ETH+0.51%
Bitcoin Returns to $80,000: Rally or Trap?
Bitcoin reclaimed the psychological $80,000 level after briefly coming under pressure from strong US NFP data. A 5% rise in 24 hours raises the question: is this the start of a new bullish trend or merely a temporary short squeeze?
Catalysts Behind the Rally
BTC's move was driven by changing interest rate expectations after Fed Governor Christopher Waller expressed support for holding rates in September. The probability of a rate hike fell from 70% to roughly 50/50, pushing risk assets including Bitcoin higher.
Although the August NFP figure (162,000)
BTC-0.42%
  • 16
  • 2
BAT pump pump bigpump ath go
post-image
BAT+2.03%
BIGPUMP+1.55%
Everyone’s staring at the bid, but the 4h tape just whispered a secret about TRUMP that nobody wants to hear.

$TRUMP /USDT - SHORT

Trade Plan:
Entry: 2.296 – 2.312
SL: 2.381
TP1: 2.246
TP2: 2.208
TP3: 2.150

Why this setup?
- The 15m RSI is already bleeding at 29.2—oversold, but that’s not a buy signal; it’s a warning that momentum is still pointing down.
- Price is hugging 2.304 with a hard ceiling at 2.381 (SL) and a daily trend that’s flat—meaning no rescue rally is coming.
- Why now? The ATR (0.032) shows volatility is compressing, and when that happens inside a range, the breakou
TRUMP-3.99%
#Gate60MillionUsers
60 million users is a huge number, but behind every number there is a different story. Here’s a small part of mine.
I joined Gate without really knowing how much this journey would teach me.
In the beginning, I was mostly curious. I would open the market, look at the charts for a while, watch prices move up and down, and then close the app thinking, “Maybe I’ll understand this tomorrow.” 😂
My first few weeks were basically a battle between curiosity and confusion.
I still remember one of my early trades. I had spent a long time watching a chart and finally convinced mysel
post-image
#USAugustNFPBeatsExpectations
August Jobs Report Beats Outlook
Fresh labor data from early autumn brought a welcome lift for observers who watch job creation. After weeks of cautious tone, August payroll growth came in above collective outlook, easing fear of a sharp slowdown and reviving debate over how solid household income remains.
① Labor Market Shows Renewed Vigor
The headline figure surprised many who had braced for a cooler period. Private firms led gains, while public sector hiring added modest support. Service related roles provided much of the push, with leisure, health care and
post-image
$UAI 2 is the amount dumped in 2 minutes. It rises for 8 hours. Fuck.
post-image
UAI+24.28%
I didn’t chase $EDGEX when it surged during the day, as a long-term trendline was right above it and it would have been difficult to place a stop-loss after entering. I waited for it to pull back and regain its footing before entering a long position based on the lower-timeframe structure.

After entering, it consolidated for a while. I didn’t rush to trade back and forth; once the price moved a certain distance away from my cost basis, I first closed 80% to lock in the profit on the core position, leaving the remaining 20% to follow the trend.

After the breakout candlestick appeared, I too
post-image
EDGEX-3.73%
XRP-0.59%
LAB-2.88%
Gold Prices Rise as Investors Track Inflation and Changing Interest Rate Expectations
live-cover
LIVE616
#BTCReclaims80K
BTC Reclaims 80K: Full Market Analysis, September 6 2026
Bitcoin is standing right on the psychological 80,000 line again. Early Saturday September 6, BTC trades near 79,980 on spot markets, up about 0.4 percent in 24 hours after tagging 80,200 earlier in the session. The reclaim story is not clean: BTC broke back above 80K on Wednesday, lost it violently on Friday's jobs report, and is now rebuilding above 79,500. That two-step-forward, one-step-back rhythm says it all: the institutional bid is real, but macro headlines still hold the steering wheel.
The weekly scoreboard put
  • 1
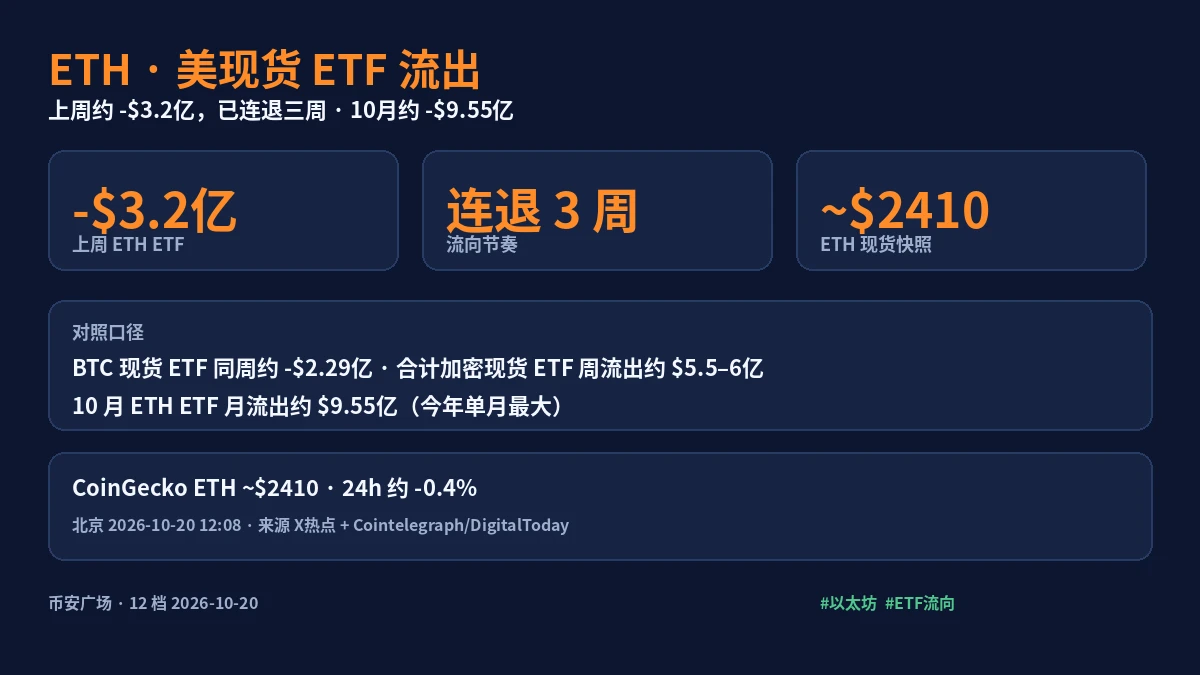
✨️💫 Bitcoin & Ethereum Face a Big Macro Test Next Week
While BTC is trading near $79,600 and ETH around $2,455, both are slipping as traders prepare for two major central-bank events.
US CPI arrives September 11, with inflation expected to stay at 3.4% as markets remain split 50/50 on whether the Fed hikes rates by 25 bps on September 16.
At the same time, markets are pricing in a 100% chance of a 25 bps ECB hike on September 10, adding another layer of pressure on risk assets.
That puts Bitcoin and eth between two macro catalysts: hotter inflation or more hawkish central banks could push pri
BTC-0.42%
ETH+0.50%
Everyone’s staring at the 4h chart, but the 15m RSI just screamed 38—who’s actually loading BNB shorts before the daily range snaps?

$BNB /USDT - SHORT

Trade Plan:
Entry: 745.06 – 747.64
SL: 758.74
TP1: 737.05
TP2: 730.86
TP3: 721.56

Why this setup?
- **Why now?** The 1D trend is *range*, but the 4h bias flips SHORT with a 55.4 confidence—that’s the “quiet before the dump” setup.
- **Key level:** Entry at 746.35 is armed. TP1 is 737.05 (a 1.2% scalp), but TP2 at 730.86 rides the mean reversion to the lower band.
- **Risk check:** ATR 1h is 5.16—tight enough to respect the SL at 758.7
BNB-3.70%
Load More

Join 40 M users in our growing community

⚡️ Join 40 M users in the crypto craze discussion

💬 Engage with your favorite top creators

👍 See what interests you

View More