Square
Following
Hot
News
Notifications
Profile
Share your thoughts
placeholder
Article
11.12 SOL Market Analysis

Short: around 84.50-85.20, stop loss at 86.20, targets 82.10/80.00.

SOL is currently at 83.54. After plunging from 85.80 to 82.11, the market is now moving sideways around 83.5. The bulls' attempts to push higher are very weak, with price largely held down by the short-term moving averages. The overall bearish mood remains unchanged.

The current price is in the middle of the range, so chasing shorts now could easily get shaken out by a rebound. The 84.50-85.20 area overhead is where positions were left behind during the earlier sharp drop. If price rebounds to test
post-image
SOL-0.74%
Why can trading strategies that perform excellently in backtests fail in real markets?

A trading strategy may show strong historical returns, a high win rate, and a maximum drawdown within an acceptable range. So why might the results be completely different once it is deployed in the real market?

This does not necessarily mean backtesting is worthless. Rather, performance on historical data does not equal replicable returns in live trading.

To determine whether a strategy is truly effective, you need to understand several key issues behind its backtest results.

I. Data bias: The foundatio
post-image
Trenches
Max
M
bade
b
Max
5qaP...pump
Market Cap
$.
Change
.
24h Vol
$.
Holders
.
mihao
m
bade
b
mihao
4Cxj...pump
Market Cap
$.
Change
.
24h Vol
$.
Holders
.
AGT
A
bade
b
AGT
0x5d...e274
Market Cap
$
Change
.
24h Vol
$.
Holders
.
DacityCoin
D
bade
b
DacityCoin
DKYc...pump
Market Cap
$.
Change
.
24h Vol
$.
Holders
.
FLOAT
F
bade
b
FLOAT
Bv1a...BMmr
Market Cap
$
Change
.
24h Vol
$.
Holders
.
What Are Stablecoins? Why Have They Become Key Web3 Infrastructure? From Value Pegging to Real-World Applications, Understanding How Stablecoins Work and Their Risks

In the cryptocurrency market, Bitcoin and Ethereum are often subject to price volatility, while stablecoins aim to offer digital assets with relatively stable prices.

Whether for trade settlement, cross-border payments, DeFi lending, or moving assets between different blockchain networks, stablecoins are playing an increasingly important role.

But stablecoins are not risk-free. Understanding how they maintain their prices, what
post-image
BTC-0.67%
ETH-1.26%
Recently, after browsing through communities and comment sections, I found that “the bull market is dead” has almost become consensus, with pessimistic takes everywhere. Against this backdrop, Jiang Zhuoer’s remarks stood out all the more, like a stone thrown into stagnant water. $BTC $ETH $SOL
Risk warning: The above is only a personal opinion and does not constitute any investment advice. The crypto market is highly volatile, so please do your own research and manage your position size.
post-image
BTC-0.67%
ETH-1.26%
SOL-0.77%
#ShareWeekly #BTC #WCTCS9

Bitcoin's latest correction is a reminder that leverage can turn an ordinary market decline into a much larger sell-off. When BTC loses an important support level, traders using high leverage can face forced liquidations, creating additional selling pressure and making recovery more difficult.

The reported $600 million liquidation risk deserves attention, but I believe the most important question is not simply how much money could be liquidated. It is where those liquidations may accelerate and whether buyers are prepared to defend the next support zones.

1. The $
BTC-0.67%
  • 2
  • 1
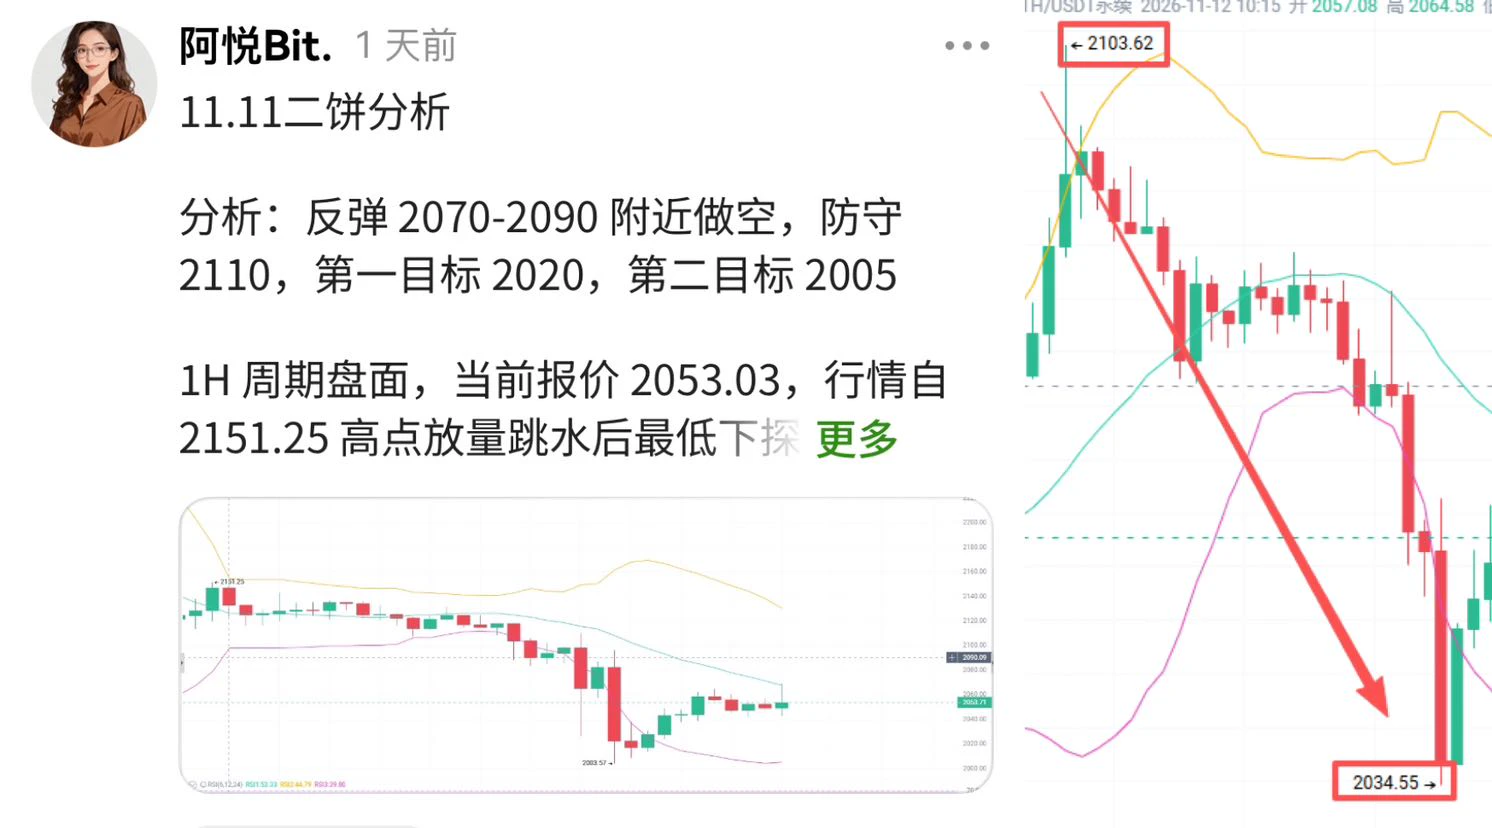
ETHEREUM SLIPS TO $2,053 AS SELLING PRESSURE OUTPACES BITCOIN

Ethereum is trading near $2,053, down 0.49% over the last 24 hours, making it the weakest performer among BTC, ETH and SOL in this market update.

ETH has traded between $2,035 and $2,103, reflecting continued uncertainty around its short term direction.

The $2,035 area is an important level for buyers to defend. A recovery above $2,103 could help restore bullish confidence, while a decisive move below support may bring additional selling pressure.

Ethereum needs stronger buying activity to turn the current weakness around. For n
post-image
NVDA+2.99%
SNDK+13.75%
ETH-1.26%
[ NEW STREAMER ] MARKET POSITION
live-cover
LIVE1,566
Understand DeFi Protocols: Don’t Just Focus on APY—Where Does the Yield Come From, and Who Bears the Risk?

In DeFi (decentralized finance), one question that’s easy to overlook is: when a protocol advertises an attractive annual percentage yield, where exactly does that yield come from?

APY is just a way of displaying the outcome; it doesn’t, on its own, prove that a protocol is worth participating in.

To assess whether a DeFi protocol is sustainable, you can start with these four areas.

I. Where does the yield come from?

Yield may come from interest paid by borrowers, trading fees, liqui
post-image
What Exactly Are Wallet Seed Phrases and Private Keys, and Why Are They So Important?

In the Web3 world, creating a wallet is easy, but not everyone truly understands who controls it.

Many people know that seed phrases must not be disclosed, but may not be clear on how they differ from private keys or why a wallet can still be recovered after losing a phone.

To understand these questions, we first need to clarify three concepts.

I. What Is a Private Key?

A private key is secret information used for cryptographic signing. In many blockchain wallets, a private key can authorize transactions
If You Buy an NFT, Do You Own the Copyright to the Work? Many People Get It Wrong from the Start

In the Web3 world, buying an NFT often means gaining control of a specific on-chain token. But does that also mean you own the copyright to the corresponding image, music, or digital work?

The answer is: not necessarily.

To understand the true value of an NFT, you need to distinguish between three different concepts.

I. You Own the On-Chain Token, Not Necessarily the Copyright to the Work

An NFT is a non-fungible token recorded on a blockchain. It can be used to identify a specific digital ass
post-image
Why might a trading strategy that performs well in backtests fail in live markets?

A trading strategy may show good historical returns, a high win rate, and a maximum drawdown within an acceptable range. So why might the results be completely different once it is actually deployed in the market?

This does not necessarily mean backtesting is worthless. It is because performance in historical data does not equal returns that can be replicated in live trading.

To determine whether a strategy is truly effective, you need to understand several key issues behind its backtest results.

I. Data bia
post-image
Is this really a nightmare? It shouldn’t be, right? 🫣
post-image
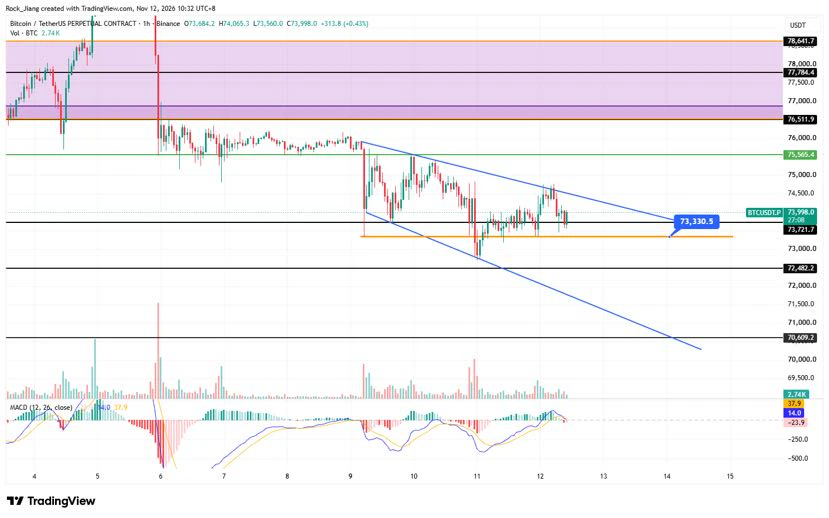
Featured11.12 Thursday Market Overview: BTC is moving sideways within a descending wedge channel

BTC closed the morning with a small bullish candle featuring upper and lower wicks, as bulls and bears battled back and forth

BTC is inside a descending wedge channel. Several touches of the upper descending trendline have failed to produce a valid breakout, and the rebound lacks strength

7.37 acts as a horizontal line within the channel, serving as a key pivot with frequent support-resistance flips. It is again hovering near 7.37 in the early Asian session

7.33 provides minor support within the channe
post-image
BTC-0.65%
  • 2
  • 2
A vision. A moment. A final surprise.
post-image
  • 1
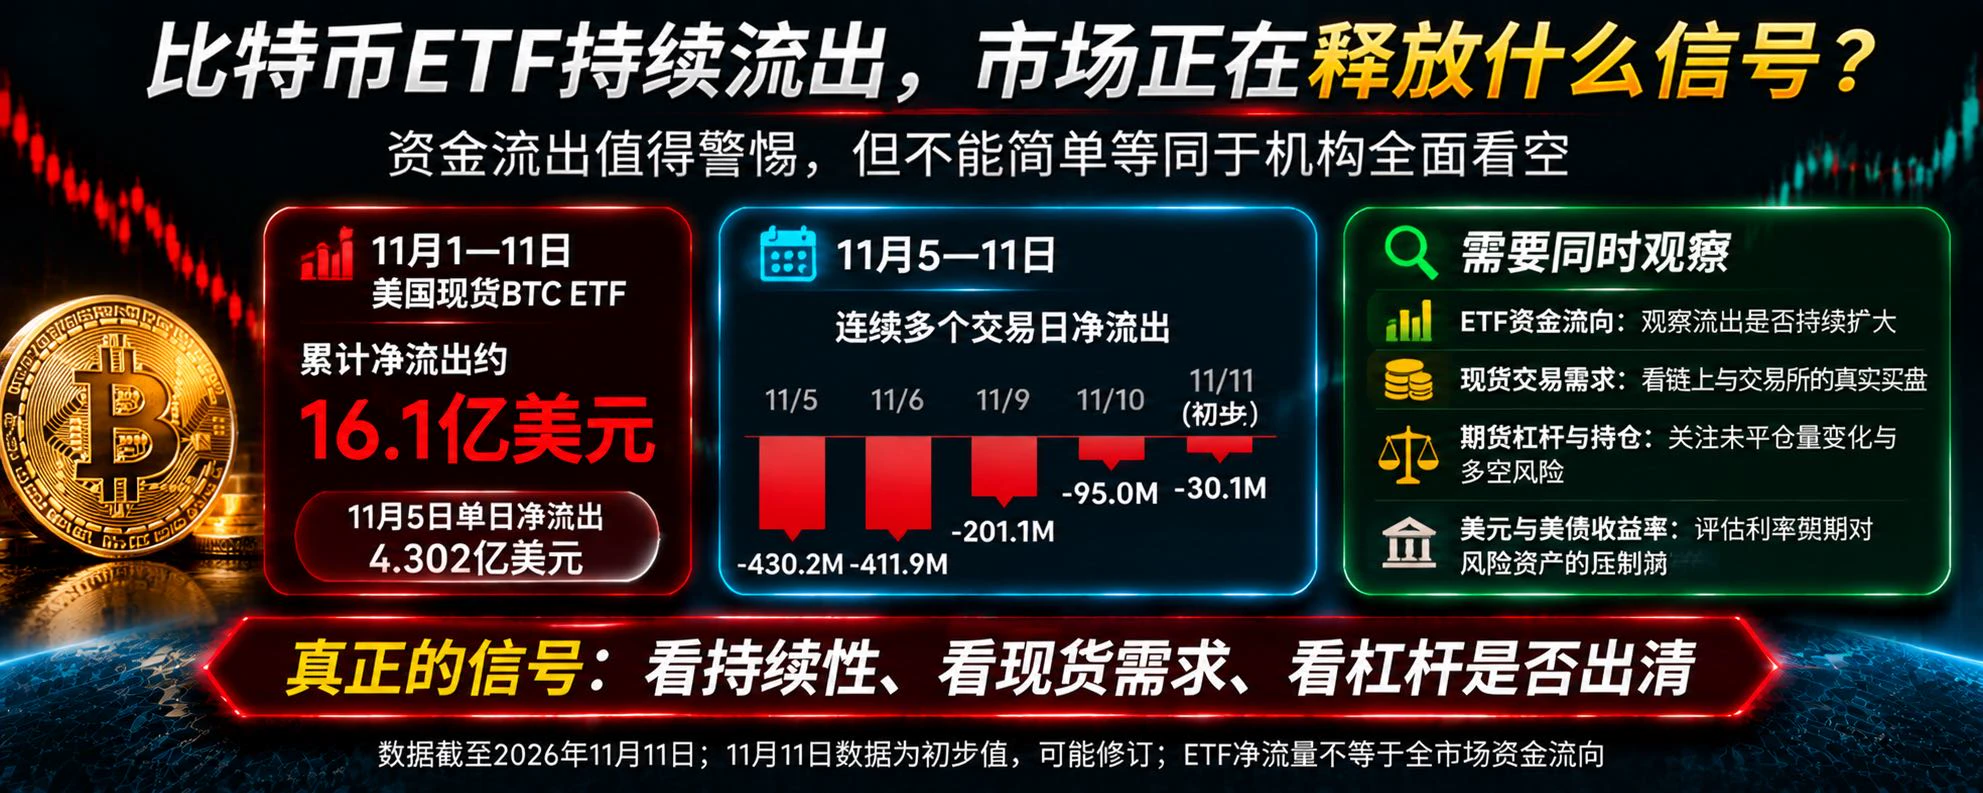
Bitcoin ETFs continue to see outflows. What signal is the market sending?

Recently, the Bitcoin market has shown a concerning trend: U.S. spot Bitcoin ETFs are experiencing a significant wave of net outflows. This is about more than price volatility; it also reflects some investors reassessing risk.

According to public data as of November 11, 2026, U.S. spot Bitcoin ETFs have seen cumulative net outflows of about $1.61 billion this month. On November 5, net outflows totaled about $430.2 million in a single day, followed by $411.9 million in net outflows on November 6. Outflows narrowed over
post-image
BTC+1.22%
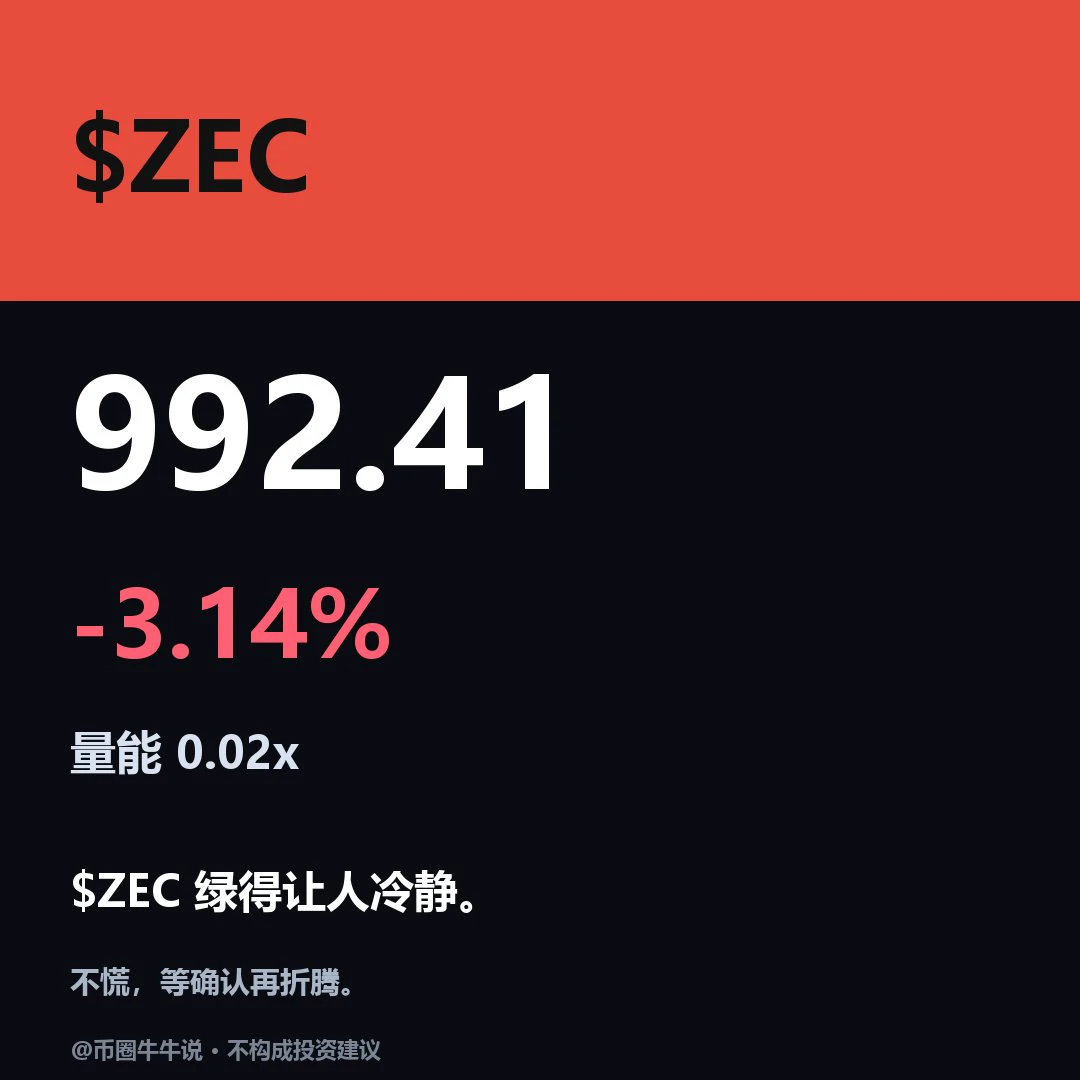
$ZEC It is currently at 992.41, down 3.14% over 24H. The 1H and 4H structures are both weak: on the 1H chart, price is hovering below EMA20 (997.11) with RSI14 around 49; pressure is more pronounced on the 4H chart, where RSI14 is as low as 19.48. Current volume is only 0.02 times the average volume of the past 20 or so bars, indicating insufficient participation. If price later breaks above and holds the 1031.67 resistance with increased volume, the strength of any recovery can be monitored; if it breaks below the 951.21 support, weakness may persist. The key point to review is whether price
post-image
ZEC+1.16%
Erbing’s thesis played out as expected.
All rebound shorts are in place, and the timing was perfectly managed.
#Gate直通IPO第三期Anthropic $ETH ‌
post-image
ETH-1.26%
Why do more detailed trading records make it easier to spot problems in a strategy?

Many traders have a habit of reviewing their trades, but an effective review is not simply a record of how much money they made or lost that day.

If a trading record only includes the entry price, exit price, and final profit or loss, you may know that you lost money, but it will be hard to know why.

The value of trading records lies not in preserving the past, but in helping you identify recurring problems.

I. Why is recording only profit and loss far from enough?

Suppose two trades both lost $100.

For t
post-image
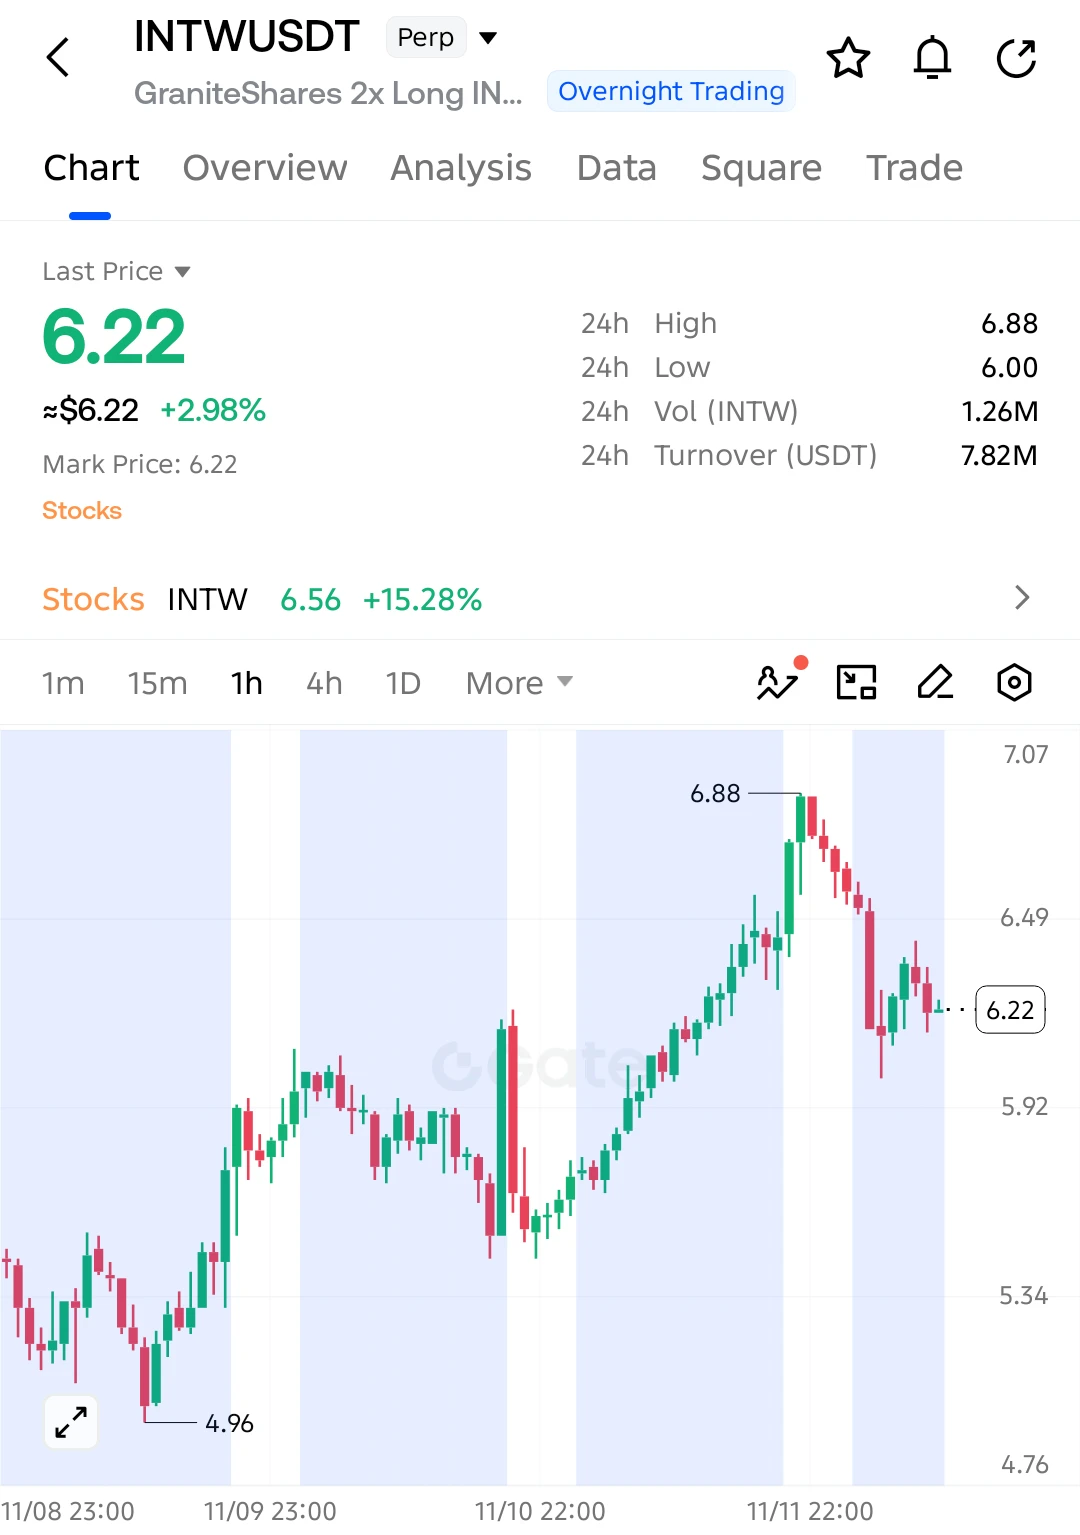
$INTW LONG SETUP — BULLS EYEING ANOTHER BREAKOUT!

Entry: 6.22
SL: 5.98

TP1: 6.40
TP2: 6.60
TP3: 6.88

$INTW is showing signs of recovery after pulling back from 6.88. Buyers are defending the 6.00 support area, but price still needs to reclaim 6.40 to confirm stronger bullish momentum. A successful breakout could open the way toward the previous high.

Invalidation: A sustained break below 5.98 weakens the bullish setup.
post-image
INTW+0.26%
  • 1
Load More

Join 40 M users in our growing community

⚡️ Join 40 M users in the crypto craze discussion

💬 Engage with your favorite top creators

👍 See what interests you

Trending Topics

GateIPOAccessAnthropic

247.65k Views2.31k Discussing

Gate IPO Access Phase 3 features Anthropic (ANT), with USDT subscription interest starting from 100 USDT. Successful allocations will be delivered as real shares to Gate Stock Accounts. Indicative price: $70–$78/share Subscription: Nov 12–17 (UTC+8) Allocation is not guaranteed. Please manage risk accordingly.

USJoblessClaimsTonight

165.72k Views32.8k Discussing

JensenHuangCouldFaceRemoval

219.19k Views2.42k Discussing

View More