Square
Following
Hot
News
Notifications
Profile
Share your thoughts
placeholder
Article
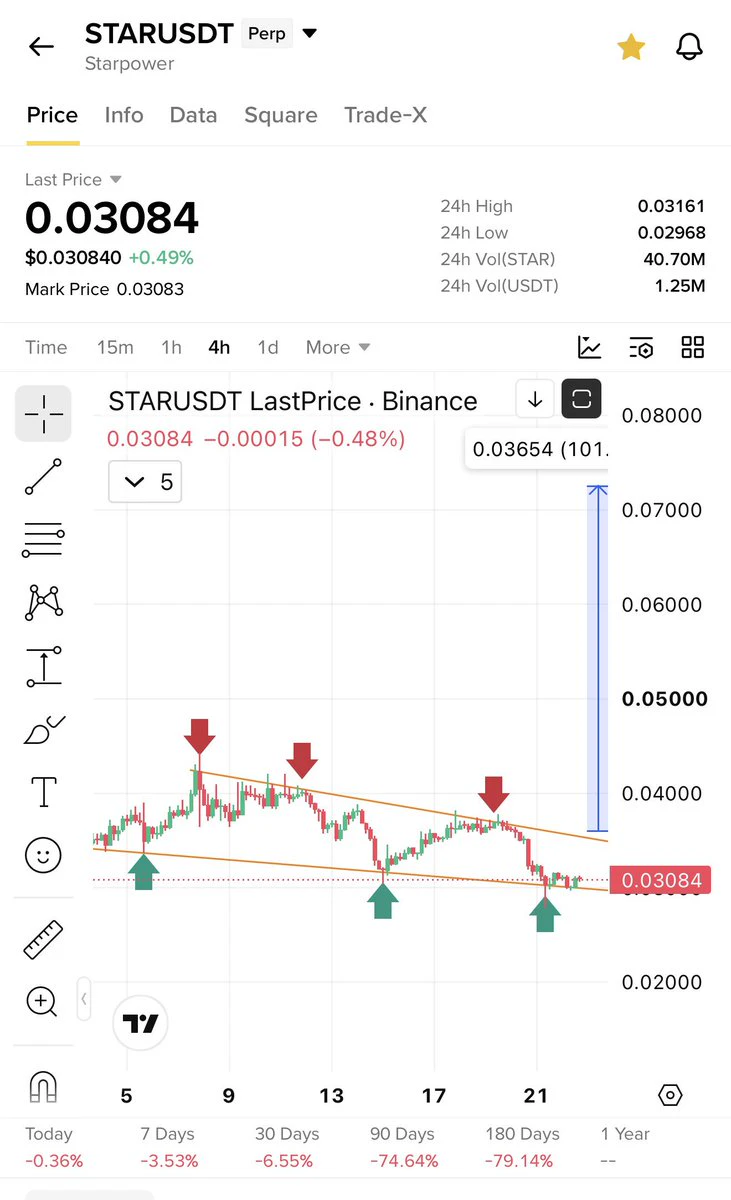
$Star most perfect falling wedge
post-image
$BE It has recently pulled back all the way from its highs. The daily chart shows a clear bearish alignment, with price overall in a breakdown-driven downtrend channel. Open a short near 163.0.

That level is right at the retest confirmation point after the previous low support broke, and within a resistance band formed by several short-term moving averages—a prime spot for bears to add to their positions with the trend.

Don’t try to catch the bottom. Wait for the daily MA5 to cross above the MA10, a bullish MACD cross below the zero line, and a volume-backed hold above 166.5; only then would
BE+0.90%
BTC-0.65%
ETH-1.23%
  • 4
  • 1
Trenches
PIEVERSE
P
bade
b
PIEVERSE
0x0e...25a9
Market Cap
$.
Change
.
24h Vol
$.
Holders
.
IDOL
I
bade
b
IDOL
0x3b...ab07
Market Cap
$.
Change
.
24h Vol
$.
Holders
.
JAGENT
J
bade
b
JAGENT
0x8e...ae15
Market Cap
$.
Change
.
24h Vol
$.
Holders
.
Singularity
S
bade
b
Singularity
7R4M...pump
Market Cap
$.
Change
.
24h Vol
$.
Holders
.
mihao
m
bade
b
mihao
4Cxj...pump
Market Cap
$.
Change
.
24h Vol
$.
Holders
.
#GoldNears3500
Gold Nears $3,500: Is the Safe-Haven Trade Breaking Down?

My view is that gold's recent weakness reflects a change in macroeconomic conditions rather than the end of its safe-haven role. However, the simultaneous decline in stocks and gold is an important warning sign.

Gold is a safe haven, but it is not immune to liquidity shocks. When investors face broad market losses, rising margin requirements, or pressure to raise cash, they may sell even traditionally defensive assets.

I would separate the situation into three factors:

Strong US dollar: A stronger dollar makes gold m
XAUUSD-2.40%
#ETH
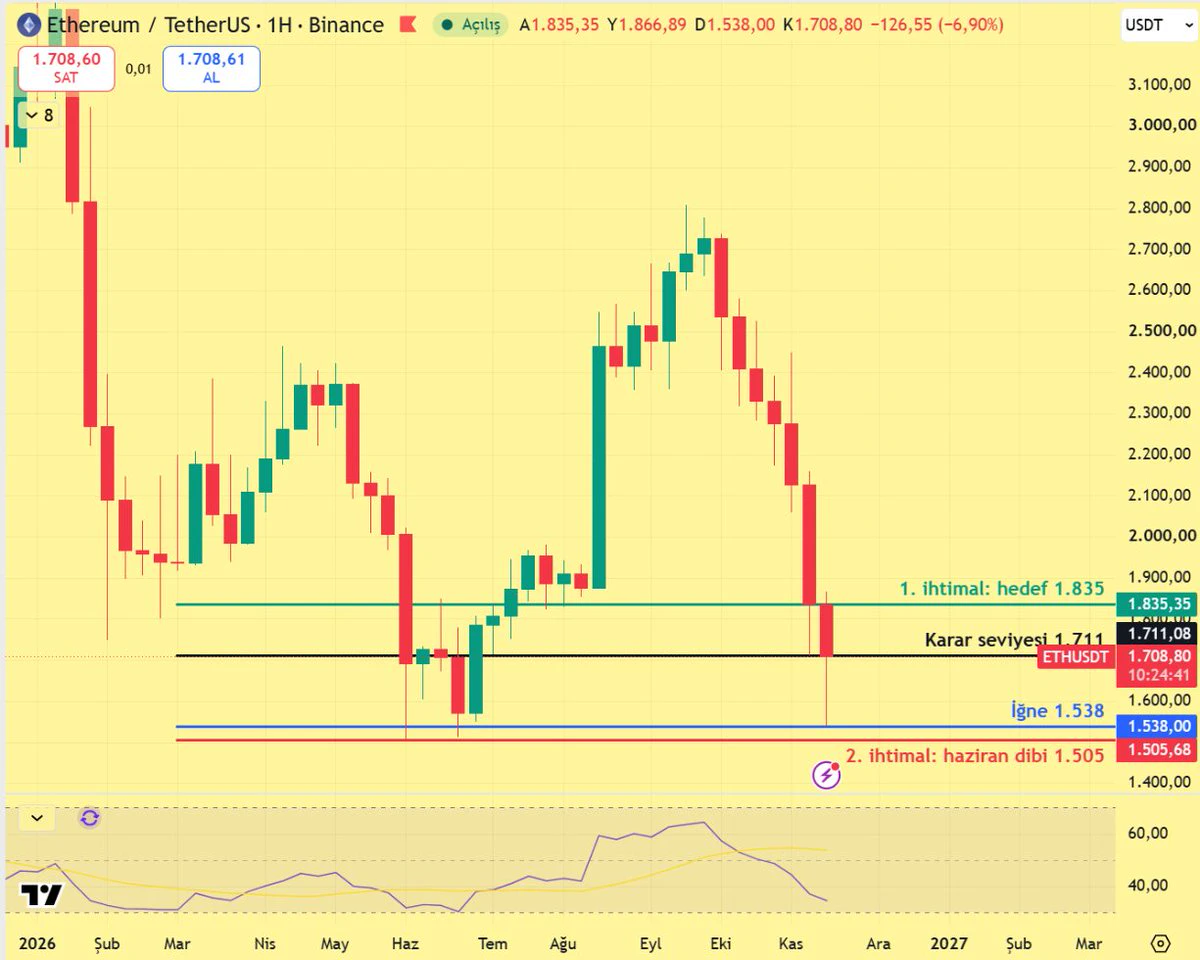
Two possibilities on a weekly basis
Friends, let's discuss both possibilities for Ethereum $ETH .
The week opened at 1,835. The price fell to 1,538 on Saturday and recovered to 1,732 today. It rose above last week's low of 1,711 but failed to hold above it, and is currently right around this level.
First possibility: 1,538 remains the low. Since the June low of 1,505 has not been broken, the structure is stronger than Bitcoin's. If the weekly close is above 1,711, the 1,835 level I marked on the chart will be the target. For the Libra reading, the threshold is a weekly close above 1,800.
post-image
ETH-1.26%
  • 1
Take a quick bite and get out; no entry points recommended for these wild coins.
Keep it up, everyone. Put your take-profit inside your stop-loss.
If you get stopped out, just accept it.
Because when you get hit, you have to stand at attention.
​#晒出我的持仓收益
post-image
PIEVERSE+0.50%
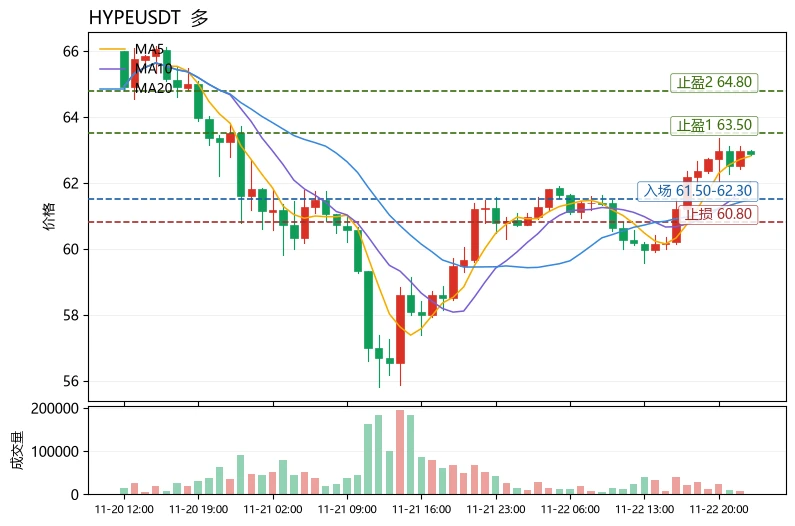
$HYPE Current price: 62.88. The upper Bollinger Band at 63.52 is the first resistance, while MA20 at 61.50 is the short-term bullish defense. A break below 61.50 would invalidate this bullish structure, with the next support at the lower Bollinger Band at 59.48.
Bullish case: MA5 has crossed above MA20, and the MACD histogram at +0.2432 remains bullish. However, RSI at 63.3 is nearing overbought territory, and the price is hugging the upper band, making the risk of chasing higher significant. Volatility-wise, the 30-candle range is about 8.3%, moderately high; no single position should exceed
post-image
HYPE+0.24%
MMT-2.35%
NEAR+1.17%
Today is the second day, everyone. Thanks to the first group for trusting me. The goal is to grow fivefold in a month, but I still recommend that anyone following me withdraw their principal as soon as it doubles, then keep following with the profits. I’ll be more aggressive during the first week and more cautious afterward. My approach is basically on par with super AI quantitative trading, and I absolutely don’t get greedy. Today, my tiny position also earned a 13% return on the principal. If you trust me, I recommend following with a one-time amount that’s within your risk tolerance!! Then,
  • 10
$PIEVERSE Fuck your mother. Getting screwed over back and forth.
PIEVERSE+0.58%
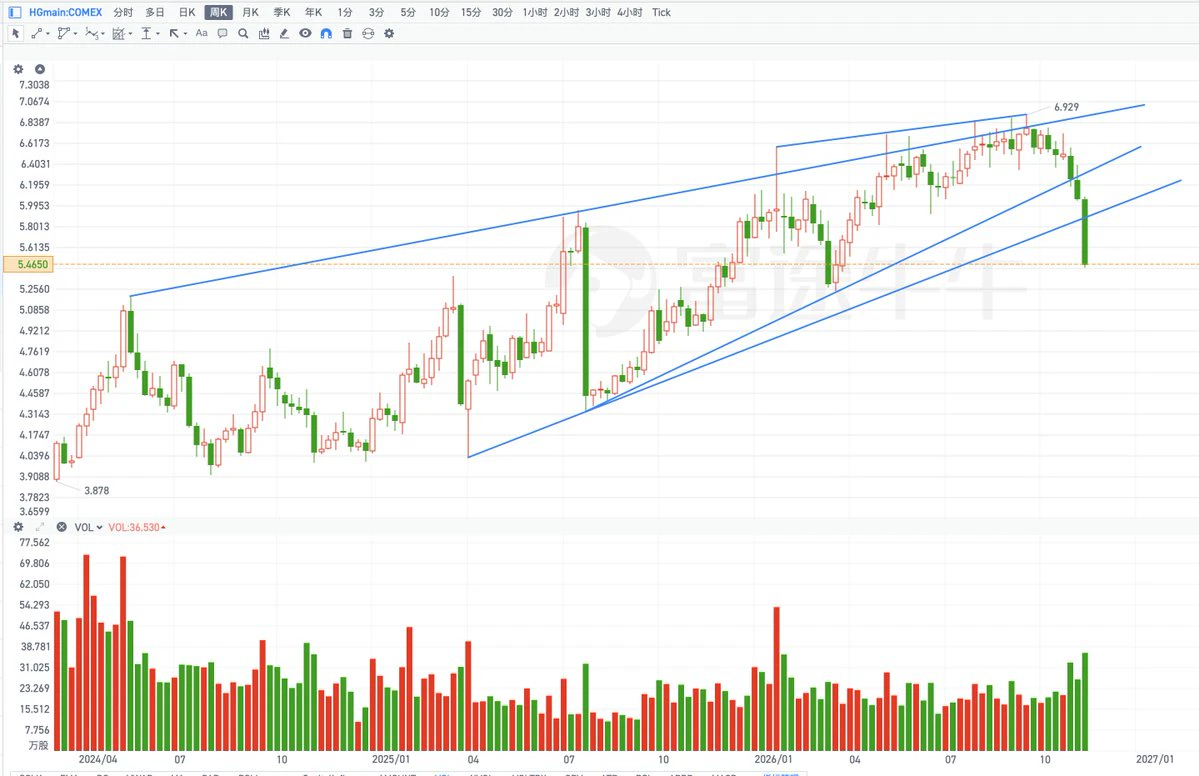
Copper futures: The nested wedge reversal structure is complete. Below 5.73, the outlook is bearish. Price should stabilize and consolidate around the previous high of 5.375. If it falls further after the rebound ends, it could reach around 4.6 in the medium term.
post-image
XCU+0.20%
evening updates about btc with skyvera
live-cover
LIVE2,302
BTC-0.67%
ETH-1.26%
SOL-0.77%
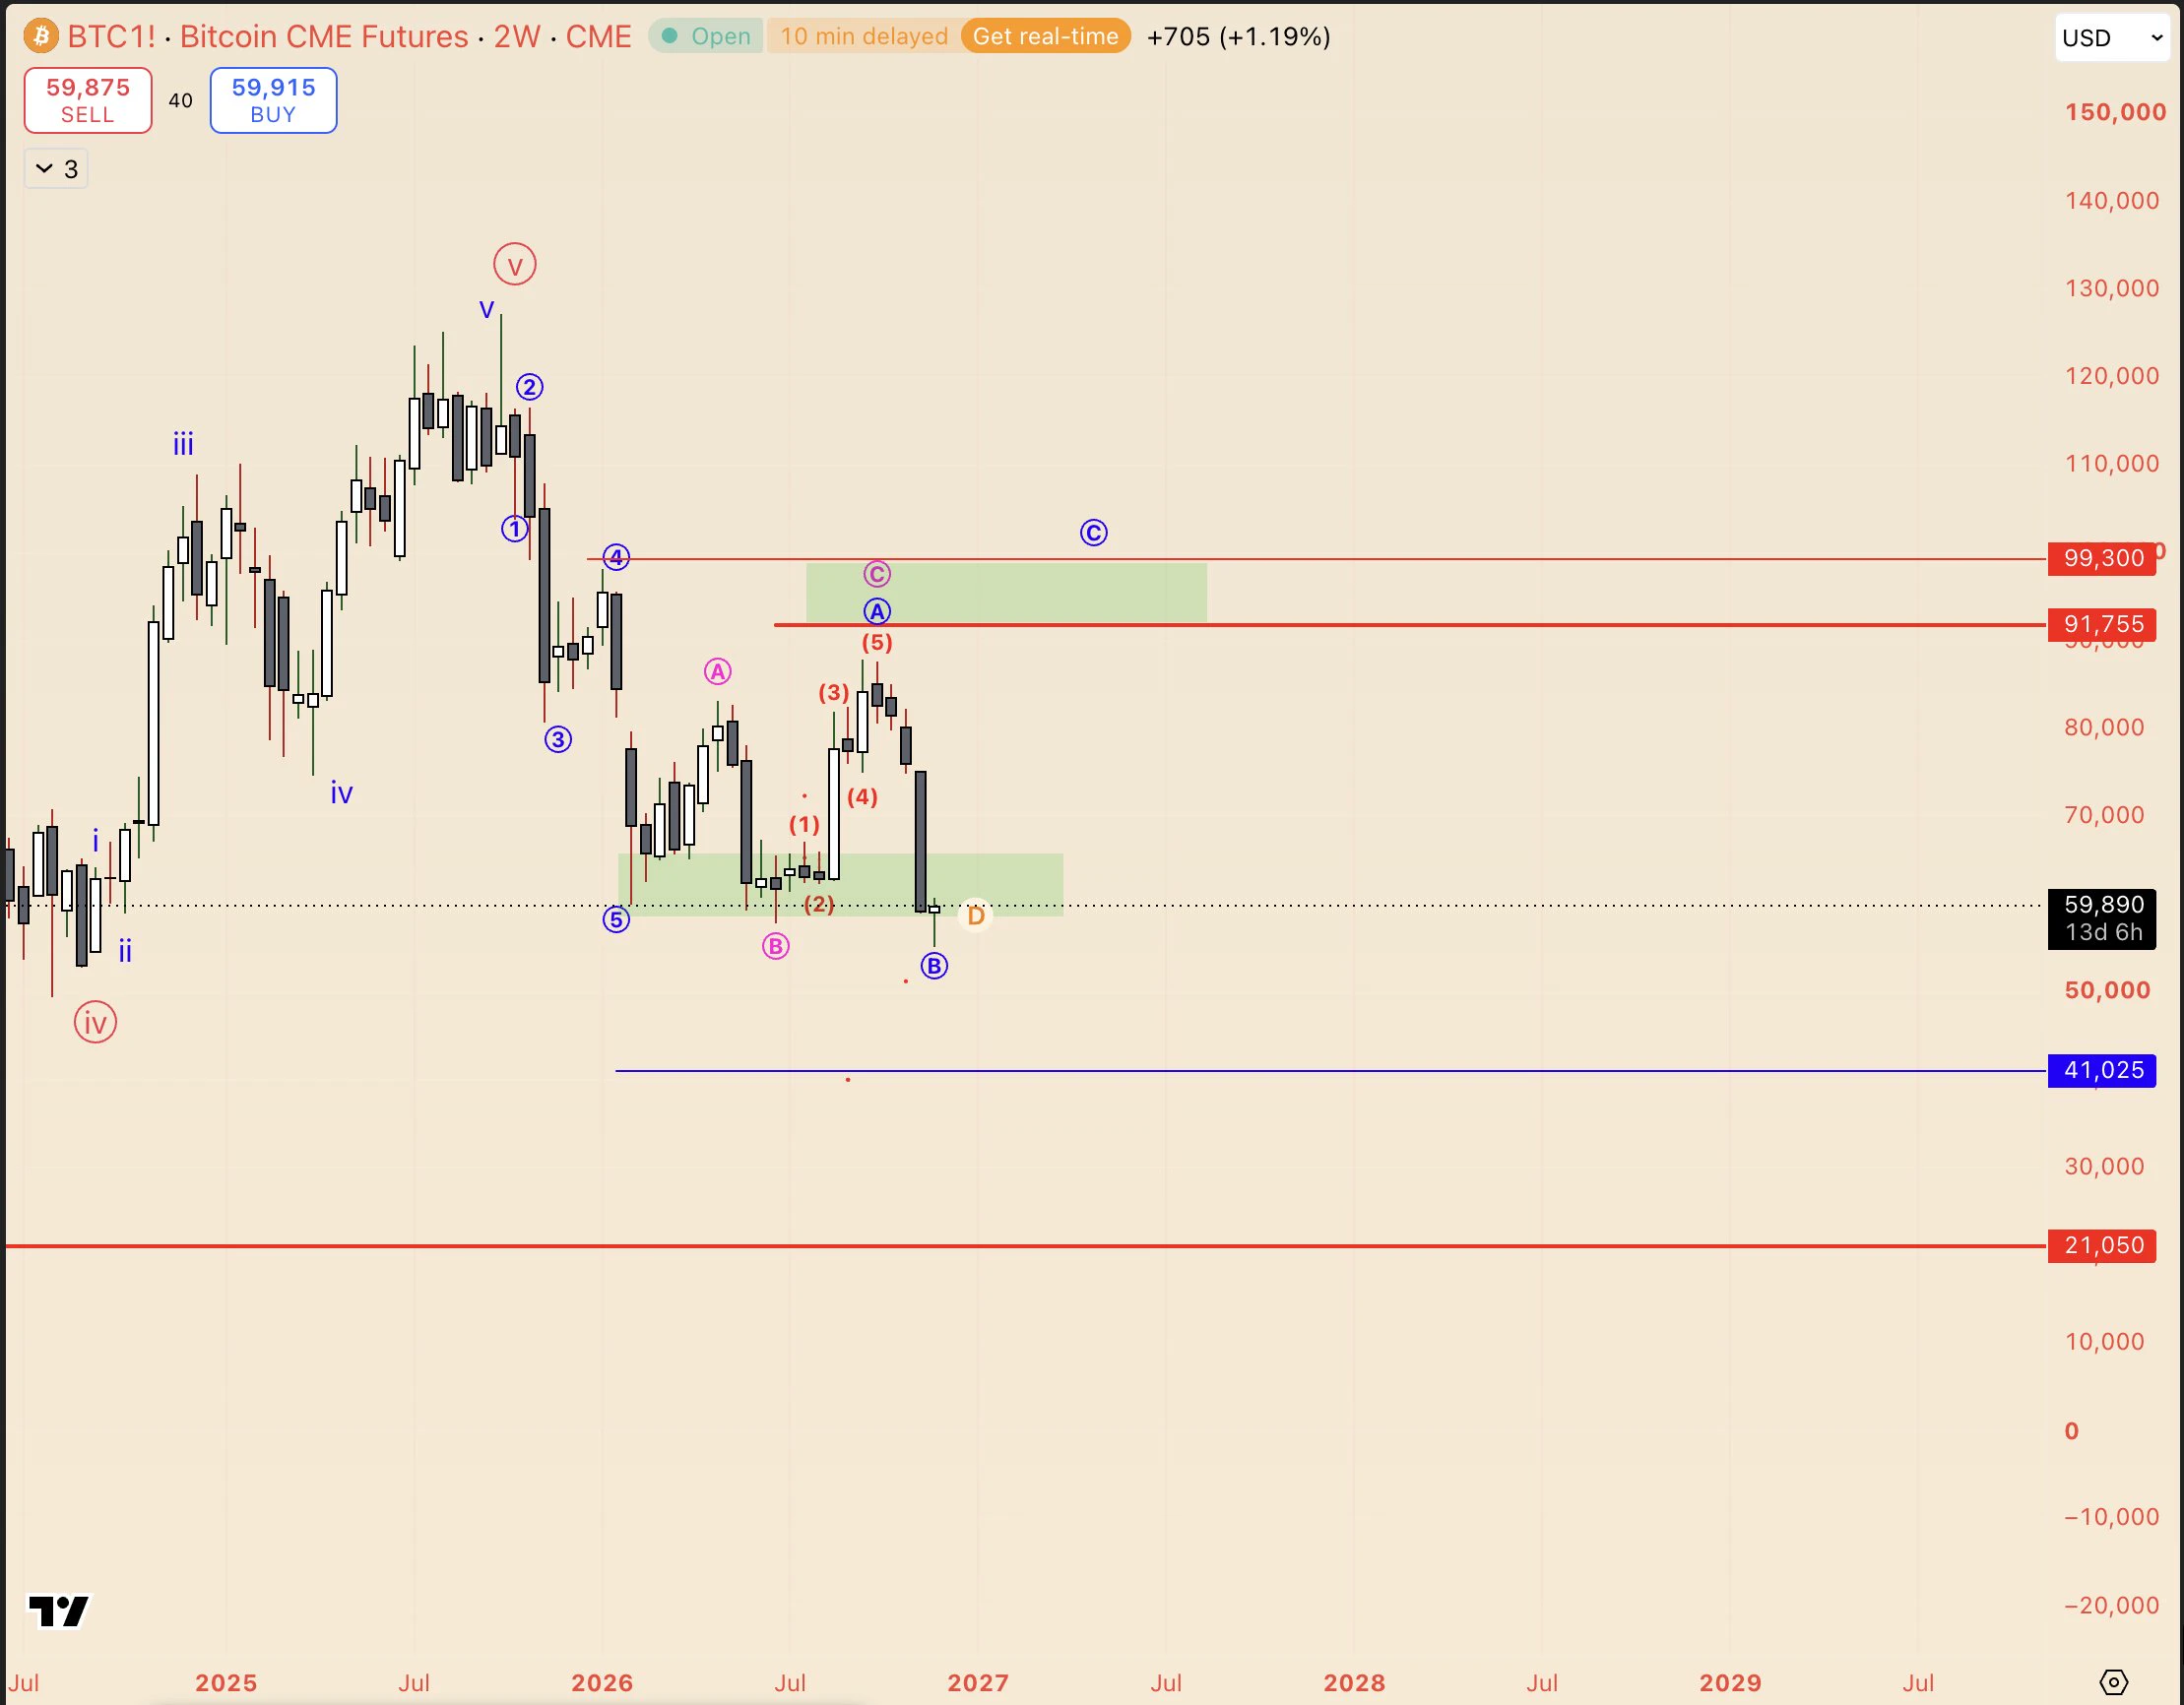
#BTC,我们跌破支撑位,现在又迅速反弹回来。

The end of the month will be decisive: where will BTC go over the next two months? 1/n
post-image
BTC-0.67%
The current ETH/USDT market presents a complex picture when combining on-chain metrics with technical price action.

According to Coinglass data, the order books show a stark asymmetry. There is a large bid concentration near 1650 dollars acting as local support, but significant sell orders are stacked at 1700, 1800, and 1900 dollars. This creates a major barrier for upward movement. Liquidation maps indicate that a move above 1841 dollars could trigger short liquidations, while a drop below 1668 dollars threatens long positions. The funding rate is negative, pointing to bearish sentiment, yet
ETH-1.23%
Everything in life is about timing
post-image
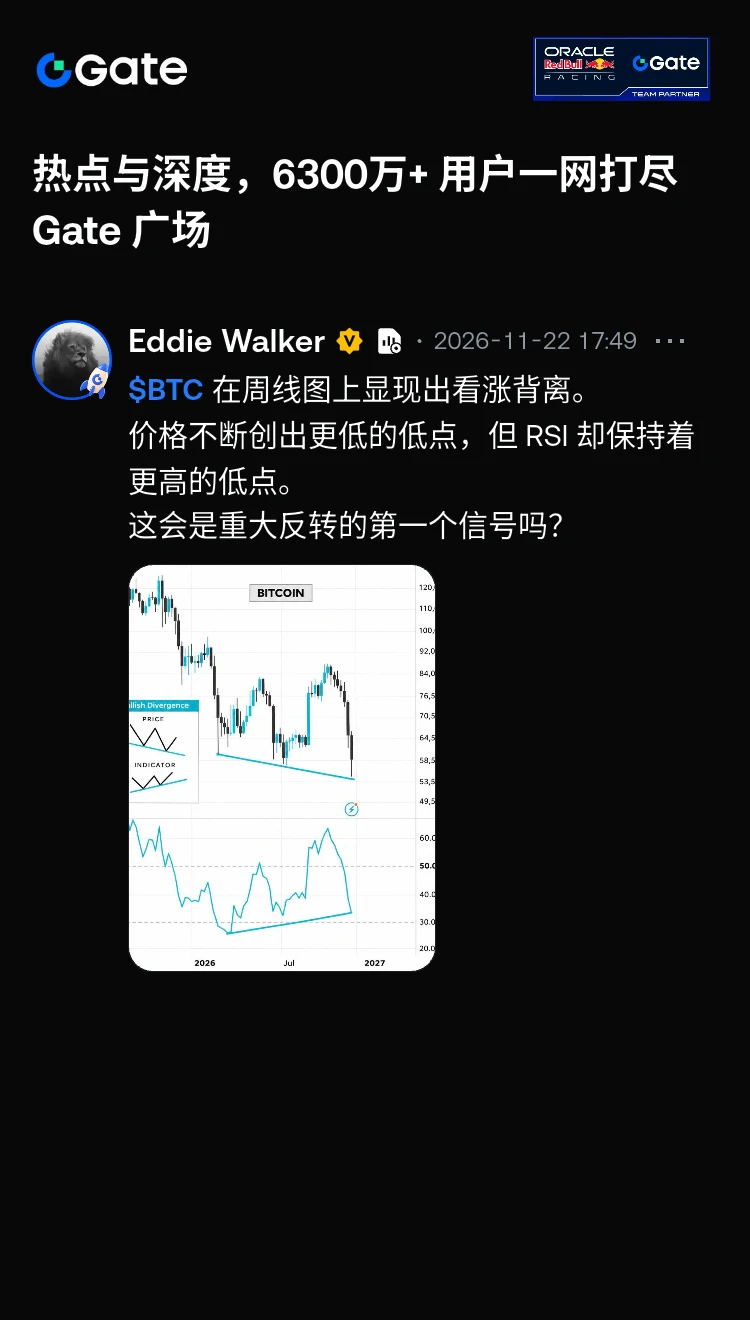
Has this round of sell-off hit bottom? What short-term trading opportunities are there?$BTC ‌$ETH ‌
BTC-0.65%
ETH-1.23%
  • 4
Most traders obsess over entry signals, yet Van Tharp showed that position sizing determines 90% of long-term results.
Two systems with identical expectancy can produce opposite outcomes solely because one risks 1% of capital per trade and the other risks 5%.
Expectancy tells you the edge; size tells you whether you survive long enough to collect it.
post-image
11122223333333666666555554444777788889999900000
post-image
$PIEVERSE I'm so pissed my liver hurts—I got stopped out right at the top. That damn market maker really is a fucking monster.
post-image
PIEVERSE+0.58%
$PIEVERSE I’m not selling you anymore, stop falling, I really won’t sell, don’t jump
post-image
PIEVERSE+0.58%
  • 3
#BTC
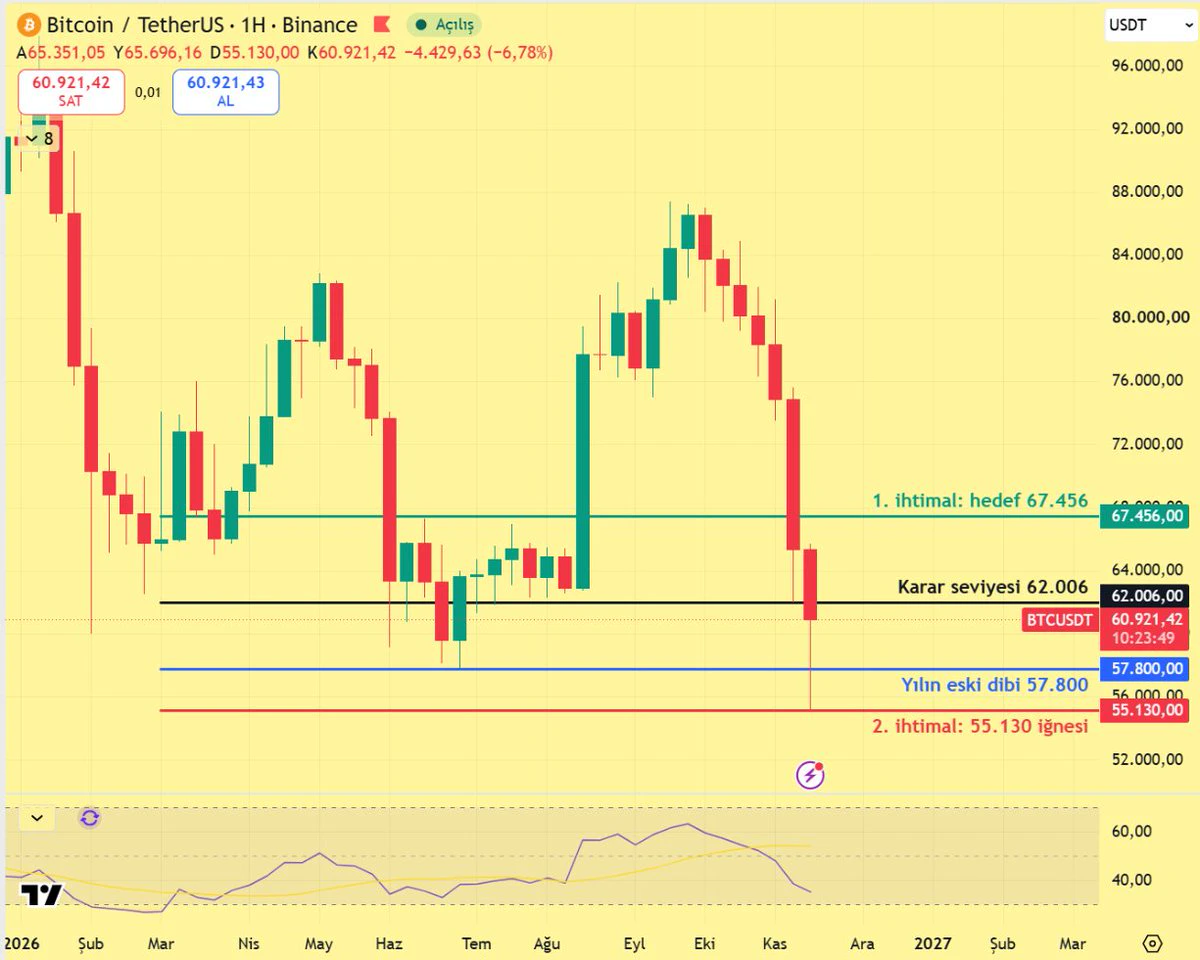
Two possibilities on the weekly chart
Friends, let's discuss both possibilities for Bitcoin $BTC .
The week opened at 65,351. The price fell to 55,130 on Saturday, recovered to 61,670 today, then turned back 336 dollars short of last week's low of 62,006. The broken level was tested from below but couldn't be cleared on the first attempt.
First possibility: 55,130 remains the low. If the weekly close comes in above the year's previous low of 57,800, the breakdown will remain a wick on the weekly chart. Then, if 62,006 is reclaimed, the 67,456 level marked on the chart will be the target.
post-image
BTC-0.67%
BTC Fall below 60k
live-cover
LIVE4,605
BTC-0.67%
Load More

Join 40 M users in our growing community

⚡️ Join 40 M users in the crypto craze discussion

💬 Engage with your favorite top creators

👍 See what interests you

Trending Topics

BTCReboundFaces60KTest

2.1M Views30.1K Discussing

BTC rebounded from around $55,300 on November 21, briefly reclaiming $60,000 before pulling back to around $59,300. The $60K level is back in focus as traders assess whether the recovery can last. Is this rebound a sign of stabilization or a short-lived recovery? Would reclaiming and holding $60K be enough, or do you need confirmation from trading volume and fund flows?

PCEAndGDPDataNextWeek

259.8K Views2.6K Discussing

GateDirectIPOPhase3ANTAllocates92100Shares

842.8K Views5.1K Discussing
View More