Share crypto content and earn up to 60% commissions through content mining.
placeholder
gatefun
The market was full of twists and turns this week, with opportunities everywhere—but there is no need to seize them all; focus only on signals you understand.
All gains come from patient interpretation and firm execution. There is no need to be perfect every time: take individual wins and losses lightly, and focus on the overall rhythm. Reject the fantasy of getting rich overnight, stay grounded and build steadily, put stability first, and quietly await new opportunities.$XAU
XAU0.13%
View Original
post-image
post-image
post-image
post-image
post-image
  • Reward
  • Comment
  • Repost
  • Share
📊 K‑Line Analysis on $HNT
Factor Observation.
Trend Price is 0.608, down from a high of 0.704 – strong bearish move.
Current Level Trading near the 24h low (0.477) but recovering slightly.
Support ~0.477 (today’s low) and ~0.363 (lower band from chart).
Resistance ~0.609 (immediate), then 0.704 (recent top).
Volume 24h Vol (HNT) is visible – watch for increasing volume on bounces to confirm reversal.
Indicators You have MACD, RSI, KDJ – likely bearish or oversold given the drop from 0.704 to 0.608.
Timeframe 15m/1h show short‑term volatility; 1D is more reliable for trend.
💡 The price is
HNT114.81%
  • Reward
  • Comment
  • Repost
  • Share
#BTC重返81000美元 Grayscale’s latest view—Digital assets are redefining asset-class allocation
As the crypto market gradually emerges from the cyclical winter, Grayscale, a leading global digital asset manager, has released a latest research report containing signals that warrant market attention. Bitcoin, once simply classified by the market as a high-risk speculative asset, is undergoing a subtle shift in its underlying characteristics.
The report shows that Bitcoin’s correlation with the Nasdaq index continues to decline, while its linkage with gold keeps rising. This change means t
BTC0.65%
View Original
post-image
post-image
  • Reward
  • Comment
  • Repost
  • Share
The core mechanics of event contracts are to predict whether the underlying asset will rise or fall within a fixed period. Each correctly predicted contract pays out 1 USDT, while an incorrect prediction results in a total loss. To maximize the win rate, you need to work on four aspects simultaneously: understanding the product mechanism, predicting the direction, selecting the odds, and maintaining position discipline:
I. Fully understand the settlement mechanism and avoid information gaps
Event contract settlement does not use the instantaneous spot market price. Instead, it compares the tim
View Original
post-image
ThisIsTranslateContent:
The core gameplay of event contracts is to predict whether the underlying asset will rise or fall within a fixed period. Each contract pays out 1 USDT if the prediction is correct, and expires worthless if it is incorrect. To maximize your win rate, you need to work on four aspects simultaneously: understanding the product mechanism, predicting direction, selecting odds, and maintaining position discipline:
I. Understand the Settlement Mechanism and Avoid Information Gaps
Event contract settlement does not depend on the instantaneous spot-market price, but instead compares the time-weighted average price (TWAP) provided by Chainlink with the benchmark price at the start of the period. This means:
Settlement is resistant to price wicks: as long as a sharp intraday drop or spike does not cause the TWAP to cross the benchmark line, the direction will not reverse.
Within short periods (5 minutes and 15 minutes), the TWAP is smoother, making it difficult for an extreme single wick to change the result; however, once a trend forms over longer periods (1 hour and 4 hours), the TWAP will also be continuously pulled in that direction.
Strategic implication: if you believe a wick is fake, a short period is actually safer; if a trend has already emerged, do not bet against it.
II. Understand Contract Prices = Market-Implied Probabilities
Contract prices of 0.01–0.99 USDT directly correspond to the probability the market assigns to that direction:
| Contract Price | Implied Probability | Payout Multiple if Correct |
|----------|---------|----------------|
| 0.20 | 20% | 5x |
| 0.40 | 40% | 2.5x |
| 0.50 | 50% | 2x |
| 0.70 | 70% | 1.43x |
| 0.90 | 90% | 1.11x |
Core principle: only bet when “the actual probability you estimate > the market-implied probability.”
For example, if the market prices a bullish contract at 0.40 (implied probability of 40%), and you estimate the actual probability of a rise at 55%, this is a positive-expectation trade; if the market price is 0.80 (implied probability of 80%) and you estimate the probability of a rise at only 75%, you should not buy.
III. Practical Methods for Predicting Direction
1. Follow the Major Trend and Fade Minor Trends
First, look at the trend direction on higher time frames (4-hour/daily), and prioritize contracts aligned with the trend.
Within short 5- or 15-minute periods, the TWAP in the trend direction is more likely to be pushed continuously.
2. Key Levels + Period Matching
If the price has just broken through a key resistance level, the trend-following direction has an advantage on the 1-hour/4-hour time frames.
If the price is moving sideways within a range, the 5-minute period may be more suitable for trading reversals at the range boundaries.
3. Avoid Purely Random Bets
Price movements within a 5-minute period have a strong random component. Without clear technical signals, do not open positions frequently.
It is better to trade less and act only when there is a signal.
IV. Expected Value Management: Odds × Win Rate
Assuming your predictive ability remains constant, maximizing your win rate ≠ maximizing your returns. What you really need to do is maximize expected value (EV):
> EV = (Win Rate × Odds) - (1 - Win Rate)
Example:
Buying at a price of 0.30 with a 45% probability of being correct: EV = 0.45 × (1/0.30 - 1) - 0.55 = 0.45 × 2.33 - 0.55 = +0.50 (positive expectation)
Buying at a price of 0.80 with an 80% probability of being correct: EV = 0.80 × 0.25 - 0.20 = 0 (exactly break-even)
Conclusion: a combination of high odds + a moderate win rate is often more valuable than a high win rate + low odds. Do not pursue only a high number of correct predictions; consider whether the return from each correct prediction covers the cost of an incorrect one.
V. Position Sizing and Risk Management Discipline
1. Do not invest more than 5%–10% of your total funds in a single trade: if an event contract prediction is wrong, the principal expires worthless, with no possibility of “holding on until it comes back”; position sizes must be small.
2. Pause after consecutive losses: set a daily loss limit (such as 15%–20% of total funds), and stop trading for the day once it is reached.
3. Take profit by closing early: if the contract price has risen sharply while you are holding it (for example, from 0.30 to 0.70), you can sell to lock in profits instead of waiting until expiration to seek the 1 USDT payout—securing profits reduces risk.
4. Cut losses decisively as well: if the intraday signal has already reversed and the contract price is falling, do not hold stubbornly until expiration; selling early can at least recover part of the principal.
VI. Practical Recommendations for Selecting Periods
| Period | Suitable Scenario | Notes |
|------|---------|---------|
| 5 minutes | Ultra-short-term trading and operations at range boundaries | Strong randomness; precise entry timing is required |
| 15 minutes | Short swings and trading after confirming candlestick patterns | Balances flexibility and predictability; suitable for beginners |
| 1 hour | Trend continuation and breakout confirmation | More suitable for traders capable of identifying trends |
| 4 hours | Higher-time-frame direction and event-driven moves | Longer period and greater uncertainty; position sizes should be smaller |
In one sentence: to maximize your win rate with event contracts, the essence is to bet only when there is positive expected value + maintain strict position control + use the characteristics of TWAP settlement to choose the period and direction. Do not act when there is no signal; strike decisively when there is one. Only in the long run can you improve both your win rate and returns.
Event contracts are high-risk products, and the principal expires worthless if the prediction is incorrect. Please participate reasonably based on your own risk tolerance.
repost-content-media
  • Reward
  • 3
  • 1
  • Share
Venüs_:
To The Moon 🌕
View More
Good Morning Frens!🌤☕️ Happy Sunday everyone!
post-image
  • Reward
  • Comment
  • Repost
  • Share
Bitcoin Market Flow and Ethereum Price Updates
gate liveLIVE
958
live-coin
  • Reward
  • Comment
  • Repost
  • Share
BTC & ETH Price Movement and Altcoin Market Watch
gate liveLIVE
704
live-coin
  • Reward
  • Comment
  • Repost
  • Share
“Three lines converging” looks like it is about to fail......
At its core, “three lines converging” is about tracing the timeline of the traditional four-year bull-bear cycle. If its rhythm fails, it could mean that the “four-year cycle theory” may also be broken.
At present, we can see that the red line has begun showing a trend completely opposite to that of the blue and green lines.
The last time a similar situation occurred was in March-April 2025; at the time, Trump restarted the tariff war, causing risk assets, including U.S. stocks, to retreat sharply.
And this time, it is Trump again!
View Original
post-image
  • Reward
  • Comment
  • Repost
  • Share
$Bull run—keep milking you over and over. Keep going.
牛来70.00%
View Original
post-image
  • Reward
  • Comment
  • Repost
  • Share
#StrategySharesBreak135ForFirstTimeIn12Weeks
MSTR Breakout Puts Bitcoin Treasury Stocks Back in Focus
Strategy Inc. (NASDAQ: MSTR), formerly known as MicroStrategy, has once again become a major focus for crypto and stock-market traders. The company’s shares recently pushed above the $135 level for the first time in roughly 12 weeks, reaching an intraday high near $139.78 before sellers stepped in. The stock later closed around $127.31, showing just how quickly volatility can increase after a major breakout.
📈 Why the $135 Breakout Matters
The move above $135 was technically important becau
MSTR-7.34%
BTC0.65%
post-image
post-image
  • Reward
  • 1
  • Repost
  • Share
HighAmbition:
To The Moon 🌕
In the investment market, everyone talks about aligning knowledge with action.
“Be greedy when others are fearful, and fearful when others are greedy” is deeply familiar to many, and some understand it better than anyone.
But when the market really moves, putting knowledge into action is another matter.
Whether gold plunges in a sell-off or surges toward a peak, that is when human nature—and the ability to act on what you know—are truly tested.
One thing bears repeating: when an asset has genuine value, falling prices should not cause panic; they should spark excitement.
The lower the pr
GLDX0.22%
PAXG0.10%
View Original
  • Reward
  • Comment
  • Repost
  • Share
#NVIDIAEarnings 📊 Watch Revenue Growth
Strong year-over-year growth can signal that AI demand remains powerful.
🤖 Track Data Center Performance
NVIDIA’s data center business is a major indicator of AI infrastructure demand.
🎯 Focus on Future Guidance
Forward revenue guidance can be more important than the current quarter’s numbers.
📈 Monitor $NVDA Price Reaction
Even strong earnings can lead to volatility if expectations are already very high.
🚀 Keep an Eye on AI Demand
Continued spending from cloud providers and AI companies could support NVIDIA’s long-term growth.
NVDA-4.58%
post-image
  • Reward
  • Comment
  • Repost
  • Share
#EventContracts1%Reward
The Event Contracts carnival is in its final stretch and the structure remains one of the most straightforward short-term opportunities on the platform. New users still receive 5.5 USDT simply for signing up, and the full event runs until September 2 with a 200,000 USDT total pool.
The core reward is the 1 percent cashback on trading volume. You trade short-term directional contracts on BTC, ETH and seven other assets, and that volume feeds directly into the prize calculation. Layered on top are the daily tier rewards: 500 USDT volume unlocks 2.5 USDT, 1,000 USDT volum
BTC0.65%
ETH0.91%
post-image
post-image
post-image
  • Reward
  • 6
  • Repost
  • Share
Venüs_:
Ape In 🚀
View More
🔥@Sunday Free Strategy Levels👇
🔥@Long Entry Levels (the second entry level + short entry level + take-profit level are in the pinned subscription post; both long- and short-term spot setups are in the pinned post)@E3@
===========
Long at 77300, long at 77000, Sun 75600
Long at 2415, long at 2395, stop loss 2345
#Strategy股价突破135美元
View Original
post-image
post-image
  • Reward
  • Comment
  • Repost
  • Share
It’s 2:47 PM now, and by the time you come across this post, $I’m fucking here will have already surged from its 24-hour low of 0.0113 to 0.0139, up 19.23%, with $46 million in trading volume—the volume is no joke. Think this is just riding the broader market? Wrong. The broader market is ranging, while it has carved out an independent move.
Here’s my projection of the most likely scenario next: If this hourly candle can hold above 0.014, the next stop is 0.0153, the previous high. A breakout would mean an acceleration phase, with retail FOMO helping lift the price. But if it breaks below 0.01
View Original
post-image
post-image
post-image
  • Reward
  • Comment
  • Repost
  • Share
#晒出我的持仓收益 The US Dollar Index fluctuated and edged higher this week. The US July PCE data released on Wednesday reinforced expectations that inflation remains sticky, while expectations for a rate hike in September edged up; concerns over the dollar’s creditworthiness triggered by US Treasury repo operations limited the dollar’s gains. On Friday, Wash emphasized at Jackson Hole that achieving the inflation target was the top priority. The market interpreted this as a hawkish signal, sending the dollar sharply higher in the short term. It closed at 99.69, up 0.85% this week.
Analysis suggests t
View Original
post-image
post-image
ETH_USDT
Long
Cross 200X
Return %
+98.76%
Entry Price(USDT)
2,442.06
Mark Price(USDT)
2,455.93
  • Reward
  • Comment
  • Repost
  • Share
I had just tried to send the app to the background, and it sprang right back up. Is it playing hide-and-seek with me?🤣
After lunch, when I checked the chart, $SOL was still grinding out a bottom. It was grinding but hadn't broken down. I said at the time: no need to rush; once it holds steady, that's an opportunity. As long as someone steps in to buy on a dip, that's enough.😏
Now the price jumped directly from 94.68 to 105.01, +915.97%. Time for a good meal. This was a comfortable chunk of profit—feels great. I waited all through lunch, and it was finally worth it.🎯
As for the trade, close
SOL1.52%
SNDK0.84%
BTC0.68%
View Original
post-image
  • Reward
  • Comment
  • Repost
  • Share
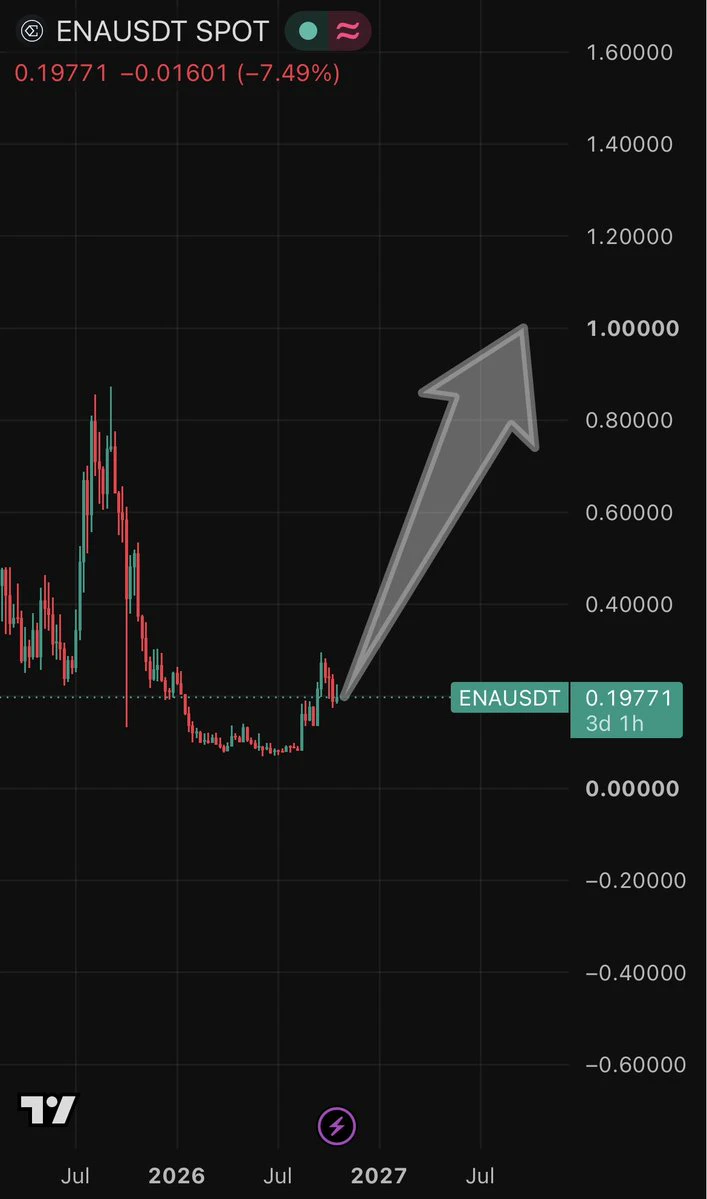
#ENASurgesOver15%InADay
ENA Surges 15%: What Actually Drove the Rally?
ENA’s sharp move is a reminder that crypto rallies are rarely driven by a single factor. The real question is not simply “Why did ENA pump?” but whether the move is supported by fundamentals, market structure, liquidity, and sustainable demand.»
Ethena (ENA) recently recorded a strong one-day move of more than 15%, attracting renewed attention from traders and investors. But rather than assuming that the rally was caused by institutional buying or a confirmed short squeeze, it is important to separate verified developments
ENA1.79%
BTC0.65%
ETH0.91%
USDE0.01%
USDC0.01%
post-image
post-image
post-image
  • Reward
  • 2
  • Repost
  • Share
2In1:
2026 GOGOGO 👊
View More
#WarshJacksonHolePreviewMarketsFocusOnRates
Warsh at Jackson Hole: Why Terminal Rate Pricing Matters More Than Rhetoric for Market Stability
Fed Chair Warsh’s first Jackson Hole speech is the final signal before September FOMC. Markets crave clarity but the real edge isn’t predicting his tone. It’s validating whether current market pricing of terminal rates aligns with macro reality. Here’s my pricing efficiency framework. 👇
🔍 Why Pricing Topology Determines Reaction Magnitude (Not Just Direction)
• Implied Fed Funds Rate vs. Dot Plot Divergence: Markets often price in more aggressive cuts
post-image
post-image
  • Reward
  • Comment
  • Repost
  • Share
With this trend, I don't even need to think—the account is dancing on its own. When $RENDER was just dumped in the early session, it rebounded to 2.0363. Looking at those candlesticks, I could smell the bull trap: every push upward fell just short, trading volume was pitifully low, and there was simply no one to take over. I said it directly in the alert: don't let this fake rebound lure you in; short when it's time to short. The current price has now reached 1.4581, pushing returns to +1367.66%. This is a huge payday—the buildup was truly sluggish, but the outcome is genuinely sweet.

As for
RENDER3.48%
BTC0.68%
DOGE0.26%
View Original
post-image
  • Reward
  • Comment
  • Repost
  • Share
Load More

Join 40 M users in our growing community

⚡️ Join 40 M users in the crypto craze discussion
💬 Engage with your favorite top creators
👍 See what interests you
  • Pinned