




#美股财报季 #每周来晒 Tech giants are ramping up AI investment, and there is still plenty of room for future growth. But the game has shifted from “whoever spends the most wins” to “whose computing capacity can be turned into revenue, profits, and free cash flow the fastest.”
How much room is there for future growth?
AI growth is mainly coming from three areas:
Cloud and compute leasing: Companies training models and running inference directly drive cloud demand. In Q2 2026, Google Cloud revenue grew 82% year over year, Azure grew 43%, AWS grew 37%, and Alibaba Cloud grew 45%.
AI software and services: These include Copilot, enterprise assistants, ad recommendations, search, and coding tools. The real upside lies in whether they can boost users’ willingness to pay, ARPU, and renewal rates.
Efficiency gains: AI cuts marketing, customer service, R&D, and content production costs, ultimately improving operating margins and growing free cash flow.
In terms of investment scale, the 2026 capital expenditure guidance for Microsoft, Google, Amazon, and Meta totals approximately $720 billion–$745 billion, with a midpoint of approximately $732.5 billion; the figure was approximately $410 billion in 2025[38]. This shows that the market has already priced in high growth expectations for the next few years.
Goldman Sachs estimates that six leading companies will invest approximately $1.73 trillion in AI infrastructure in 2026–2027. To achieve an annualized return on invested capital of 15%, the related businesses will need to generate cumulative revenue of approximately $1.42 trillion in 2028–2030. This means that AI still has substantial room to grow, but from here, revenue growth, margins, returns on capital, and free cash flow will face greater scrutiny.
Are current valuations reasonable?
Overall, the hardware segment is relatively solid, the application segment is highly differentiated, and pure-play large language model companies face greater valuation risks. Upstream companies such as Nvidia have clear chip orders, revenue, and profit to support their valuations. The forward P/E ratios of some hardware leaders have fallen to approximately 17x, a multi-year low, suggesting that the market is already pricing in slower growth and cyclical fluctuations.
Cloud giants are in a “transitional valuation” phase:
Cloud revenue is still accelerating, and AI demand is real;
Capital expenditure, depreciation, and electricity costs are also rising rapidly;
It is still difficult to attribute all market cap growth directly to AI.
Therefore, tech giants’ valuations can broadly be understood as follows:
Microsoft, Google, Amazon: Strong cloud and software monetization capabilities; valuations are high but supported by a solid core business.
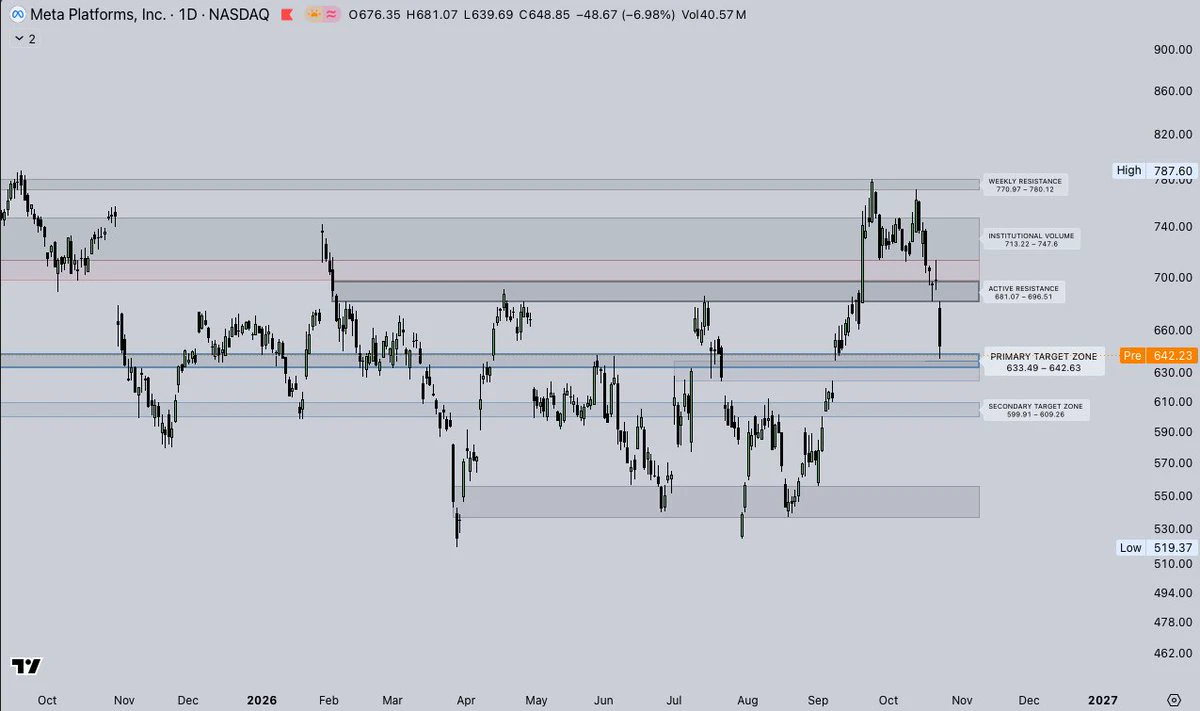
Meta: Strong social advertising foundation, but a longer path to AI returns; valuation depends more on efficiency gains and new products.
Domestic cloud and AI companies: Cloud businesses provide support, while the pace of losses from proprietary models and consumer-facing applications determines valuation upside.
Key indicators to watch
Going forward, focus on three sets of figures:
1. Whether AI revenue growth can continue to outpace capital expenditure growth
2. Whether cloud operating margins can stabilize or improve
3. Whether free cash flow and earnings per share can resume an upward trend
If these indicators improve for several consecutive quarters, profits may absorb current valuations; if capital expenditure continues to outpace revenue, valuations are likely to be revised downward.
In a nutshell: AI’s long-term growth potential remains substantial, but current valuations already reflect a great deal of optimism; at this stage, valuations are “structurally reasonable,” rather than broadly cheap across the industry.
How much room is there for future growth?
AI growth is mainly coming from three areas:
Cloud and compute leasing: Companies training models and running inference directly drive cloud demand. In Q2 2026, Google Cloud revenue grew 82% year over year, Azure grew 43%, AWS grew 37%, and Alibaba Cloud grew 45%.
AI software and services: These include Copilot, enterprise assistants, ad recommendations, search, and coding tools. The real upside lies in whether they can boost users’ willingness to pay, ARPU, and renewal rates.
Efficiency gains: AI cuts marketing, customer service, R&D, and content production costs, ultimately improving operating margins and growing free cash flow.
In terms of investment scale, the 2026 capital expenditure guidance for Microsoft, Google, Amazon, and Meta totals approximately $720 billion–$745 billion, with a midpoint of approximately $732.5 billion; the figure was approximately $410 billion in 2025[38]. This shows that the market has already priced in high growth expectations for the next few years.
Goldman Sachs estimates that six leading companies will invest approximately $1.73 trillion in AI infrastructure in 2026–2027. To achieve an annualized return on invested capital of 15%, the related businesses will need to generate cumulative revenue of approximately $1.42 trillion in 2028–2030. This means that AI still has substantial room to grow, but from here, revenue growth, margins, returns on capital, and free cash flow will face greater scrutiny.
Are current valuations reasonable?
Overall, the hardware segment is relatively solid, the application segment is highly differentiated, and pure-play large language model companies face greater valuation risks. Upstream companies such as Nvidia have clear chip orders, revenue, and profit to support their valuations. The forward P/E ratios of some hardware leaders have fallen to approximately 17x, a multi-year low, suggesting that the market is already pricing in slower growth and cyclical fluctuations.
Cloud giants are in a “transitional valuation” phase:
Cloud revenue is still accelerating, and AI demand is real;
Capital expenditure, depreciation, and electricity costs are also rising rapidly;
It is still difficult to attribute all market cap growth directly to AI.
Therefore, tech giants’ valuations can broadly be understood as follows:
Microsoft, Google, Amazon: Strong cloud and software monetization capabilities; valuations are high but supported by a solid core business.
Meta: Strong social advertising foundation, but a longer path to AI returns; valuation depends more on efficiency gains and new products.
Domestic cloud and AI companies: Cloud businesses provide support, while the pace of losses from proprietary models and consumer-facing applications determines valuation upside.
Key indicators to watch
Going forward, focus on three sets of figures:
1. Whether AI revenue growth can continue to outpace capital expenditure growth
2. Whether cloud operating margins can stabilize or improve
3. Whether free cash flow and earnings per share can resume an upward trend
If these indicators improve for several consecutive quarters, profits may absorb current valuations; if capital expenditure continues to outpace revenue, valuations are likely to be revised downward.
In a nutshell: AI’s long-term growth potential remains substantial, but current valuations already reflect a great deal of optimism; at this stage, valuations are “structurally reasonable,” rather than broadly cheap across the industry.