
Square
Following
Hot
News
Profile
Share your thoughts
placeholder
Article
$AGT All that's missing is my small contribution
post-image
AGT-5.00%
  • 2
#美国9月PPI大超预期
ETH My 2594 short position is deeply in profit at the current price of 2408.02; 2432 will determine direction.
Market: Price pulled back from 2594 on the 4H chart, bounced weakly after bottoming at 2318, and now sits at 2408.02 (down 0.45% in 24h). EMA7 (2416.70) and EMA20 (2432.63) are overhead resistance, while EMA60 (2486.93) is trending down. The bearish trend continues, with a weak rebound.
P&L calculation: 2594 - 2408.02 = 185.98 points, with unrealized profit continuing to grow substantially.
Key levels: Support at 2356.79/2318; resistance at 2432.63/2486.93
Outlook: Rejec
post-image
ETH-0.19%
Trenches
AGT
A
bade
b
AGT
0x5d...e274
Market Cap
$.
Change
.
24h Vol
$.
Holders
.
CNPY
C
bade
b
CNPY
0xc6...ddd2
Market Cap
$.
Change
.
24h Vol
$.
Holders
.
Q
Q
bade
b
Q
0xc0...0589
Market Cap
$.
Change
.
24h Vol
$.
Holders
.
Gato
G
bade
b
Gato
55A3...pump
Market Cap
$.
Change
.
24h Vol
$.
Holders
.
TSI
T
bade
b
TSI
AcV6...pump
Market Cap
$.
Change
.
24h Vol
$.
Holders
.
In a recent interview, Justin Sun explicitly said he was “more bearish on BTC,” citing AI and quantum computing. He thinks AI algorithms could pose a serious threat to elliptic curve cryptography within 1 to 1.5 years, turning the 2 million BTC whose private keys have been lost into potential selling pressure. Interestingly, though he says he’s bearish, he hasn’t reduced his core holdings at all; he has only moved them into a new, never-before-used cold wallet for isolation. This shows he’s warning about tail risks in an extreme scenario, not telling you to liquidate now.
As for “you should li
post-image
BTC+0.45%
ETH-0.14%
EIA data determines the short-term direction of crude oil
live-cover
LIVE1,323
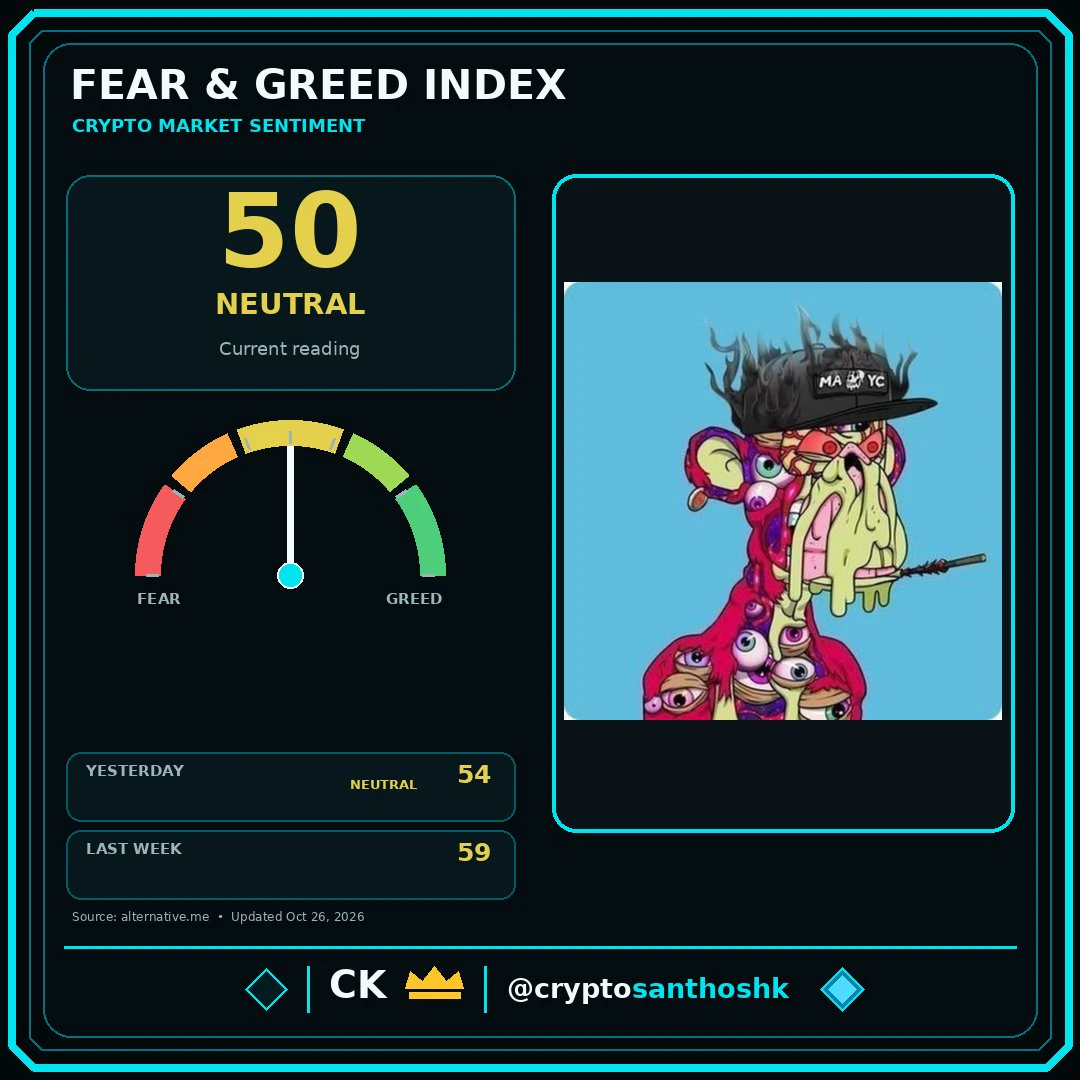
Sentiment Shift: Is Returning "Greed" Fueling the Next Leg Up, or Is the Market Overheating?
The Crypto Fear & Greed Index has shifted back into the Greed zone as risk appetite improves across the market. With $BTC , $ETH , and other major assets showing signs of strength, market sentiment is recovering quickly. This raises a crucial question: will this greed fuel the next leg higher, or is the market starting to overheat?
Rather than relying on emotions, let's break down the current technical picture for BTC and ETH based on recent price action.
📊 Bitcoin (BTC/USDT) Analysis
Looking at the dai
KatyPaty
Sentiment Shift: Is Returning "Greed" Fueling the Next Leg Up, or Is the Market Overheating?
The Crypto Fear & Greed Index has shifted back into the Greed zone as risk appetite improves across the market. With $BTC , $ETH , and other major assets showing signs of strength, market sentiment is recovering quickly. This raises a crucial question: will this greed fuel the next leg higher, or is the market starting to overheat?
Rather than relying on emotions, let's break down the current technical picture for BTC and ETH based on recent price action.
📊 Bitcoin (BTC/USDT) Analysis
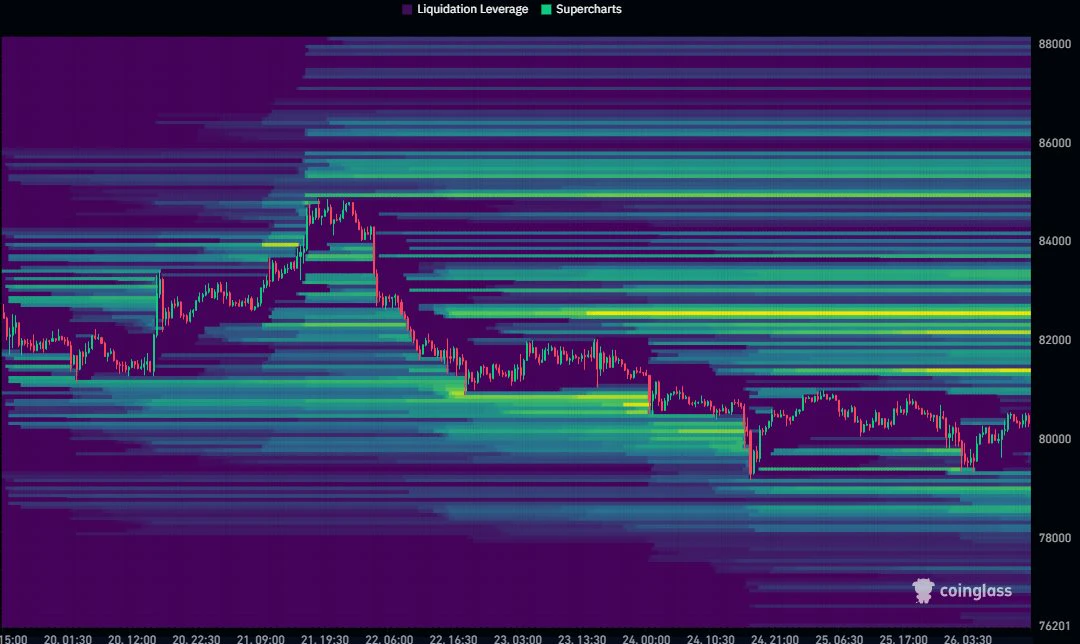
Looking at the daily and 4-hour charts, BTC experienced a significant run-up to a local peak of 87,380, followed by a natural retracement phase.
· Current State: BTC is currently consolidating around 81,700. On the 4-hour chart, the price is essentially resting right on the Middle Bollinger Band (MB: 81,701.5).
· Key Levels: Immediate support is found at the recent local low of 79,725 and the lower Bollinger Band around 80,790. On the upside, the daily Middle Band at 83,334 serves as the first major resistance, with a marked target (TP) highlighted around 84,800.
· Indicators: The daily MACD remains in negative territory, though the 1-hour MACD is attempting a bullish cross. Volume and OBV (On-Balance Volume) are relatively flat, indicating a lack of aggressive buying pressure at this exact moment.
BTC Takeaway: Bitcoin is in a healthy consolidation phase. Holding above the $80k psychological and technical support keeps the broader uptrend intact.
📈 Ethereum (ETH/USDT) Analysis
Ethereum's chart tells a similar story of correction and consolidation, but with an interesting technical setup emerging.
· Current State: ETH is trading near 2,411. After dropping from a local high of 2,806, the asset found support near 2,314.
· Key Levels: On the daily chart, the Middle Bollinger Band at 2,558 is the key resistance to watch. The daily Lower Band sits at 2,321, aligning with recent support.
· Indicators: The 1-hour chart shows a classic Bollinger Band squeeze. The bands are tightening significantly (Upper Band: 2,447, Lower Band: 2,385). This compression typically precedes a strong volatility expansion. The 1-hour MACD is flat near the zero line, waiting for a catalyst.
ETH Takeaway: ETH is coiling up. A decisive breakout above $2,450 could trigger a move toward the daily resistance, while a breakdown could see a retest of the $2,300 zone.
🤔 So, Fuel or Overheating?
Greed is a powerful driver, but the current charts suggest the market is in a digestion and consolidation phase, not an immediate parabolic blow-off.
The shift to "Greed" reflects recovering confidence, but the relatively flat OBV and negative daily MACD show that buyers are being cautious. The market is currently testing support levels.
· If buyers step in here and push through the middle Bollinger Bands (BTC > $83K, ETH > $2.45K) with rising volume, the current "greed" will act as fuel for the next leg up.
· However, if these current support levels fail to hold, the sentiment could quickly flip, proving that the market is indeed overheated and in need of a deeper reset.
The Bottom Line: Stay objective. The market is at a decision point. Monitor the volume and the middle Bollinger Bands for clear directional confirmation.
What are your key levels for BTC and ETH right now? Let me know in the comments. 👇
#CryptoMarketTurnsGreedy #BTC #ETH #ShareWeekly
repost-content-media
BTC+0.43%
ETH-0.19%
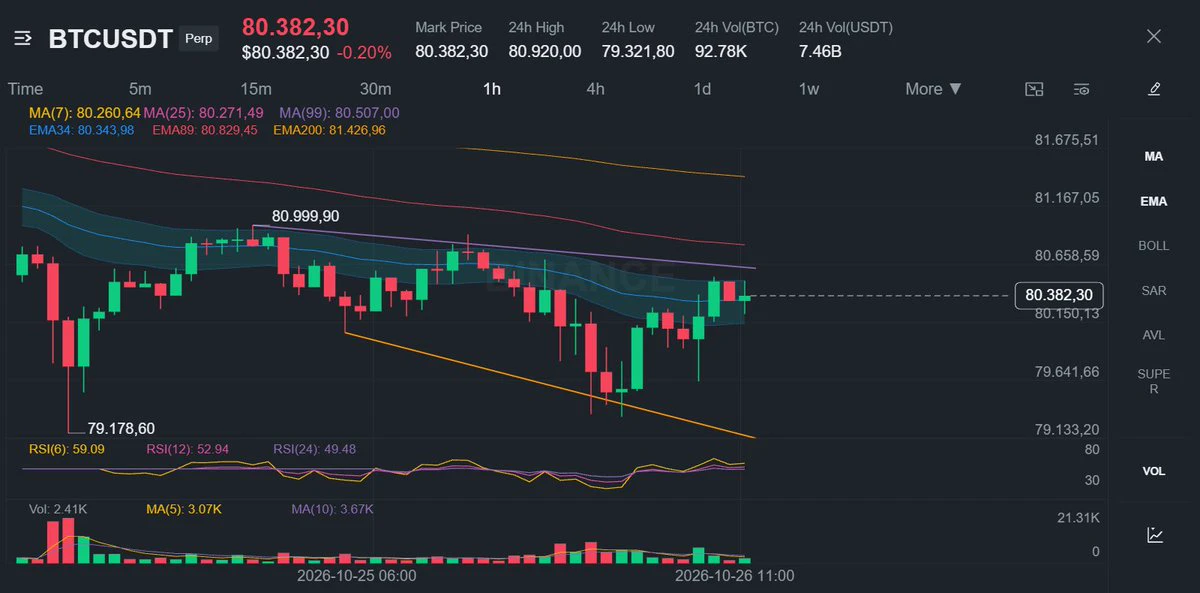
10.18 Weekend Morning Market Overview: BTC Range-Bound, Sell High and Buy Low
BTC formed a small bearish candle with a long lower wick this morning, marking two consecutive bearish daily candles
Yesterday, BTC hit a high of 81,700 and a low of 80,700, fluctuating by 1,000 points. It is continuing to consolidate near 81,700 during today's session
Looking at the chart, BTC's broad range is 82,700–80,700. The market maker has moved down from the 82,700–81,700 accumulation range to 81,700–80,700
81,700 is a pivotal horizontal level. Go long in the direction of the trend after a breakout and hold,
post-image
BTC+0.45%
  • 12
  • 2
Michael Saylor’s ParaFi talk shows how Bitcoin could move beyond treasury reserves into credit markets.
Using $BTC as digital capital opens new financial opportunities, but sharp price drops raise one serious question.
Who absorbs losses when collateral loses value?
post-image
BTC+0.43%
Bitcoin may be entering its next major cycle.
Fidelity’s Head of Global Macro says the 4-year cycle could be turning bullish again, with power-law patterns supporting the idea.
The interesting part? There’s no dominant narrative yet.
And maybe that’s the point — major bull markets often begin before the story becomes obvious.
$BTC ‌#USSeptemberPPIBeatsExpectations #GateWCTCS9GlobalTradingCompetition #GateBTCAndETHFuturesVolumeRanksTop3
post-image
BTC+0.43%
  • 3
Are you going to meet your online date in person?
You’re dressed so cute.
#KOSPIJumps3.3% 📈🇰🇷 | South Korea’s Stock Market Strikes Back!
After a brutal sell-off, South Korea’s KOSPI delivered a powerful rebound on October 16, climbing as much as 3.31% to 5,738.18 during the session. The bounce followed a 7.57% plunge the previous day that rattled investors and triggered a temporary trading halt.
🔍 What Fueled the Recovery?
🇺🇸 Wall Street offered relief: Gains in US equities helped restore some confidence across Asian markets.
💻 Chip stocks bounced: Samsung Electronics and SK Hynix recovered as investors r
post-image
  • 1
$AGT I almost gave back all my profits from the first half of the year in this move—at the worst point, I was down 38%, and my principal dropped from 120k to 74k. I wasn’t stuck in a position; I chased at 0.072 and got hit by a -22% wick, then panicked and sold around 0.054. After calming down and taking another look at the data, today’s 22% rally has helped me recover a big chunk.
Looking back at my reckless moves: I saw $AGT surge on rising volume from the 0.054 low and break past 0.07. I thought it might be the start of a breakout, so I chased at 0.072 with half my position. But the volume
🧧 First Post, First Reward! Earn up to 10 USDT on Gate Square!
New users 100% win! Climb the leaderboard and split 15,000 USDT!
Limited rewards—the more & better you post, the more you earn!
3 Key Rewards:
1️⃣ First-Post Bonus: 100% win rate, up to 10 USDT Red Packets.
2️⃣ Daily Top Picks: 3 creators daily get a 100 USDT coupon + official interact.
3️⃣ Monthly Board: Share 10,000 USDT & Gate merch (T-shirts, umbrellas, mugs).
✍️ Share market insights, trade recaps, or hot topics—any thought counts!
Post Now 👉 www.gate.com/post
Details: https://www.gate.com/announcements/article/102256
post-image
  • 11
  • 5
New users 100% win! Climb the leaderboard and split 15,000 USDT!
Limited rewards—the more & better you post, the more you earn!
3 Key Rewards:
1️⃣ First-Post Bonus: 100% win rate, up to 10 USDT Red Packets.
2️⃣ Daily Top Picks: 3 creators daily get a 100 USDT coupon + official interact.
3️⃣ Monthly Board: Share 10,000 USDT & Gate merch (T-shirts, umbrellas, mugs).
$BTC $GT $ETH $SOL
#ShareWeekly #
BTC+0.43%
GT-2.04%
ETH-0.19%
SOL-0.53%
Deutsche Bank Prepares Crypto Custody Launch (Eyes Asia)
5 assets are already on Deutsche Bank's launch list: $BTC , $ETH , USDC, EURC, and EURAU. The bank is preparing to launch crypto custody in Germany and reportedly plans to expand the service into Asian financial centers in 2027
This is built for institutional and corporate clients, not retail users. Deutsche Bank will manage wallets and private keys, while clients can hold assets and transfer them to third parties without building their own custody infrastructure.
The timing is interesting too: Deutsche Bank is targeting 8% annual growth i
post-image
BTC+0.43%
ETH-0.19%
USDC-0.01%
Hey babes, good morning and happy weekend
Feels like autumn is deepening
Leaves cover the ground🍂
A sudden realization:
Time is the best answer~
What are you all planning to do today?
post-image
I think 2026 is a transition window from the late depression phase of the fifth Kondratiev wave (information technology) to the recovery phase of the sixth (AI + energy)
The defining feature is not broad-based prosperity, but repeated bottoming and structural divergence. High interest rates (the 10-year yield at around 5.1%) remain the main constraint.
Asset outlook:
• U.S. tech stocks/Nasdaq: The long-term direction is right, but volatility is likely in the medium term; dollar-cost averaging is preferable to chasing highs
• Bitcoin: The early recovery is continuing, but it looks more like a h
post-image
BTC+0.43%
$XMR Breakout! Early buyers are reaping big gains
Remember when I recommended buying $XMR below $400? Look at the price now. XMR has nearly reached $600, and buyers who entered around $400 are up nearly 50%. This is exactly why I always say to buy near strong support instead of chasing prices after a major rally. Bullish momentum remains strong, and the price is currently testing the resistance zone around $600. A decisive break above $600 could pave the way for further gains toward $650 and $700. Early buyers are already sitting on substantial profits. This breakout is unfolding as expected.
post-image
XMR+0.00%
Two wallets dormant for over 12 years woke up and transferred out all 417 $BTC ($33.85M).
When these wallets first received their $BTC, the price was just $127 and $355, respectively. Their returns are now 638x and 229x.
BTC+0.43%
EIA data determines the short-term direction of crude oil
live-cover
LIVE26
Load More

Join 40 M users in our growing community

⚡️ Join 40 M users in the crypto craze discussion

💬 Engage with your favorite top creators

👍 See what interests you

Trending Topics

USSeptemberPPIBeatsExpectations

91.35k Views1.93k Discussing

US September PPI came in at 6.3% YoY, well above the 5.3% market expectation, pointing to renewed producer-side inflation pressure. Weekly jobless claims were 199K, broadly in line with forecasts. Could hotter inflation further reduce room for rate cuts, and what does it mean for $BTC, US stocks, and gold?

GateWCTCS9GlobalTradingCompetition

37.87k Views6.7k Discussing

GateBTCAndETHFuturesVolumeRanksTop3

53.8k Views1.83k Discussing

View More