Share your thoughts
placeholder
Article
$FLOCK Signal】Bullish continuation: 1H pushes into the upper band + 4H MACD expansion
$FLOCK 1H broke above the upper Bollinger Band to 0.0818, and the current price of 0.07788 is above the 4H upper Bollinger Band at 0.0769. The 4H MACD histogram expanded to 0.0026, with momentum continuing. RSI is 73.5 on 1H and 78.8 on 4H, remaining elevated without falling. Sell-side depth is approximately twice the buy-side depth, but the price has ignored the pressure. The funding rate is -0.0138%, with the negative value persisting. OI is stable, with no position retreat seen after the volume increase.
post-image
FLOCK+42.20%
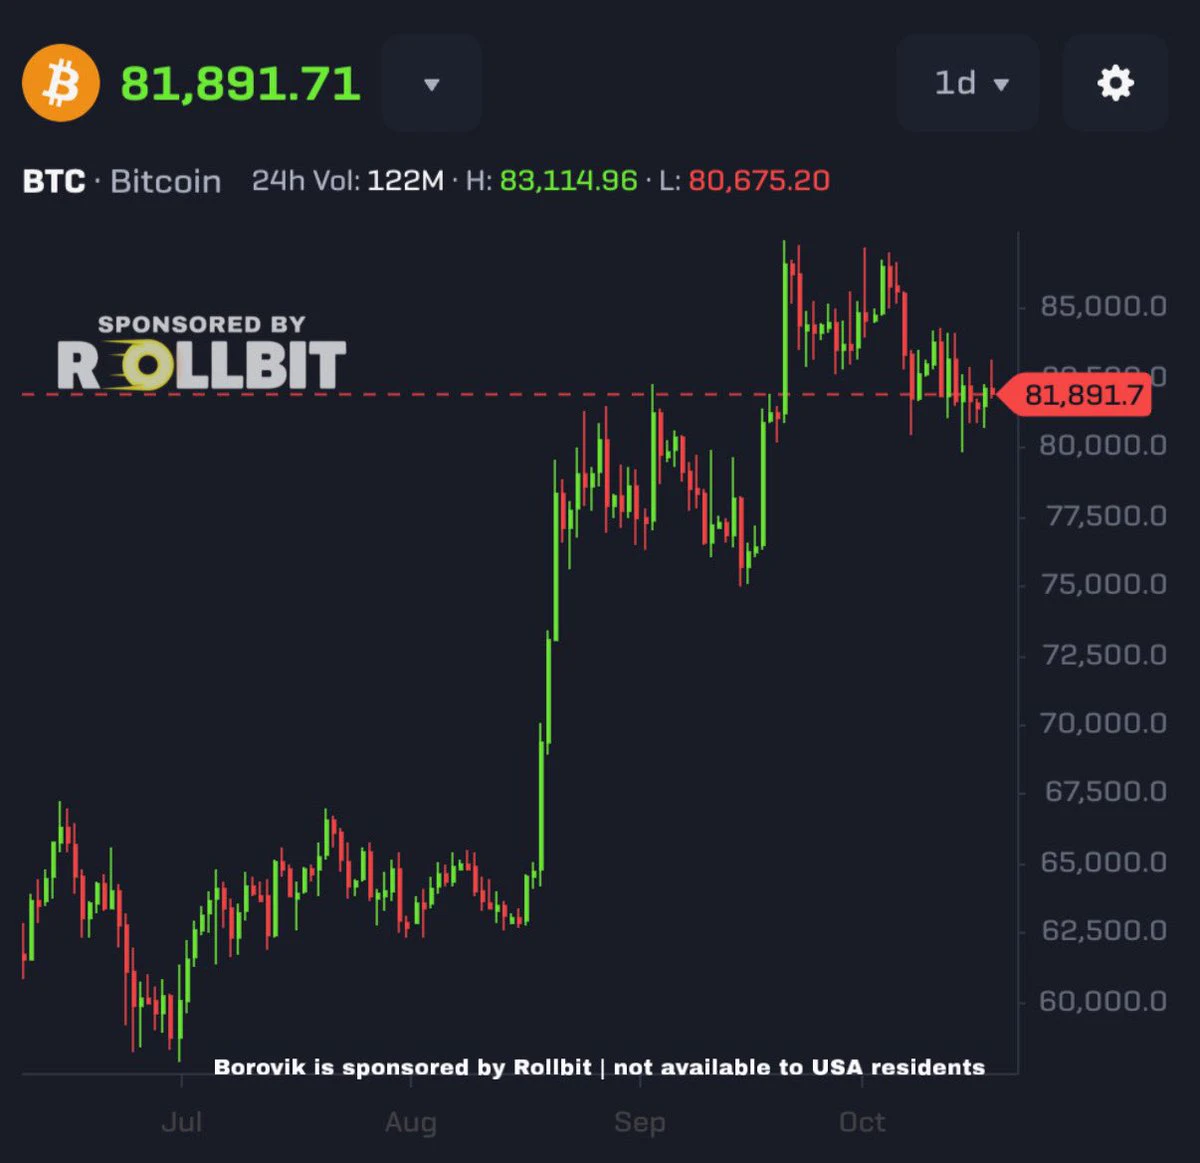
People in 2016 thought $600 for 1 BTC was too expensive.
Today, Bitcoin is around $80K.
post-image
BTC+0.44%
#Gate事件合约晒单挑战
ETH Breaks Below $2,500 Is This a Breakdown or a Reclaim Opportunity?
ETH has slipped below the important $2,500 psychological level, with Gate market data showing a price of 2,499.73 USDT. The move is small in absolute terms, but technically the level matters because $2,500 has been acting as a key reference point for short-term market sentiment.
THE KEY LEVEL
The immediate battle is now between $2,500 resistance and the $2,450–$2,460 support area. Recent market data shows ETH trading around the mid-$2,400s, with the September 4 session reaching a low near $2,435 before the mar
post-image
ETH+1.79%
Strategy Has Sold Bitcoin 5 Times in 2026
Strategy has made five Bitcoin sales so far in 2026, after previously selling 704 BTC in December 2022.
The 2026 sales include: • 32 BTC
• 1,363 BTC
• 2,225 BTC
• 1,638 BTC
• 1,690 BTC
Despite these sales, Strategy still holds a massive Bitcoin treasury.
The bigger question now: Are these sales simply liquidity management, or is Strategy changing its long-term Bitcoin strategy? 👀
#Gate60MillionUsers $BTC
post-image
BTC+0.44%
  • 4
Working really for this!
Let's absolutely send $ZIVIDEND
The race to $200m MC starts now
@blknoiz06 I only hold 0.99% of the tokens and I'm ready to send all to you
post-image
after noon updates
live-cover
LIVE666
Everyone’s watching gold, but silver just flashed a quiet trap at 66.32—are you holding the wrong metal?

XAG/USDT - SHORT

Trade Plan:
Entry: 66.30 – 66.34
SL: 66.52
TP1: 66.17
TP2: 66.07
TP3: 65.92

Why this setup?
Why now?
- 4h bias is SHORT with 55% confidence—not a slam dunk, but the range-bound 1D trend says don’t chase longs.
- RSI on 15m (57) is fading—momentum is stalling right at the entry zone, not building.
- ATR (0.084) is tight—this is a scalper’s window, not a swing setup.
- Primary path: 66.32 → 66.17 (TP1) → 66.07 (TP2) → 65.92 (TP3). Invalidation only above 66.70.
XAU0.00%
XAG+0.12%
Everyone’s long on $SKHYNIX /USDT while the 4h tape quietly flips—are you holding the wrong side?

$SKHYNIX /USDT - SHORT

Trade Plan:
Entry: 1285.21 – 1287.47
SL: 1300.40
TP1: 1275.80
TP2: 1268.77
TP3: 1258.23

Why this setup?
Why now? The 77.4 confidence short isn’t noise—it’s a range-bound 1D refusing to break higher. Entry sits at 1286.34, but the real tell is TP2 at 1268.77: a 1.36% drop before the 15m RSI (57) even cools off. With ATR at 4.5, momentum is tight, not explosive—this is a grind down, not a dump. The alt long scenario (TP1 1294.45) exists only if 1287.47 fails as resistanc
SKHYNIX+1.06%
Everyone’s cheering the 1D uptrend, but my 4h chart just whispered a dirty secret about HYPE.

$HYPE /USDT - SHORT

Trade Plan:
Entry: 87.624 – 87.974
SL: 89.980
TP1: 86.164
TP2: 85.073
TP3: 83.438

Why this setup?
- RSI on the 15m is already at 66.74—overheated in a downtrend.
- ATR (1h) at 0.6989 means volatility is ripe for a snap.
- The 1D bullish trend is the bait; the 4h SHORT (84 confidence) is the trap door.
- Entry zone 87.62–87.97, with TP1 at 86.16—that’s a 1.8% drop before the daily bulls even wake up.
- Why now? Because price is stalling right under 88.00, and the inval
HYPE+3.45%
Everyone’s long ZEC on the daily—but the 4h just flashed the exact opposite signal.

$ZEC /USDT - SHORT

Trade Plan:
Entry: 1165.09 – 1178.83
SL: 1257.64
TP1: 1107.70
TP2: 1064.86
TP3: 1000.60

Why this setup?
- 84% confidence SHORT at 1171.96 while the 1D trend says bullish: that’s the divergence trap.
- RSI (15m) at 68.6—overheated micro-momentum, ripe for a snap back.
- ATR 27.46 means the 4h range is wide enough to swallow late longs.
- Why now? Price is stalling at 1171.96, failing to clear 1178.83 resistance. If bulls can’t push through, the path to TP1 (1107.70) is open fast—th
ZEC+17.31%
Everyone’s staring at 1782 for SNDK, but the 4h clock is ticking against the bulls.

$SNDK /USDT - SHORT

Trade Plan:
Entry: 1779.93 – 1784.09
SL: 1801.99
TP1: 1767.03
TP2: 1757.04
TP3: 1742.05

Why this setup?
Why now? The 1D range is the trap—buyers think they’re safe, but the 4h SHORT bias (55% confidence) says otherwise. RSI on the 15m is at 60.68, showing local exhaustion right at the entry ref. ATR 8.32 on the 1h means volatility is compressed—ready to snap. If 1784.09 holds as resistance, the path to TP1 (1767) is a straight line, then TP2 (1757) becomes the magnet. This isn’t a fade
SNDK+1.71%
I just casually hit refresh, and it went up on its own, leaving me totally caught off guard. $NVDAX Ten minutes of watching the chart is no match for one minute of letting it do its thing.

Don’t think I just got lucky. A few days ago, I was watching the chart after lunch in the afternoon. The price action was still grinding back and forth, but the signs of money quietly entering were already impossible to hide. As buy orders kept piling up during the bottom consolidation, the wicks in both directions showed that someone was making one last probe. A real trend reversal is often just one fina
post-image
NVDAX+0.42%
SOL+4.10%
ETH+1.74%
MARKET ALERT - ASTER
4-Hour Chart (4H)
Technically, the price is in a strong uptrend. The candle is positioned above EMA20 (0,7546), EMA50 (0,7293), and EMA200 (0,6755). After touching a peak at 0,8675, a normal correction occurred.
Support: 0,7546 (EMA20) and 0,7321.
Resistance: 0,8133 and 0,8675.
1-Day Chart (1D)
The medium-term trend is shifting from consolidation toward a bullish breakout. The EMA arrangement is beginning to expand upward, with thick green candles indicating buyer dominance.
Support: 0,7022 (EMA20) and 0,6658 (EMA50).
Resistance: 0,8113 and 0,8675.
Trading Opportunities &
ASTER+2.43%
  • 4
  • 1
$ZEC is moving like it has something to prove.
After breaking the $800 zone, Zcash pushed hard toward $1,200 on the daily chart.
For me, $800–$820 is now the key area to watch. If $ZEC stays above it, the bullish structure remains strong and $1,200+ could stay in play.
After such a fast rally, a pullback would be normal. I wouldn’t chase here. I’d watch how price reacts around support first.
$800 holds = bulls stay in control.
What’s your next target for $ZEC ?
#ZEC #Zcash #Crypto #Altcoins
post-image
ZEC+17.43%
I had just switched the app to the background when it suddenly shot up—are you playing hide-and-seek with me? During the intraday plunge, $BTC was chopping around 77967.8. Once I saw it could no longer fall, I decisively went long. Hardly anyone dared to buy the dip at the time, but the market has a way of humbling anyone who refuses to accept reality.

Money earned is the monetization of your knowledge; money lost is the flaw in your knowledge.

When I switched back to check the chart, good grief—it had already reached 79933.4, with +437.59% secured. I’m not bragging; I just got the timing
post-image
BTC+0.41%
SOL+4.10%
SNDK+1.71%
$FLOCK Signal】Long + 4H momentum continuation
$FLOCK RSI 4H 76.62, 1H MACD histogram contracting, current price 0.07337 near the upper Bollinger Band. Order book depth imbalance -5.51%, with sell orders slightly dominant. The 4H MACD histogram at 0.0023 is still expanding, OI is stable, and the funding rate is 0.0050%. Multi-timeframe momentum remains intact. Risk/reward ratio 1.5, tradable, but stop loss must be quick.
🎯Direction: Long
⚡Entry/limit order: 0.0731499 - 0.0733700
🛑Stop loss: 0.0726363
🚀Target 1: 0.0744706
🚀Target 2: 0.0750208
🛡️Trade management:
- After reaching Target 1,
post-image
FLOCK+42.20%
BTC+0.44%
ETH+1.79%
SOL+4.11%
There is no need to fear occasional storms; the tides rise and fall in their own time
$BTC $ETH
Many people should have had this experience: entering a long position after correctly reading the market, hoping for a breakout to the upside, only to be caught off guard by a sudden plunge and become trapped.
The expected rally never arrives, while the candlesticks instead turn downward, making it easy for one's mindset to become unsettled.
Remember, after a sharp drop, the worst thing to do is act blindly:
Don't panic and cut losses at a short-term low; nor should you stubbornly hold on and passi
post-image
BTC+0.41%
ETH+1.74%
Bull vs Bear Trading Insight
live-cover
LIVE662
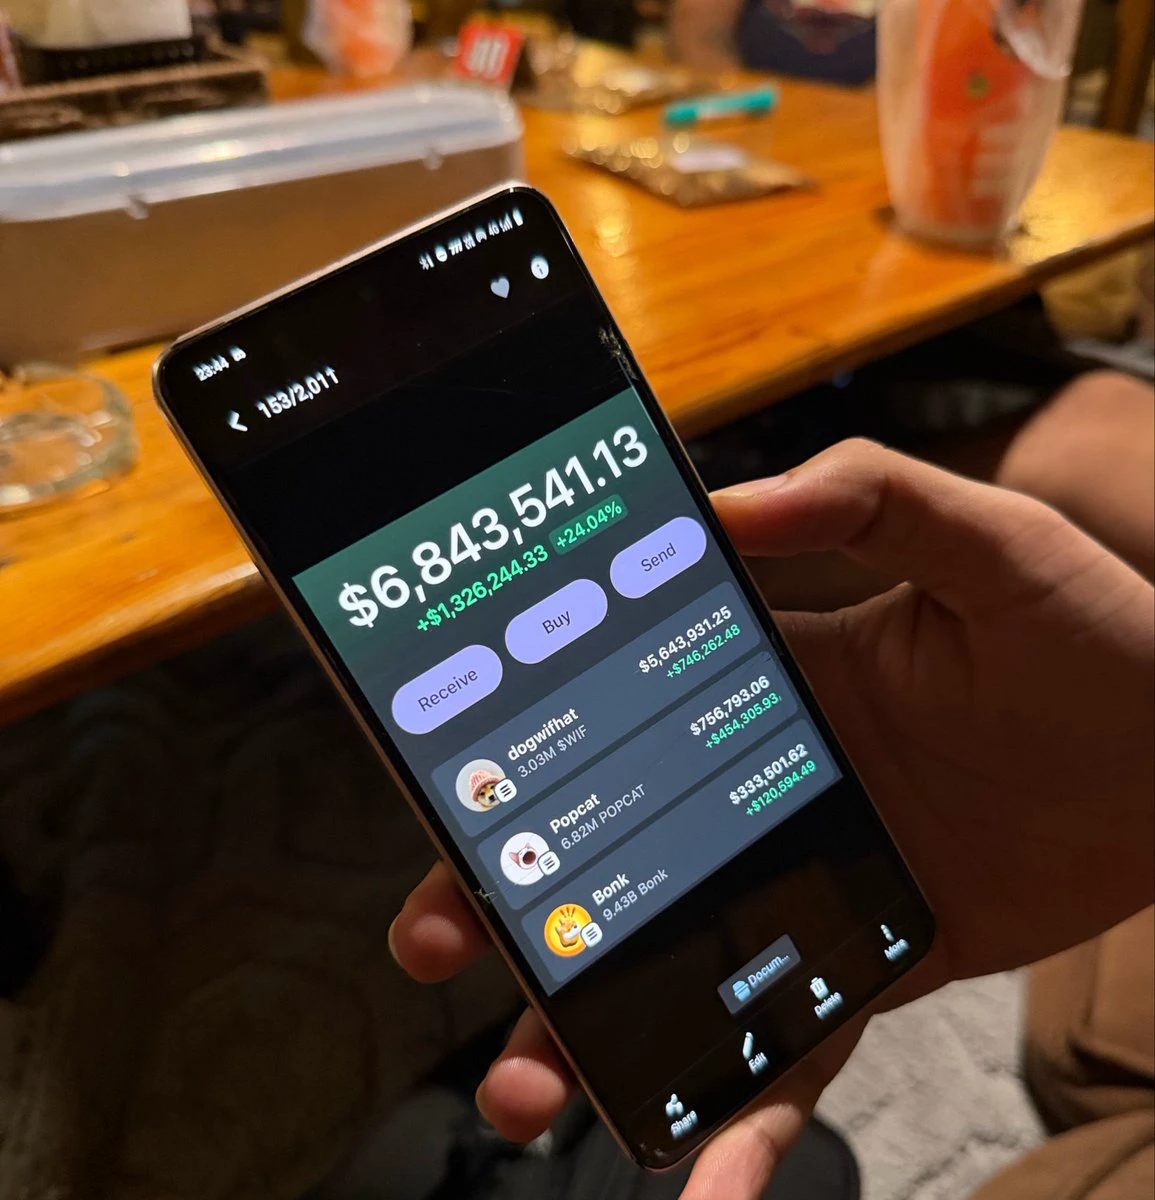
How much capital does it take to push a coin to a market cap of 1 billion? The current top holder tells us that it only takes less than 9 million. And if a player wanted to cash out 1 million right now, the market cap would instantly drop to 800 million. Many top holders could crash the entire market to zero with just one person’s holdings at the current coin price.
post-image
With this trend, I don’t even need to think—the account is partying on its own.
When I checked the chart just after lunch, the market hadn’t fully taken off yet, but buying pressure was quietly strengthening, and I realized the momentum was about to arrive. I set my entry at 1500.51, expecting a push upward, but I didn’t expect the current price to charge straight to 1783.45. I caught this long surge all the way, bringing my position’s return to +1338.9%.
I didn’t panic during the repeated intraday swings; I simply kept the position under control and waited for the rally. The market gave the a
post-image
DOGE+4.59%
ETH+1.74%
Load More

Join 40 M users in our growing community

⚡️ Join 40 M users in the crypto craze discussion

💬 Engage with your favorite top creators

👍 See what interests you

View More