Square
Following
Hot
News
Notifications
Profile
Share your thoughts
placeholder
Article
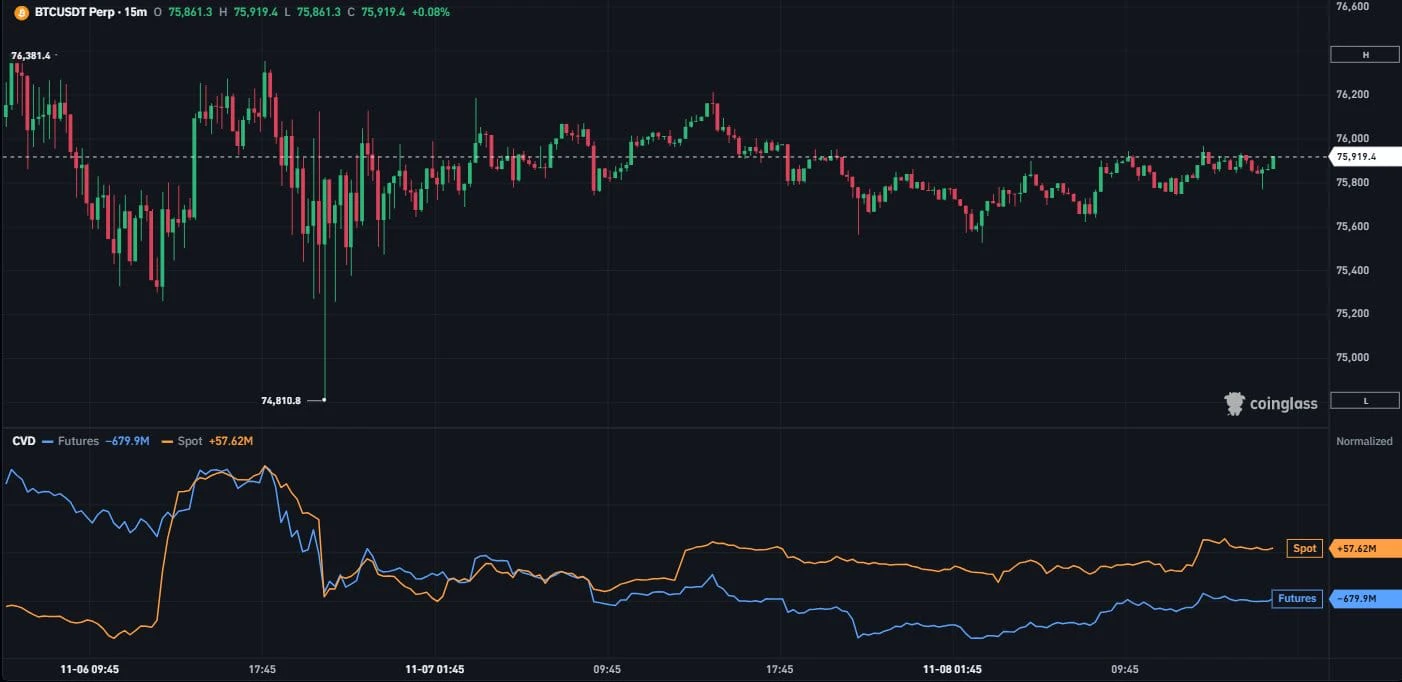
Spot has been bidding $BTC over the weekend.

But, perps are still shorting heavily here.

Until spot bidding accelerates, perps will continue to push Bitcoin down.
#ShareWeekly
post-image
BTC-0.67%
Prediction markets assign a 52 probability that Bitcoin will rise to $70,000 by the end of 2026
live-cover
LIVE1,092
Trenches
ZIG
Z
bade
b
ZIG
0x8c...1145
Market Cap
$.
Change
.
24h Vol
$.
Holders
.
STONK
S
bade
b
STONK
6GmA...UNgx
Market Cap
$.
Change
.
24h Vol
$.
Holders
.
CLAUDIA
C
bade
b
CLAUDIA
2j5S...W2ZM
Market Cap
$.
Change
.
24h Vol
$.
Holders
.
IDOL
I
bade
b
IDOL
0x3b...ab07
Market Cap
$.
Change
.
24h Vol
$.
Holders
.
FLOAT
F
bade
b
FLOAT
Bv1a...BMmr
Market Cap
$.
Change
.
24h Vol
$.
Holders
.
#Ahr999EntersBottomBuyingZone
Ahr999 Enters Bottom Buying Zone: Is Bitcoin Approaching a Major Accumulation Opportunity?
The cryptocurrency market is once again attracting attention as the Ahr999 Bitcoin indicator enters the bottom-buying zone. This development has sparked discussions among investors about whether Bitcoin is approaching an attractive long-term accumulation opportunity.
What Is the Ahr999 Indicator?
The Ahr999 indicator is a Bitcoin valuation tool designed to help investors understand whether BTC may be undervalued or overvalued compared with historical market trends. It combi
BTC-0.67%
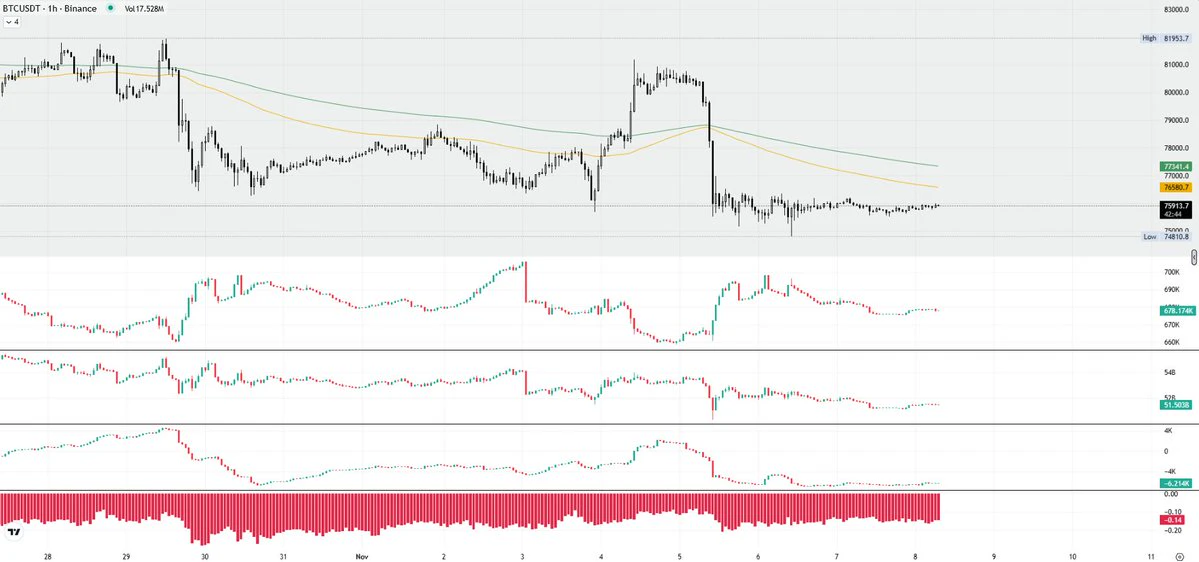
This is the calmest weekend ever for $BTC
Literally a stable coin this weekend with no liquidation wicks
MM and CEX are too worried restructuring to meet EU and US compliances
Democrats sweeping Congress signaling much harder regulations might be the reason
Wouldn't it be nice if regulations become so hard again against market manipulations?
You miss Gensler now after the brutal 2026 don't you?
Will make a market update today for subscribers. Until then stay safe. Don't get liquidated and extracted on shitcoins before the actual bull market begins
post-image
BTC-0.65%
  • 1
Proud moment: For the first time, I have an app in the App Store whose logo I designed myself
🥹
post-image
#Gate股票畅聊季 #WCTCS9 #美股财报季 Next week could be a battle to defend confidence in U.S. stocks.

Tech stocks plunged on Thursday and rebounded a bit on Friday, but the Nasdaq has now fallen for four consecutive weeks.

On top of Friday’s stronger-than-expected nonfarm payrolls, the market now faces two major pressures at once.

On one hand, strong employment data have pushed rate-hike expectations back up; on the other, policy uncertainty following the midterm elections is prompting investors to question the pace of AI data center construction.

At this point, there are a few fairly clear events on
NAS100+1.90%
CRWV+6.18%
AMAT+4.19%
CSCO-2.05%
  • 1
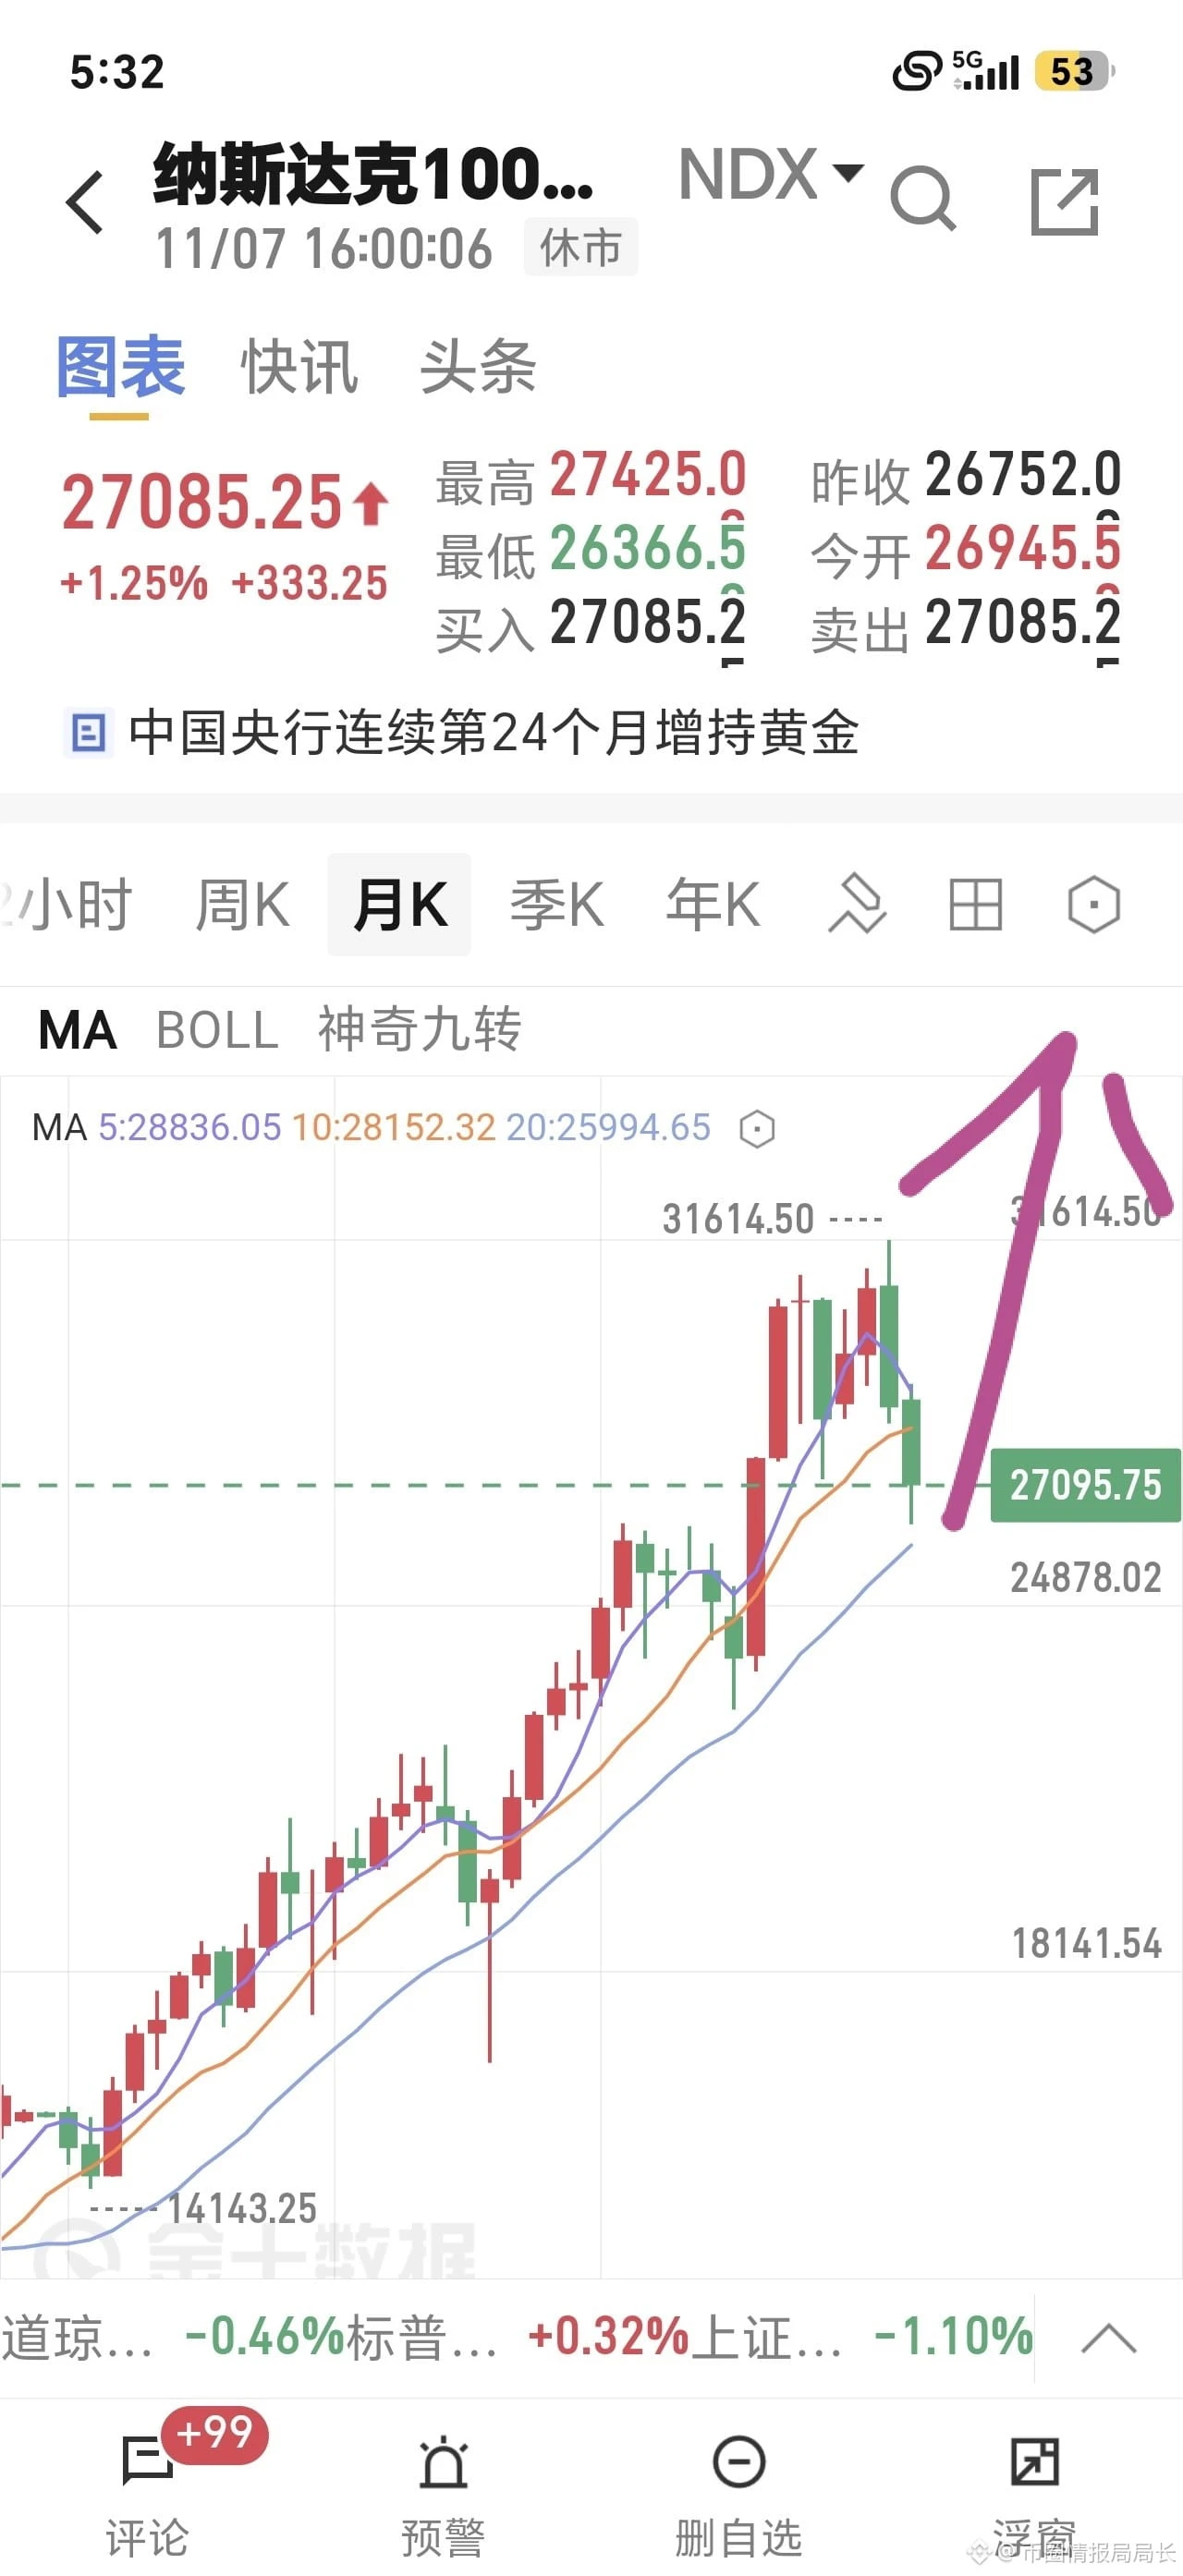
$QQQ The Nasdaq 100 Index has corrected to the Fibonacci 0.618 golden ratio level, for the following reasons:
The Nasdaq 100 Index rose from a low of 22966 to a high of 31614. The Fibonacci 0.236, 0.382, 0.5, and 0.618 retracement levels for this rally are: 29573, 28310, 27290, and 26269, respectively.

Last week, the Nasdaq plunged an epic 6.97%, approaching a circuit breaker, and fell to a low of 26570.

26570 is right near the Fibonacci 0.618 golden ratio level of 26269.

The Fibonacci 0.618 retracement level is the strongest support. A break below it would signal a bear market, while holdi
post-image
QQQ+0.01%
$ETH Altcoins’ performance to some extent reflects the broader market trend. Tomorrow will bring a big green candle—buy more now!!!
post-image
ETH-1.26%
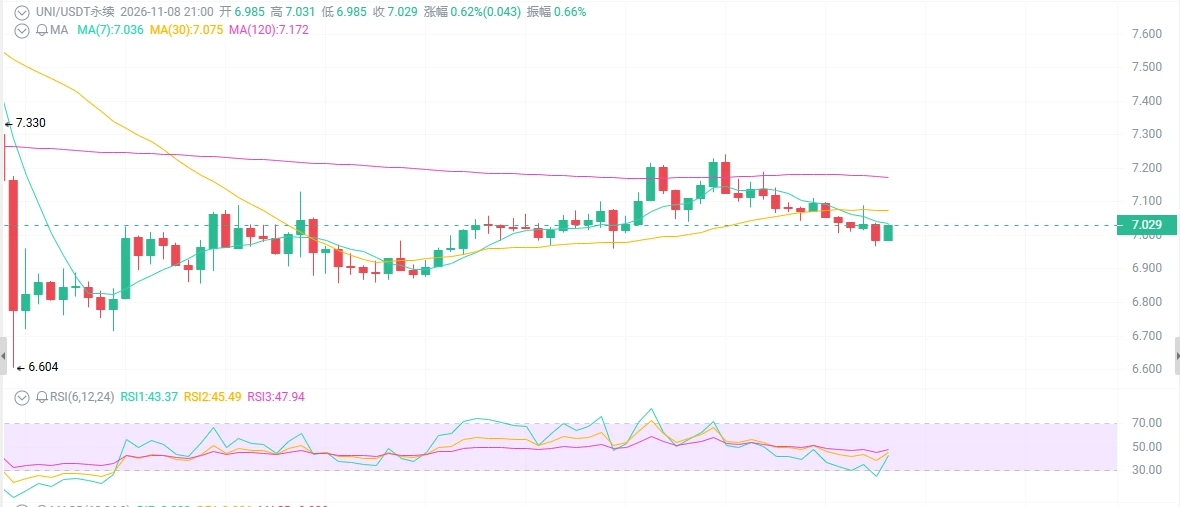
UNI at $7—have you cut your losses?

Daily active addresses hit a new 2026 high, new addresses topped 13k in a single day, and the protocol fee switch is active, kicking off real buybacks and burns of UNI—but the price has fallen from $10.9 to $7, down nearly 40%. On-chain activity is partying, while the price is playing dead. Is the market blind, or are we seeing another “sell the news” trap?

Look at the surface: everything is improving except the price.

Over the past month, UNI has fallen 4%; it’s down 2-3% on the week and has been hovering around $7 over the past 24 hours. But on-chain, d
post-image
BTC-0.67%
ETH-1.26%
UNI+3.05%
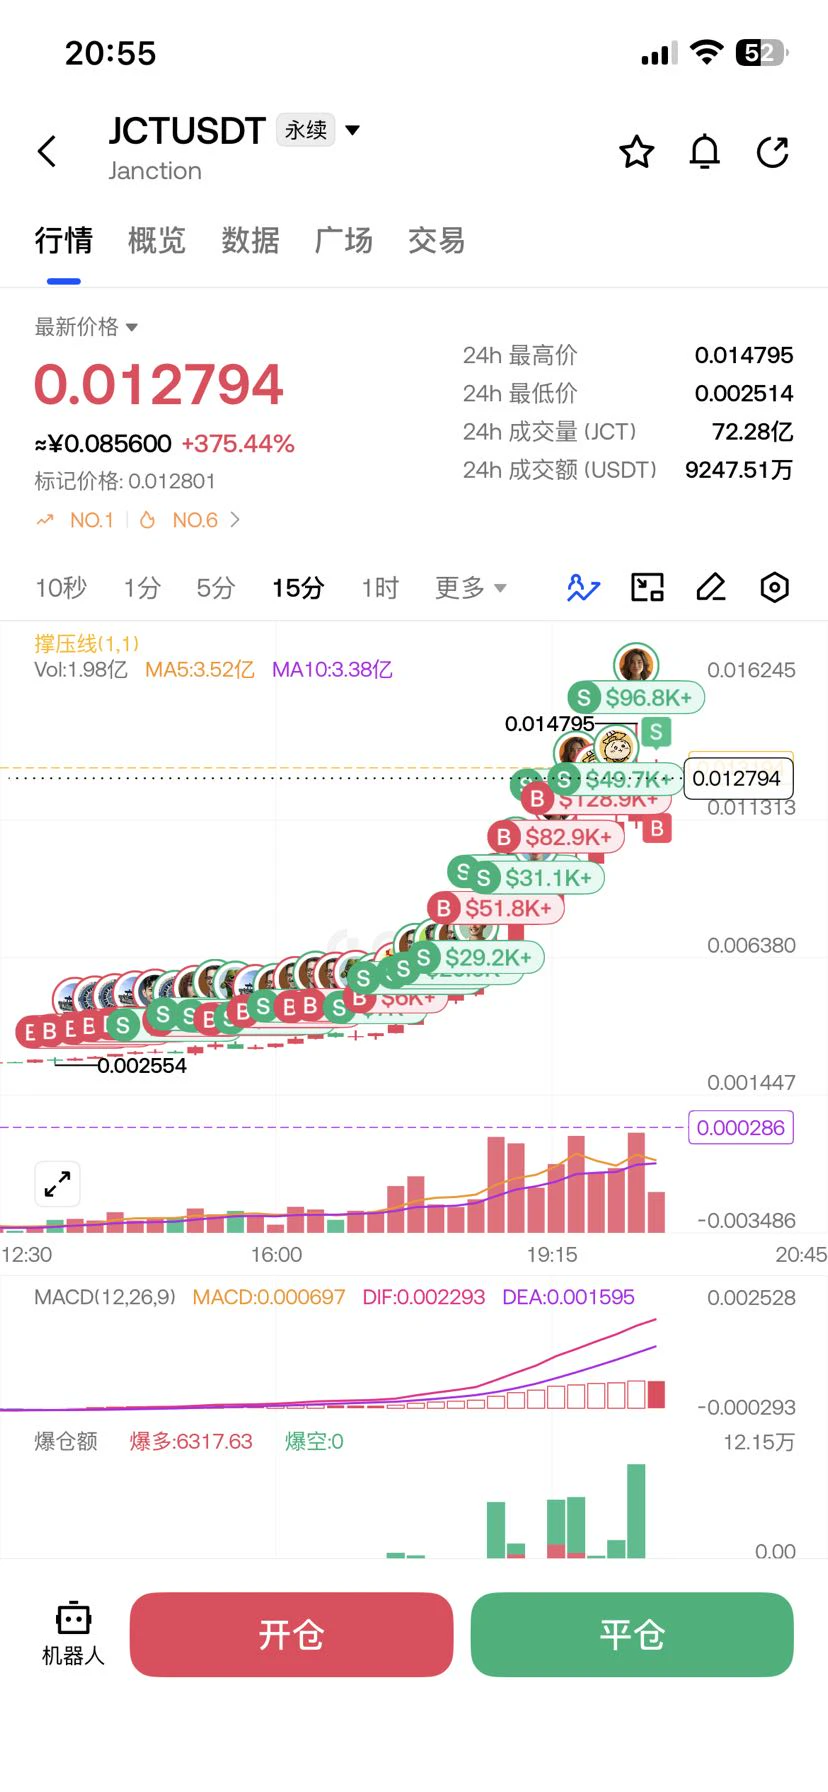
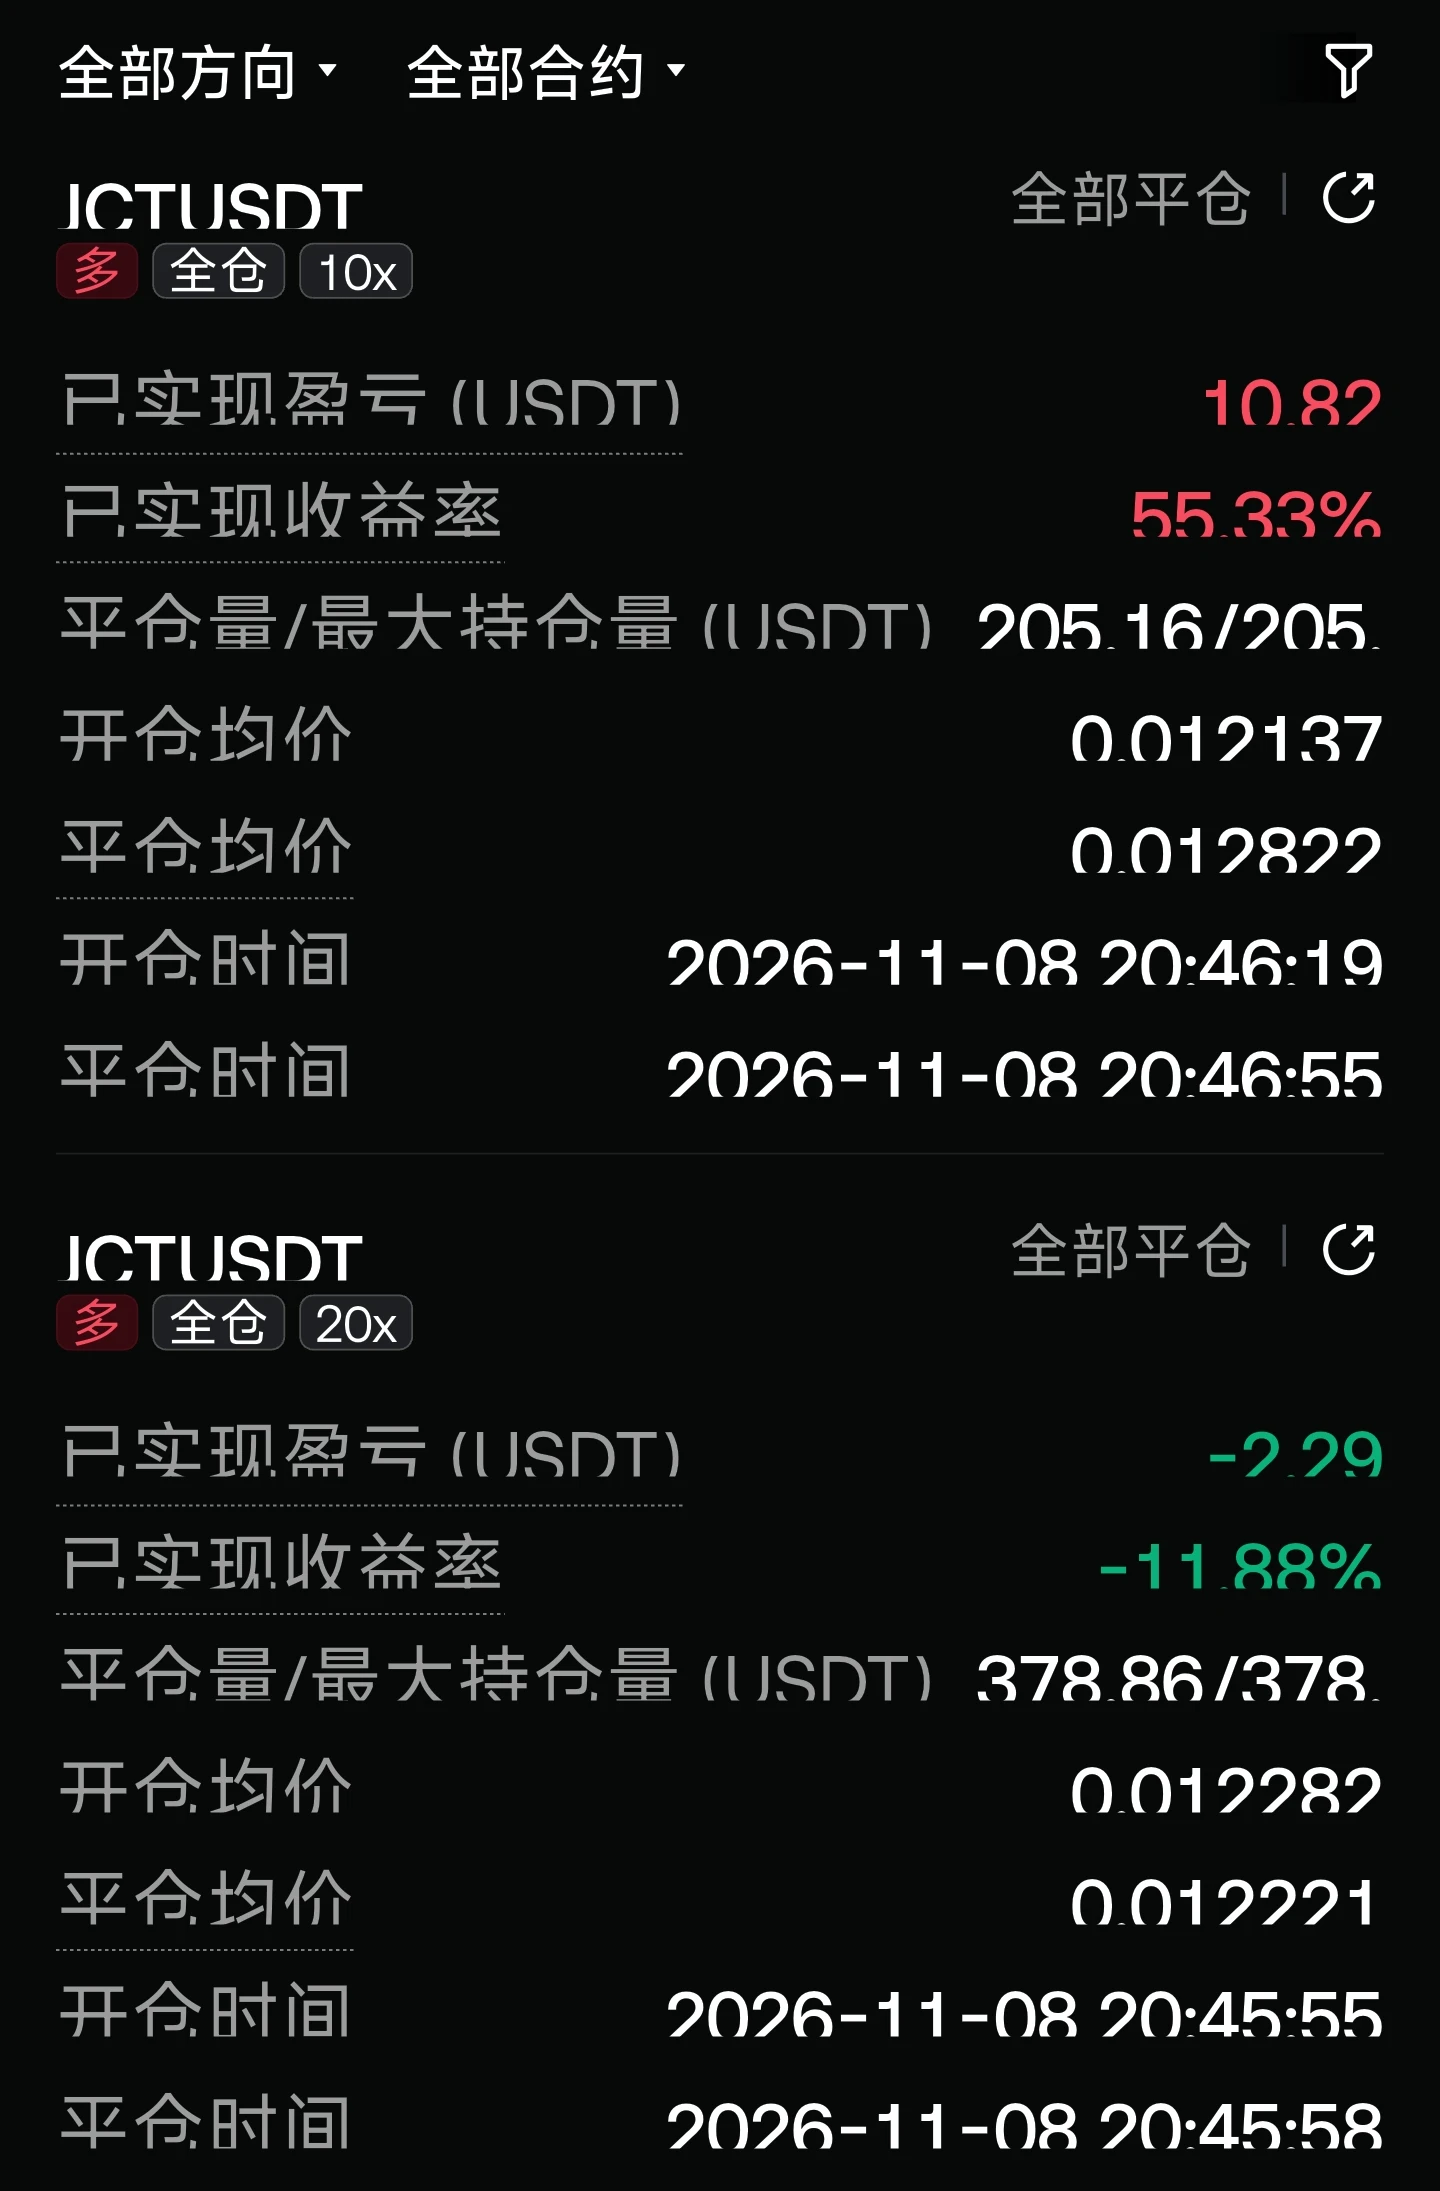
$JCT Can we go short now
post-image
JCT-3.26%
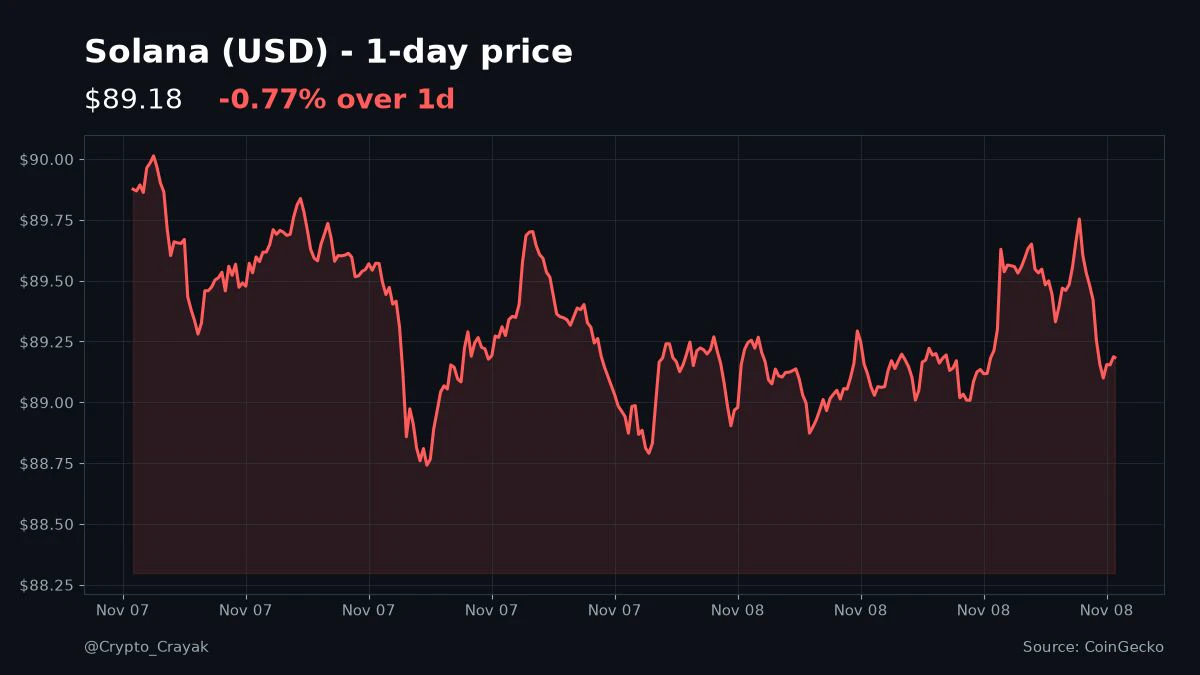
Sunday morning and $SOL has barely moved, just hanging around $89 after a sleepy night. Honestly I kind of like the quiet ones. Are you actually taking a day off from the charts, or is that just something we all say? #Solana
post-image
SOL-0.77%
$BTC and #美股 Plunges: Has the Cause Been Updated? The Kurumi Effect? Recently, there’s been a short-video meme: “Whenever Kurumi updates, U.S. stocks plunge.”
After the latest episode of this anime came out, U.S. stocks suffered a historic sell-off, wiping out nearly $3 trillion and making history right before our eyes.
For those who haven’t heard of it, here’s what the anime “FX Fighter Kurumi” is about: a college student wants to earn back the money her mother lost trading forex with leverage, so she follows in her mother’s footsteps and opens positions, then dances on the edge of
BTC-0.67%
Nov. 8 analysis: Bitcoin and Ethereum’s decline is nearing its end. Weekly candles have closed lower for six consecutive weeks. This decline is completely in line with my expectations and is also a pullback confirmation in the weekly bull market trend. Going forward, watch for a daily EMA golden cross, the price holding above the middle Bollinger Band, and a weekly candle closing higher. The bull market is about to start recovering. Current levels are all golden entry points, so cherish the opportunities. Ethereum’s resistance levels are 2500, 3000, 3800, and 4100; Bitcoin’s are 80k and 100k.
BTC-0.67%
ETH-1.26%
"The market is crashing why is this happening"
Number 1...
The market did not crash.
This is normal volatility.
Number 2...
All you had to do was look at this chart and your answer will be found.
PRICE MATTERS.
post-image
$JCT I don't dare trade anymore; at least I didn't lose money
post-image
JCT-3.26%
  • 1
#XRPKeyLevelBreak 🔍

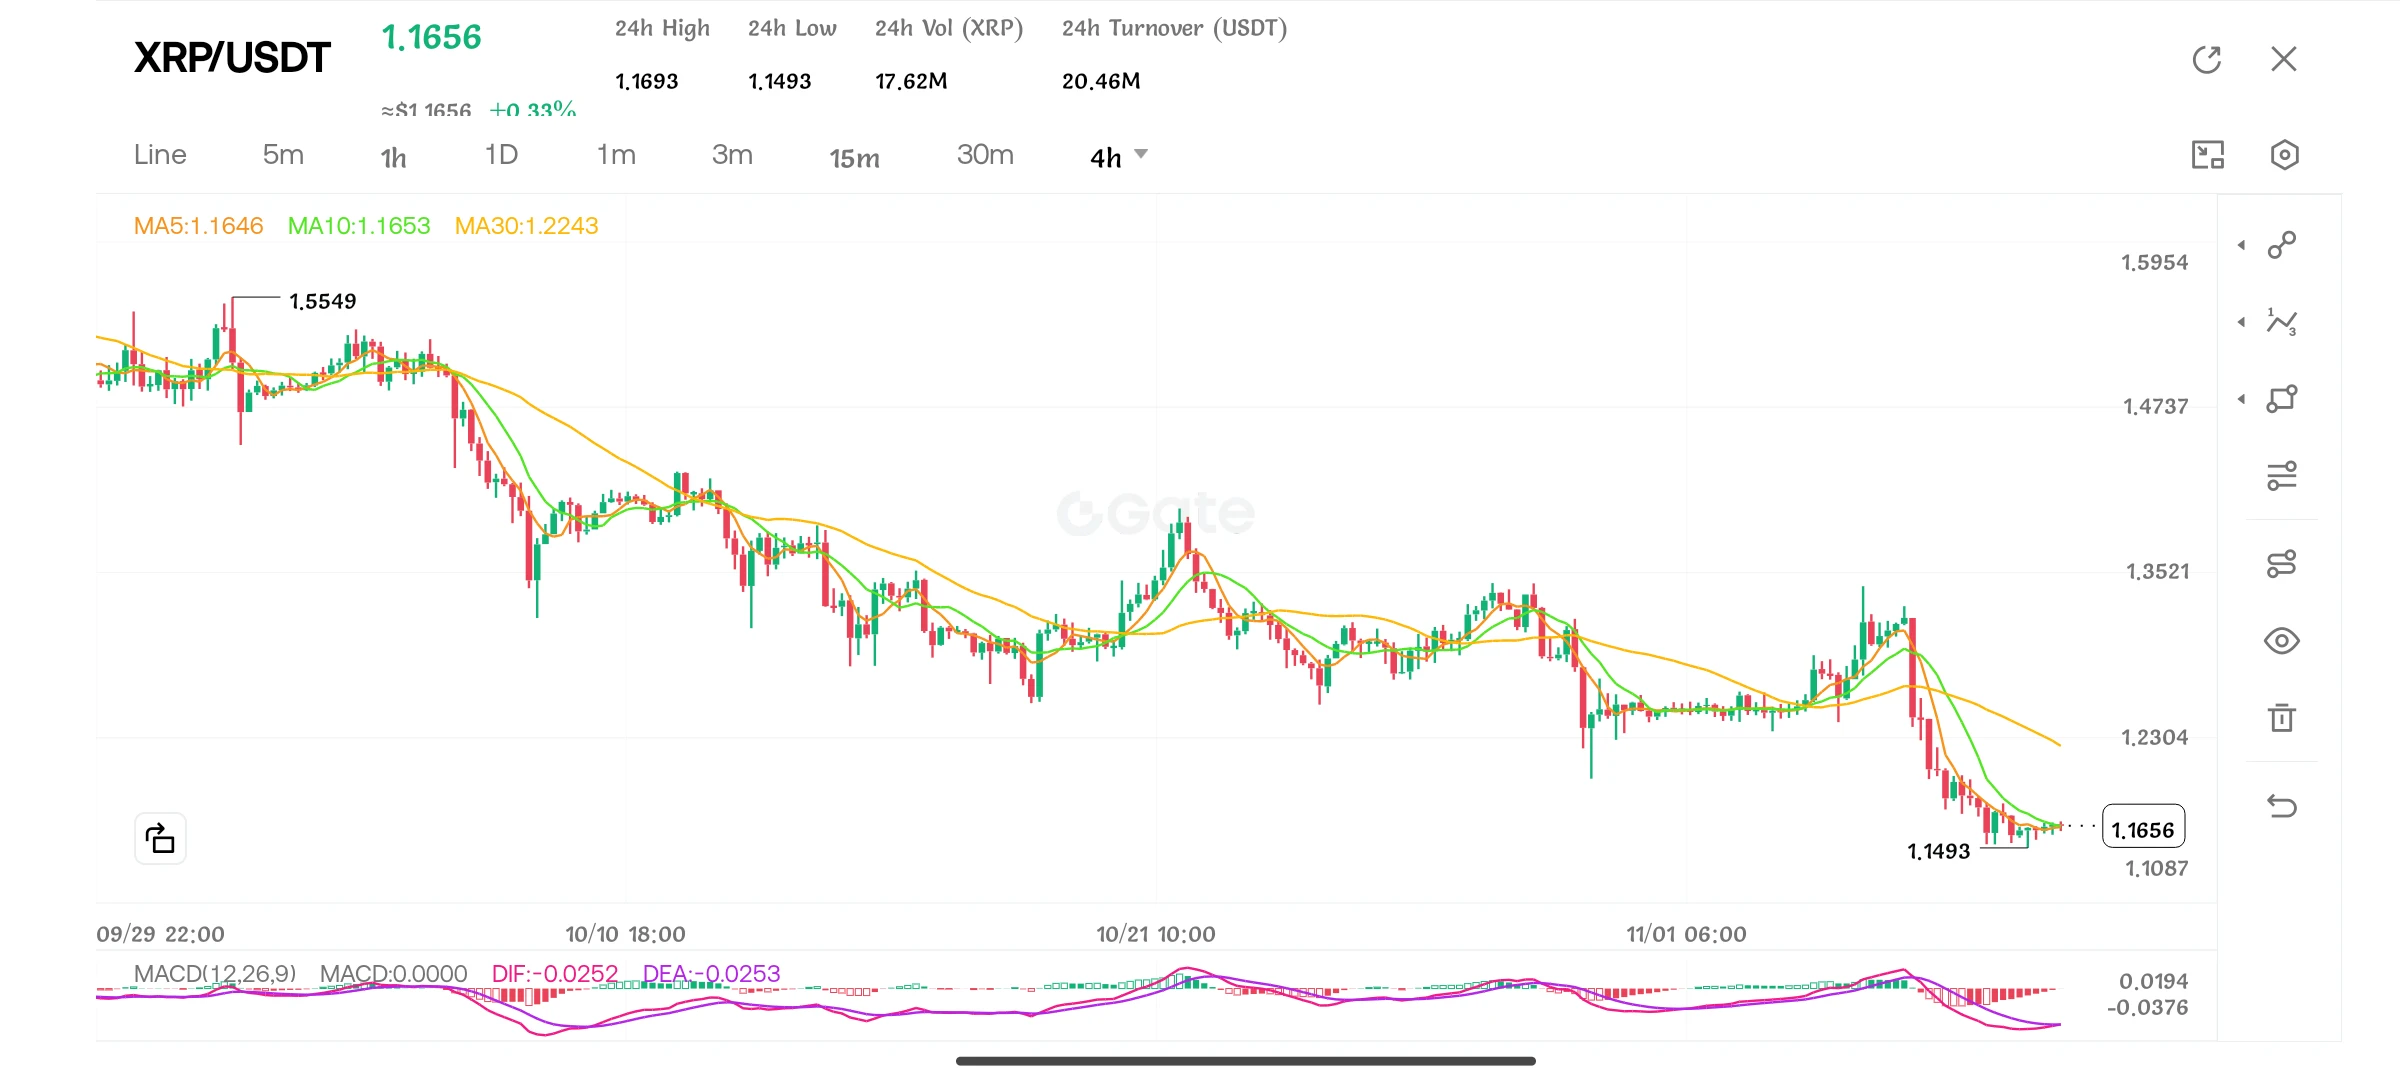
🚨 XRP Technical Analysis – Can Buyers Defend the $1.15 Support Zone?

XRP is currently trading around $1.1656 USDT, attempting to stabilize after an extended bearish move. Sellers have maintained control of the broader market structure, while buyers are showing some signs of short-term stabilization near recent lows.

The key question now is whether XRP can reclaim its immediate resistance or face another downside move.

📊 Current Market Snapshot

- Current Price: $1.1656
- 24H High: $1.1693
- 24H Low: $1.1493
- Major Support: $1.1490 – $1.1500
- Secondary Support: $1.1
post-image
XRP-1.12%
  • 2
I took profit on a small position in $GRASS after holding it for a little over two weeks. I received 72u, equivalent to a return of around 23%. Looking at the market, there really doesn’t seem to be much downward momentum, so I decided to lock in the profits and exit for now.
I also still have a short position in $STABLE open, currently up only a few points—not much. I don’t plan to touch this position for now. I’ll wait until the token unlock later this month, observe the price reaction, and then decide what to do.
The short position in $CAP is getting a bit uncomfortable. The most frustra
post-image
GRASS+1.45%
STABLE-1.39%
Load More

Join 40 M users in our growing community

⚡️ Join 40 M users in the crypto craze discussion

💬 Engage with your favorite top creators

👍 See what interests you

Trending Topics

USCPIDataIncoming

8.57k Views1.59k Discussing

The U.S. October CPI report will be released on November 10 at 8:30 a.m. ET. September CPI came in at 3.7% year over year, and markets will be watching closely for signs that inflation is cooling, especially in core CPI. A softer-than-expected reading could strengthen rate-cut expectations, while hotter inflation may pressure risk assets through higher Treasury yields and a stronger dollar. How do you think this CPI print will move $BTC, U.S. stocks and gold?

USAIStocksHitHard

27.28k Views3.73k Discussing

USNonfarmPayrolls

51.2k Views4.47k Discussing

View More