
Share your thoughts
placeholder
Article
#ZECSurges23%LeadingPayFiSector
Zcash (ZEC) has become one of the standout performers in the crypto market, surging 23.28% over 24 hours as the PayFi sector recorded a 5.03% gain. Dash (DASH) also advanced 17.21%, highlighting strong momentum across several payment-focused digital assets.
The move comes as the broader crypto market rebounded following the Federal Reserve’s latest interest-rate decision. Bitcoin climbed above $76,000, while Ethereum gained around 1.6%, showing that risk appetite strengthened across several major digital assets.
Zcash is particularly notable because its core tec
post-image
ZEC+10.37%
DASH+8.00%
BTC+0.42%
ETH+1.04%
#Gate广场中秋团圆局
#ZECSurges23%LeadingPayFiSector
#Zcash
ZEC is no longer trading around the $1,000 breakout area. The market has pushed it to $1,366, bringing the token close to the recent seven-day high of approximately $1,382.50. More importantly, this move has been accompanied by roughly $2.5 billion in 24-hour trading volume, making the current price action more meaningful than a low-liquidity spike. The immediate technical question is whether buyers can absorb profit-taking pressure while keeping ZEC above its previous breakout structure.
① $1,366 price — extension after the $1,000 breakou
ZEC+10.37%
Watching the charts until I got annoyed, I actually saw things more clearly after turning them off; once my eyes stopped staring at them, my heart stopped panicking too. A few days ago, I took a look before bed, $TUT ’s rebound lacked that final push every time it surged, with a strong bull-trap vibe. I pointed out the overhead resistance, and my short bias hasn’t changed.

Don’t lose your patience in the range, only to try to win back your dignity in a one-way move. Managing risk upfront is called rationality; cutting after taking a loss is called cutting off a limb to save the body.

0.034
post-image
TUT+3.91%
ADA+1.70%
DOGE+0.94%
$MSTRB Current price 129.47, upside resistance 130.63, downside support 127.68. The short-term structure is bullish but has approached the upper Bollinger Band.
Looking at the moving averages, MA5=129.23 has crossed above and held above MA20=127.683. The short- and medium-term moving averages are in a bullish alignment; as long as a pullback holds above MA20, the upward structure remains valid. The MACD histogram at +0.3438 remains positive, with bullish momentum continuing but not expanding significantly, indicating a gentle rise rather than an accelerated rally. RSI=55.3 is in the neutral-t
post-image
LTC+3.66%
Financially attracted, but physically repulsed.
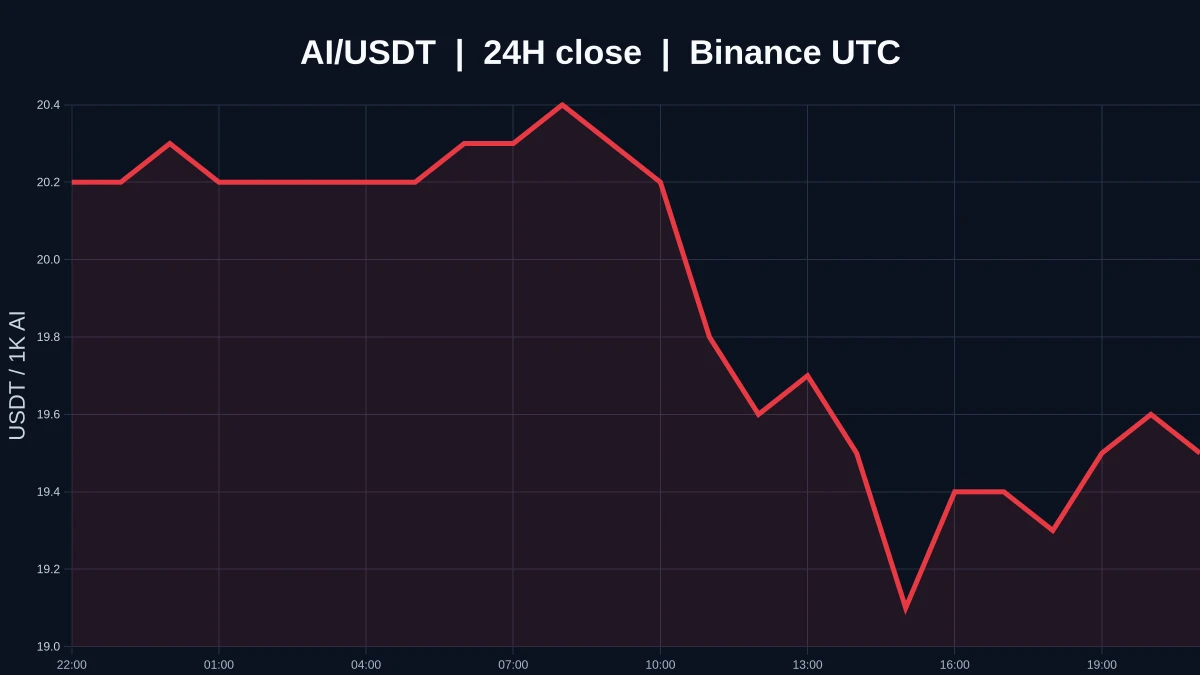
Do not touch $AKE . It dropped 25% in 24 hours, crashing straight from 0.0293 to 0.0168—just looking at this chart is enough to give you nightmares. Trading volume did jump to 260 million, though. With volume exploding like this, either panic selling is flushing everything out, or a manipulative market maker is trading against itself to lure people in. Either way, retail traders rushing in are just volunteering to get wrecked.
Let me break down the data first: the current price is 0.0212, with a 24-hour range of nearly 75%, and the upper and lower wicks are as needle-like as they come. This str
AKE-26.24%
The Lunar New Year is just around the corner. If you want to make big money, you need the courage to go all in! The vision to go all in.
I exited this short position in batches: 80% has likely been banked during the decline, while the remaining 20% is being held to see whether the structure will continue to break down. Current unrealized profit is +98.05%; the biggest risk for a short entered at a high is a rebound after a sharp drop.

The false breakout candle before $CAP is crucial: the price pierced the previous high but failed to close above it, while volume did not continue to expand, indicating that the upside was more of a bull trap than a valid breakout. The price then fell back inside the range, and the moving average
post-image
CAP-5.19%
DOGE+0.94%
ADA+1.70%
Starting now, I’ve officially joined #BlueBirdClub!!
Community friends, where are you? 🧐 Let me see you,
post-image
ETH at $2450—would you buy it?
Look at the surface first: bad news is bombarding the market, but the price is not falling.
The Fed raised rates by 25 bp on September 16, the first hike in three years; the CLARITY Act was blocked in the Senate; and ETH ETFs saw $220 million in net outflows in a single day. Doesn’t it sound like the sky is falling? But what happened? ETH rebounded from 2360–2370 with a long lower wick, moved above the 20-day EMA (2433), and saw the bad news priced in and oversold conditions recover—but selling pressure remains overhead. The daily MACD is still in a death cross,
post-image
BTC+0.42%
ETH+1.04%
SOL+2.36%
Insiders are quietly loading LSK before a move that could redefine the 1h chart.

$LSK /USDT - LONG

Trade Plan:
Entry: 0.4576 – 0.4902
SL: 0.3172
TP1: 0.5914
TP2: 0.6698
TP3: 0.7873

Why this setup?
Why now? The daily trend is bullish with 95% confidence, setting a strong macro backdrop for LSK. The 1h price at 0.4739 aligns perfectly with the entry zone, giving us a precise reference point. The 15m RSI sits at 40.64, suggesting the asset is far from overbought and has room to run before exhaustion. With the 1h ATR at 0.065296, the volatility is calibrated enough to push the first target a
LSK-20.89%
#Arc生态热门代币波动加剧 + #Gate广场中秋团圆局
With the launch of the Arc mainnet, it is crucial and analytically sound to distinguish between the price performance of the individual tokens within the ecosystem (ARGUS, LONG, COOL) and the network's own performance.
This phenomenon, frequently observed in crypto asset markets, clearly demonstrates a disconnect between fundamental network-level growth (L1/L2) and the speculative dynamics of assets issued on that network.
The sharp 12-hour declines seen in ARGUS, LONG, and COOL indicate that the ecosystem is currently subject to extremely high speculative volat
ARC-5.22%
ARGUS+26.40%
COOL-70.33%
  • 2
What is really worth watching in this FOMC meeting is not the 25 BP rate hike itself, but the line in the dot plot: there could be one more hike this year.
The market had actually expected this rate hike for some time; the truly hawkish signal is that there could be a second hike this year. Two-year and 10-year U.S. Treasury yields are both pushing higher. With risk-free returns so high, funds are naturally becoming more cautious.
So for us, the key question going forward is not “Did they hike this time?” but whether they will continue hiking in December.
For now, it appears that the probabili
post-image
After $HYPE surged to 79.906, I instead took 70% off first. It’s not that I’m bearish, but this level is right at the key prior-high resistance, making it less cost-effective to keep chasing. The move up from 79.415 formed a breakout-pullback-breakout structure, with each pullback holding at a higher key level and volume expanding on the breakouts.

The key levels are clear now: the prior high is the first key level. If, after breaking through, price pulls back on declining volume and holds the upper boundary, that would be the new entry setup; if it simply pushes above and then falls back, i
post-image
HYPE+2.15%
DOGE+0.94%
SNDK+0.27%
If Uniswap on the Arc chain officially starts burning UNI, calculations based on yesterday’s data suggest that more than 60k UNI could be burned per day. Based on the current data, this burn volume is fairly decent. Going forward, it will mainly depend on whether trading volume on the Arc chain can continue to grow. If trading volume continues to increase, the UNI burn rate will also accelerate.$UN This bull market has huge upside potential.
post-image
ARC-5.22%
UNI+7.88%
Insiders are fading the bounce as SYMBOL prints a fresh daily low.

$DOGE /USDT - SHORT

Trade Plan:
Entry: 0.08062 – 0.08096
SL: 0.08244
TP1: 0.07955
TP2: 0.07872
TP3: 0.07748

Why this setup?
Why now? The daily trend is bearish with a 4h setup, the 1h RSI sits at 40.93 showing weakening momentum, the 1h ATR of 0.000689 defines the volatility envelope, and the entry zone between 0.08062 and 0.08096 aligns with the short bias. The 1h price of 0.08077 confirms we are already in the trade, targeting TP1 at 0.07955 and TP2 at 0.07872 for further downside. The invalidation level at 0.08410 is t
DOGE+0.94%
Slippery slope for bulls rn
$BTC
post-image
BTC+0.42%
Market Up or down 🙄
live-cover
LIVE1,104
SPOT PREDICTION MARKET
live-cover
LIVE1,798
Ripple Connects XRP & RLUSD With AI Agent Payments
AI agents are moving beyond simple automation, and crypto is becoming part of the payment infrastructure behind them.
Ripple has added support for Stripe and Tempo’s Machine Payments Protocol (MPP) to its XRPL AI Starter Kit, enabling AI agents to make automated payments using XRP and RLUSD.
The idea is simple:
An AI agent can request a service, make a payment, and complete the transaction programmatically without requiring a human to manually approve every small payment.
Using XRP and RLUSD gives developers crypto-based payment options within
XRP+0.23%
RLUSD0.00%
  • 5
  • 2
Load More

Join 40 M users in our growing community

⚡️ Join 40 M users in the crypto craze discussion

💬 Engage with your favorite top creators

👍 See what interests you

Trending Topics

GateTopsStockPerpetualCoverage

35.54k Views1.65k Discussing

According to the latest DefiLlama report, Gate has listed 385 stock-related perpetual contracts, ranking first in coverage; average daily volume is about $1.15B and average open interest about $738M, both ranking third in the industry; liquidity depth for its five highest-volume contracts — SNDK, SKHYNIX, SPCX, SOXL, and MU — ranks first across the board. How do you view Gate leading in both coverage breadth and liquidity depth? [👉 Full Report](ttps://defillama.com/research/spotlight/deep-enough-trade-gate-case-tokens-stocks)

GateTrenchesExclusive0GasTrading

46.02k Views724 Discussing

FedHikes25bpsForFirstTimeIn3Years

30.66k Views5.55k Discussing

View More