
Square
Following
Hot
News
Notifications
Profile
Share your thoughts
placeholder
Article
$BTC The HTF setup is unfolding exactly as planned. We lost the $63.4K daily imbalance zone, and as noted 5 days ago, the plan was to wait for price to retest that level and confirm it as resistance before looking for short opportunities. The Q3 low of $57.8K was a reasonable liquidity target and our ultimate target. After Bitcoin fell below that level, it retested resistance beautifully; the 4H bearish imbalance provided further confluence, and price then moved straight to our target. This is why the HTF context matters. First determine directional bias on higher timeframes, then gradually mo
post-image
BTC-0.67%
crypto future market update
live-cover
LIVE1,850
SOXL-1.16%
BTC-0.65%
ETH-1.23%
SOL-0.74%
XAU+0.38%
Trenches
FIONA
F
bade
b
FIONA
B34n...pump
Market Cap
$.
Change
.
24h Vol
$.
Holders
.
PIEVERSE
P
bade
b
PIEVERSE
0x0e...25a9
Market Cap
$.
Change
.
24h Vol
$.
Holders
.
mihao
m
bade
b
mihao
4Cxj...pump
Market Cap
$.
Change
.
24h Vol
$.
Holders
.
IDOL
I
bade
b
IDOL
0x3b...ab07
Market Cap
$.
Change
.
24h Vol
$.
Holders
.
CLAUDIA
C
bade
b
CLAUDIA
2j5S...W2ZM
Market Cap
$.
Change
.
24h Vol
$.
Holders
.
Recently, $MU volatility has been extreme, and those who chased longs at higher levels have likely been badly caught out. This downturn has followed a very typical pattern.

This short position was opened based on the asset’s inherently high leverage, combined with persistent recent outflows and concentrated overhead selling pressure. After indicators remained under pressure, we entered at an average price of 659.86; the current price is 601.80.

Bullish momentum has gradually faded over the past few days. Rebounds have been weak, with insufficient buying support, and the price has continued
MU-0.63%
BTC-0.65%
ETH-1.23%
  • 3
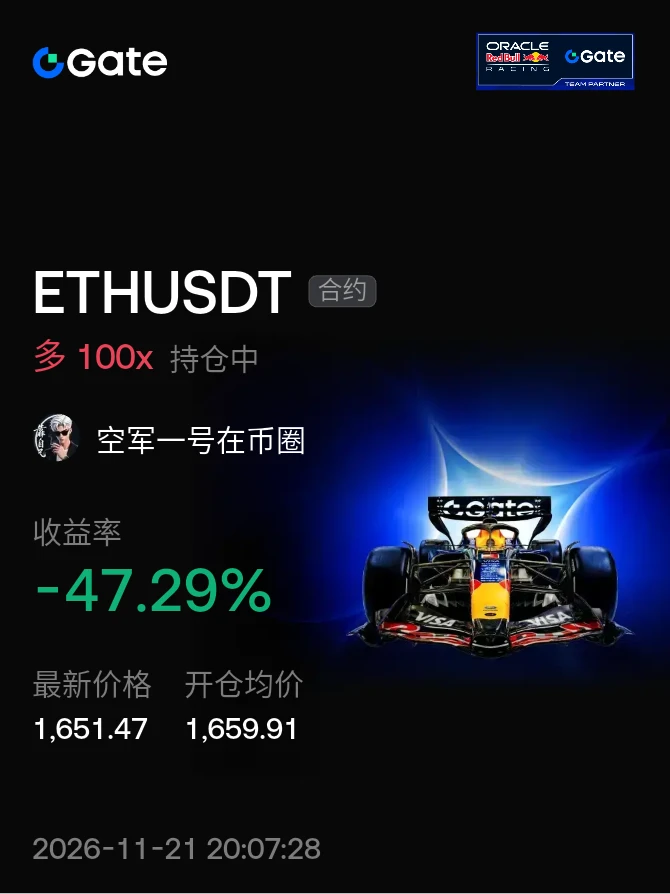
Ethereum’s 1671 target has been reached. I’ve already reduced my position around 1665. The next target is around 1550, where I’ll continue adding to my position. If it doesn’t drop, hold the position and wait to make a profit; if it drops, keep adding to lower the average price. Stay steady—we can win. Persistence is victory. Keep it up, keep it up, keep it up, keep it up
post-image
ETH-1.23%
  • 2
When earnings are at their strongest, the stock price has often already peaked—and SK Hynix is playing out that pattern.

$SKHY is SK Hynix’s tokenized stock. The South Korean memory chip giant is a core supplier of HBM/DRAM/NAND and AI storage. But the market is already pricing in a cyclical peak: quarterly earnings are at historic highs, shipments are locked in under long-term contracts, and Morgan Stanley’s “memory grim reaper,” Shawn Kim, has warned of an earnings cliff in 2028 and cut price targets across the board. After the midterm elections, the sell-off in the AI hardware chain sprea
SKHY+0.86%
BTC-0.65%
  • 1
Fund flows remain weak, with BTC, ETH, and SOL, the three major cryptocurrencies, all seeing net outflows as selling pressure continues to mount.
Specific fund flows:
$BTC : net outflow of 1380.62 BTC$ETH : net outflow of 7152.69 ETH$SOL : net outflow of 24.9k SOL
The market saw broad-based outflows today, with new capital nowhere in sight and considerable pressure on prices. Until funds return noticeably, any rebound is likely to be just a short-term recovery. The strategy remains to stay on the sidelines.
The above is solely a review of market data and does not constitute investment advic
post-image
BTC-0.67%
ETH-1.26%
SOL-0.77%
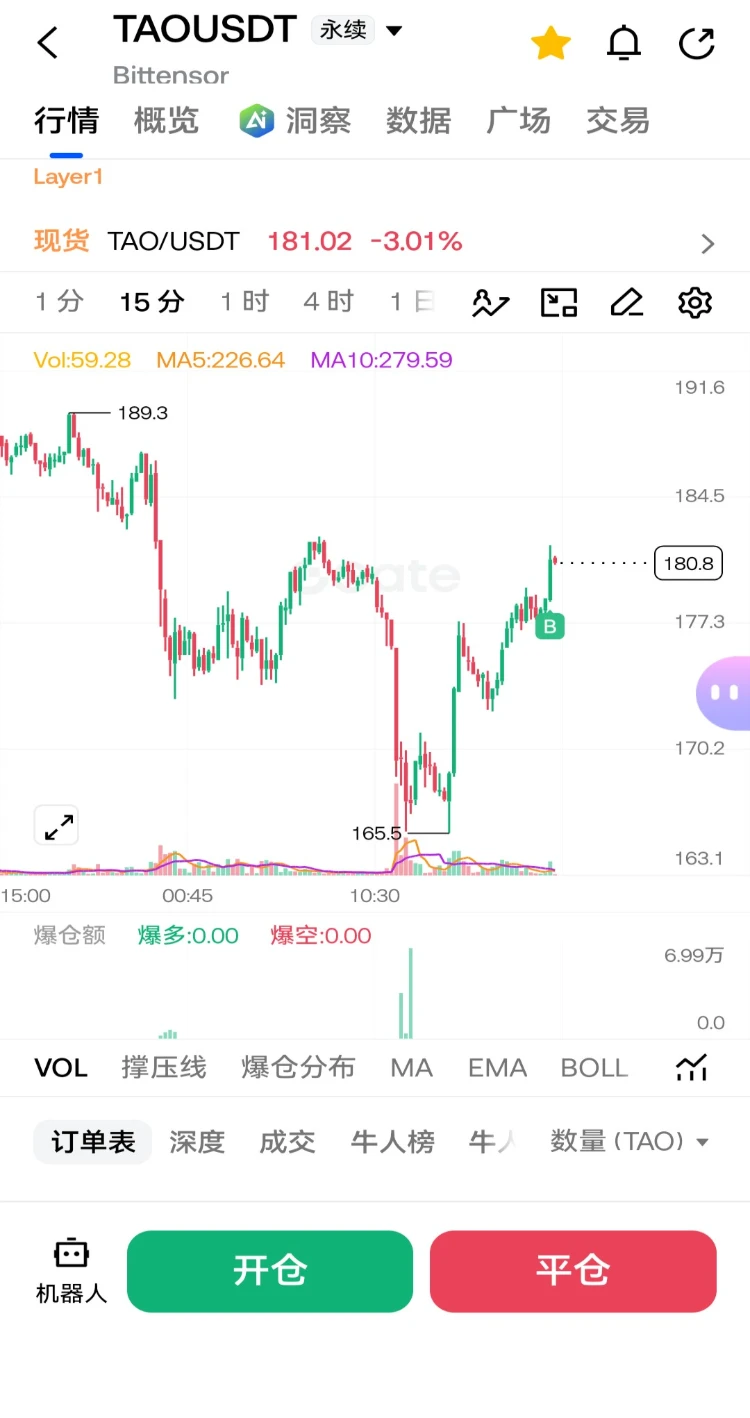
$TAO Long positions have been entered, with a reference take-profit target price of 187.5.#BTC跌破6万美元关口 #Gate年度荣耀盛典 #作手分析
post-image
TAO+0.48%
  • 3
  • 1
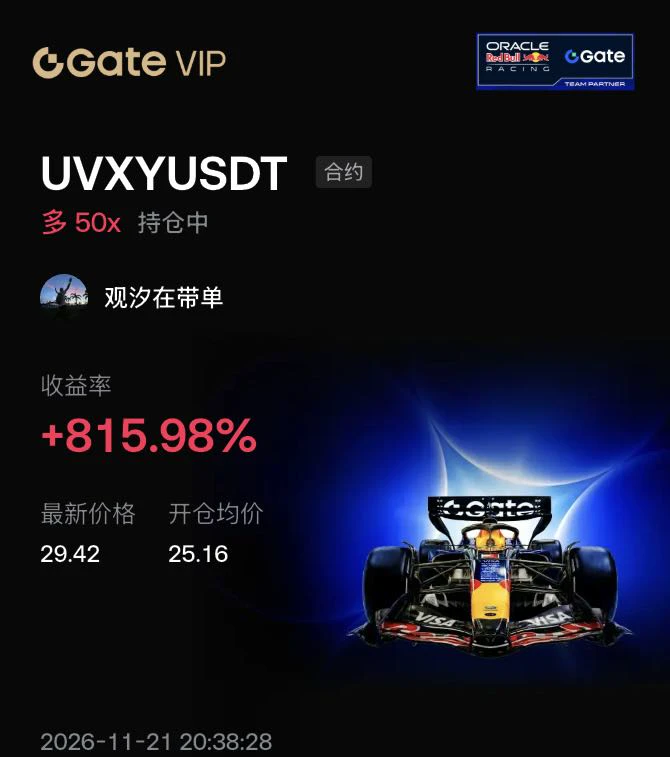
Tonight, this Red Bull race car has my heart racing

While watching the markets tonight, I had just put the kettle on when my phone pinged—a UVXYUSDT long position, entry average 25.16, current price already up to 29.42, return +815.98%, with 50x leverage still on. The kettle was making noise, I was watching the candlesticks, and it felt more thrilling than watching a Red Bull pit stop.
$BTC
UVXY is a product offering 1.5x long exposure to the VIX fear index; essentially, it's a bet on whether the market will panic. It doesn't depend on earnings reports; it depends on events like geopolitics,
post-image
BTC-0.65%
ETH-1.23%
SOL-0.74%
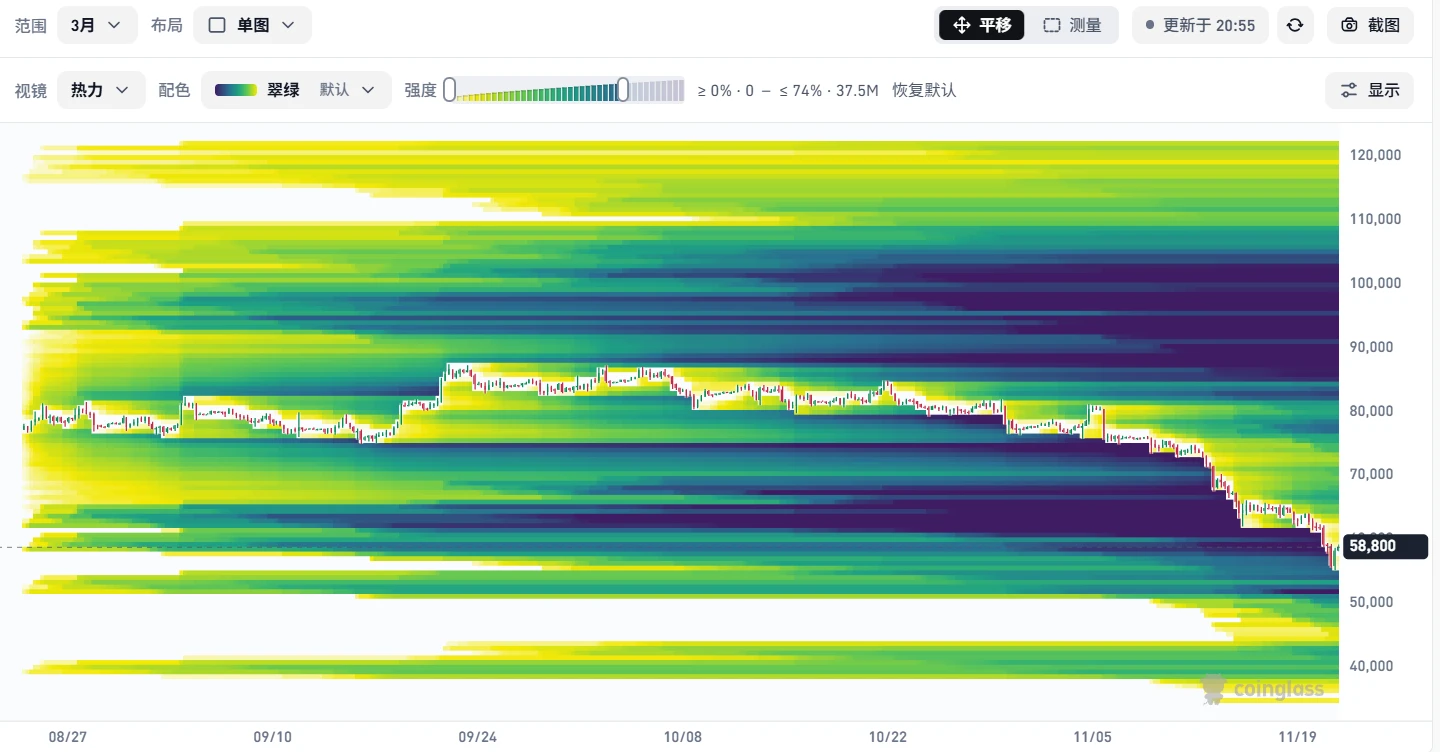
Downside liquidity has almost completely disappeared.

You know what that means, right?
post-image
$TAO Aggressively short: After a sharp decline, TAO is facing strong resistance around $179–$181. A rejection here could trigger another leg down—with considerable profit potential if sellers push the price toward lower support levels. Short $TAO
Entry: 178–181
Stop loss: 185.50
Take profit 1: 174
Take profit 2: 171.50
Take profit 3: 168
Take profit 4: 165.50
Trade here $TAO : 👇
post-image
TAO+0.41%
$SOL Cut losses promptly, immediately go long with a large position, buddy. Enter long at 69-66 $SOL 👇
post-image
SOL-0.77%
BTC also fell in today’s broad-based sell-off.

Currently at 58,152, down 5.47% over 24 hours; it hit an intraday low of 55,754.30, at one point falling 9.83% over 24 hours and dropping below $60k for the first time since July. BlackRock’s spot Bitcoin ETF (IBIT) saw a record daily net outflow of $541 million; the Fear & Greed Index came in at 9, in the extreme fear zone. ETH was at 1,620.32, down 6.23%; BNB at 536.42, down 5.9%; and SOL at 68.68, down 4.21%—all following the broader market lower.

No need to look all over—the data for this coin is all in the tags below. Click through to get e
post-image
BTC-0.67%
BLK-3.02%
IBIT-5.97%
ETH-1.26%
BNB-0.76%
🚨 Alert: Monday could become the most devastating trading day of 2026. A hidden systemic risk is closing in and could wipe out the vast majority of retail investors 📉.
The market is already in turmoil, battered by multiple negative factors—the AI bubble is starting to deflate, Nvidia (NVDA) plunged nearly 10% in a single day, and Bitcoin has fallen more than 6% amid concentrated selling. But the truly lethal threat is not these visible crashes; it is a deeper crisis lurking behind the scenes, quietly brewing and demanding everyone’s immediate attention.
Be sure to monitor official informatio
post-image
BLESS-2.00%
Arbitrum One’s Stablecoin Market Cap Increased by $327.4 Million Over the Past 7 Days
live-cover
LIVE5,139
ETH-1.26%
BTC-0.67%
SOL-0.77%
ZEC+1.16%
HYPE+0.24%
Just accept the losses this time and stop wasting effort looking for excuses. If you really have to point fingers, the blame shouldn’t be laid at crypto’s door. The real problem is that the collapse across other capital markets was far worse than expected. Bitcoin and Ethereum were simply caught in the crossfire—in other words, pure collateral damage!

Let’s go over the timeline. The sell-off in Bitcoin and Ethereum can be traced back to the 87,000 level. I thought the drop from 87,000 to 81,000 was fairly normal: a correction and consolidation after bullish sentiment cooled, building momentum
post-image
BTC-0.67%
$BTC Does a rising wedge forming at a high price and breaking downward confirm a definitive trend reversal?
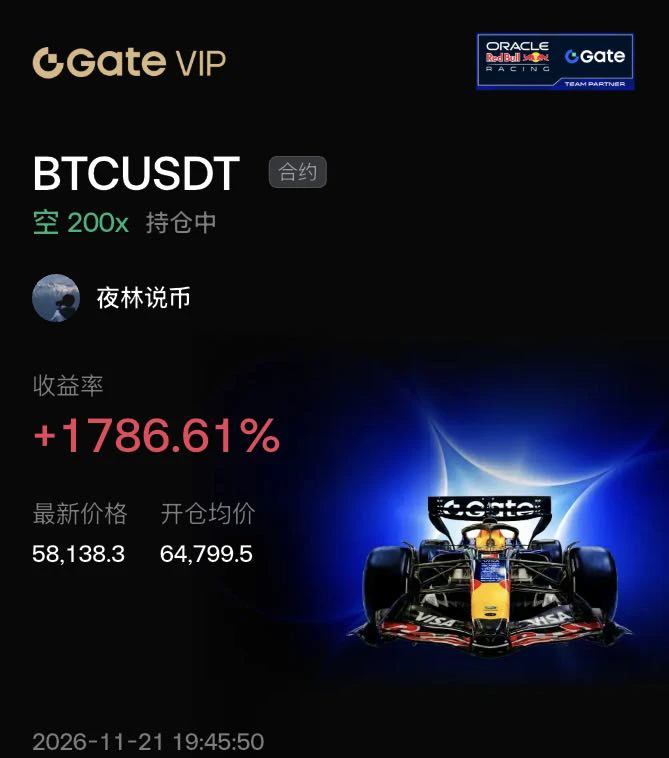
In-depth analysis: BTC formed a standard rising wedge near 64799.5. The highs moved higher, but the lows rose faster, indicating that bullish momentum was steadily fading. The subsequent violent downside breakout marked a complete trend reversal. I decisively opened a short at the moment of the breakout, using 200x leverage to precisely capture the plunge that followed the wedge breakdown!$ETH $ZEC
post-image
BTC-0.65%
ETH-1.23%
ZEC+1.29%
  • 1
Comrade, it's time to boost your energy
post-image
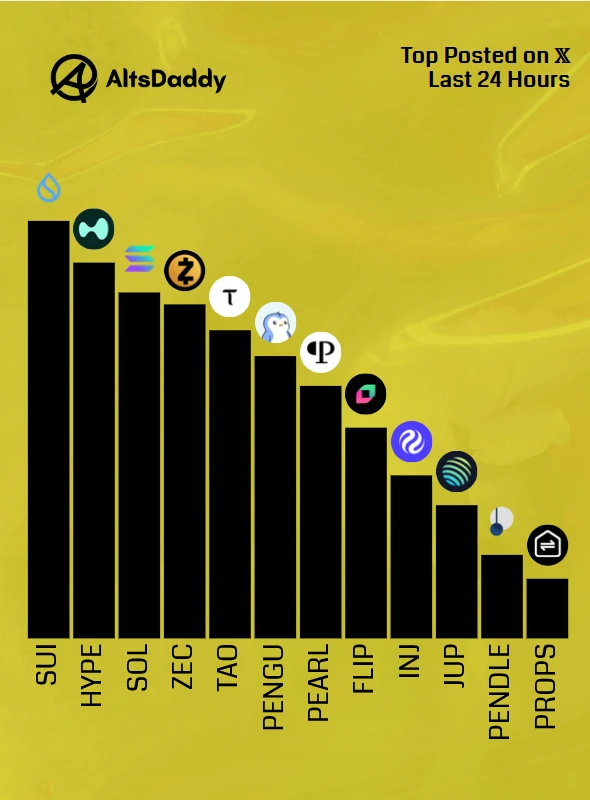
🎗️ Saturday’s Top Posted #Altcoins 🎗️
1️⃣ $SUI
2️⃣ $HYPE
3️⃣ $SOL
4️⃣ $ZEC
5️⃣ $TAO
6️⃣ $PENGU
7️⃣ $PEARL
8️⃣ $FLIP
9️⃣ $INJ
🔟 $JUP
1️⃣1️⃣ $PENDLE
1️⃣2️⃣ $PROPS
Runner ups: $KERNEL, $WSTAR, $LUCIA, $ETH, $MON
#Altseason2026 #Altcoins $DDY
post-image
SUI-1.05%
HYPE+0.24%
SOL-0.77%
ZEC+1.16%
TAO+0.41%
$ZEC Is a sharp drop in chip concentration at high levels ironclad proof of major players distributing?
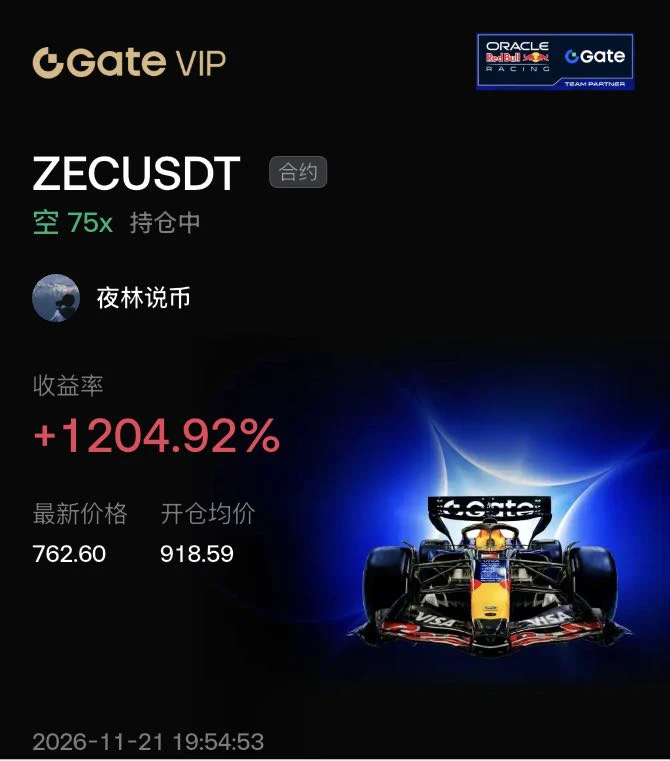
In-depth analysis: When ZEC peaked at 918.59, the chip concentration indicator plunged, showing that tokens were rapidly moving from major players into retail investors’ hands—a clear sign of distribution at the top. This is the strongest sell signal. I opened a short the moment the drop in concentration was confirmed and used 75x leverage to precisely capture the plunge that followed the distribution!$BTC $ETH
post-image
ZEC+1.29%
BTC-0.65%
ETH-1.23%
  • 1
Load More

Join 40 M users in our growing community

⚡️ Join 40 M users in the crypto craze discussion

💬 Engage with your favorite top creators

👍 See what interests you

Trending Topics

BTCBreaksBelow60K

2.1M Views29.5K Discussing

BTC fell below $60,000 on November 20 for the first time since July, alongside a tech stock selloff and broader pressure on risk assets. Will $60K become resistance, or can BTC quickly reclaim it? What price or volume signals would convince you that selling pressure is easing?

GateDirectIPOPhase3ANTAllocates92100Shares

758.6K Views4.8K Discussing

NvidiaDropsNearly14Percent

318.4K Views7.5K Discussing

View More