Share your thoughts
placeholder
Article
With this trend, I don't even need to think—the account is dancing on its own. I placed the $ARB order before bed a few days ago, when the chart was forming a solid bottom.
The bottom moved sideways without breaking down, buying pressure quietly strengthened, and all the signals were there.
I got in at 0.10885, and woke up to see 0.1833—straight up +3923.92%. I only wanted to make enough for breakfast, but the market stuffed lunch money in there too.
I took 75% of the position off the table first. Don't get greedy for the last bite, guys—money is yours only once it's in your pocket.
Don't lose
post-image
ARB+10.24%
ETH+0.73%
ADA+0.50%
No trades, no analysis, just sheer luck—this track record is embarrassing to even talk about. Too bad the market never makes sense; when it really wants to drop, it doesn't care whether anyone is prepared.
At the time, I thought this move was completely done for, so I casually placed a small short at 4.25647, just to give my restless hands something to do. Who knew that right after I placed it, the market actually started moving down, grinding all the way to 0.07118. The unrealized gain is now +1936.05%—it feels amazing, but honestly, I didn't contribute much brainpower. The market was simply
post-image
BTC+0.05%
BNB-2.57%
After $FARTCOIN rallied, I didn’t exit my entire position. I took 80% in profits first and moved the protective stop on the remaining position above breakeven. Just now, a quick pullback took out the remaining position, locking in the profits smoothly.

The entry reason was simple: on the hourly timeframe, price pulled back to the previous high without continuing lower, and instead reclaimed the area above the moving average on rising volume. This was a textbook pullback confirmation. After going long, I kept my stop loss below the lower boundary of the small range.

After the pullback took
post-image
FARTCOIN+3.15%
SNDK+1.18%
ZEC+22.69%
$900,000 in sell pressure today on $FLORK
yet, it has held (and is now higher) than all of these sells.
if you can’t understand how insane that is for a 19m mc coin i don’t know what to tell you.
post-image
FLORK-22.43%
$ETH Signal】Go long + 4H bullish trend unbroken/1H bearish momentum exhausted
$ETH Sell-side depth dominates, depth_imbalance -74.21%, 1H MACD histogram -2.47, with the negative value converging. Price 2492.39 is hugging the 1H Bollinger middle band, while the 4H Bollinger middle band at 2483.96 is just below. EMA20/50 are in a bullish alignment on the 1H, with a funding rate of 0.0018% and no signs of excessive leverage.
🎯Direction: 【Long】
⚡Entry/Limit Order: 【Snipe the 2484.9128 - 2492.3900 range】
🛑Stop Loss: 【2467.4661】
🚀Target 1: 【2529.7758】
🚀Target 2: 【2548.4688】
🛡️Trade Management:
post-image
ETH+0.73%
BTC+0.01%
SOL+2.14%
The future of finance
$TITTIES
post-image
Pumpfuns squad feature is a super cool way to trade with friends.
Sent from my Pumpfun app.
post-image
Beginner Trader - Real Account Live
live-cover
LIVE77
Pump realized they were losing the game, so they engineered two coins to run with KOL support just to prove they weren’t washed.
If you believe this shits organic i have bad news for you!
post-image
PUMP+0.81%
Everyone’s eyeing BNB at 750—but the 4h chart is silently screaming “trap” while the daily range holds its breath.

$BNB /USDT - SHORT

Trade Plan:
Entry: 749.30 – 751.40
SL: 760.45
TP1: 742.77
TP2: 737.72
TP3: 730.14

Why this setup?
- Price is pinned at 750.35 with a 1D range, yet the SHORT bias (conf 55) targets a clean drop to 742.77 first.
- RSI on the 15m is only 56.1—no overheated bounce fuel, while ATR (4.2) shows volatility is compressed, priming a snap.
- Why now? The “waiting” status means the entry zone (749.30–751.40) is the exact battlefield; a rejection here flips momentu
BNB-2.57%
$NOK
There is a ShortW type setup
post-image
NOK+2.86%
Everyone’s staring at FLOCK’s 4h chart—but the real trap is hiding in the 15m RSI.

$FLOCK /USDT - SHORT

Trade Plan:
Entry: 0.07274 – 0.07490
SL: 0.08417
TP1: 0.06605
TP2: 0.06088
TP3: 0.05311

Why this setup?
Why now? The 1D trend is *range*, not breakout. Your 4h bias is SHORT at 0.07382, but the 15m RSI (52.97) shows a weak bounce—not a reversal. ATR (0.0043) is thin, meaning price can slide silently.
- Entry zone: 0.07274–0.07490 (wait for the fill).
- TP1 at 0.06605 is a 10% drop—no news needed.
- If we lose 0.05176, the thesis is dead. Don’t marry the trade.

Debate:
Is FLOCK’
FLOCK+21.39%
Everyone, are you satisfied with this yield and stability?
$GIGGLEMAX ‌$GIGGLEMAX The $0.02 Decision Zone
CURRENT MARKET STRUCTURE
GIGGLEMAX is trading around $0.02, placing the token at a critical short-term decision area. The latest market structure shows that this is not a level where price direction should be assumed from one candle alone. Buyers need to prove that $0.02 can develop into a sustainable base, while sellers will be watching for a breakdown that could trigger a deeper retracement.
The wider chart also shows why volatility must be treated seriously. GIGGLEMAX has already demonstrated the ability to move rapidly, so percentage changes
post-image
GIGGLEMAX-31.96%
#Gate事件合约晒单挑战 Tokenized Stocks Are Growing in DeFi And UNI & KMNO Are Now in Focus
The latest September 6 data shows an important shift in the tokenized-stock DeFi market. Uniswap V4 is currently leading the category with $59.1M in TVL, followed by Kamino Lend at $41.7M and Uniswap V3 at $20.9M. Together, these three protocols represent approximately 63% of the category’s $192.6M total TVL. That concentration is significant because it shows where the largest amount of tokenized-stock liquidity is currently sitting.
THE BIGGER SIGNAL: $192.6M TVL
The most important number is not only the $59.1
post-image
UNI+0.32%
KMNO-0.43%
Bought this beauty early
-> $QSTRAT is on 🔥🔥🔥
CA:
0xF05bCf94C8C020E43de8927B491c6BE8B96777E3
post-image
$MARA
It gave me the impression that it may be forming an inverse H+S in this area
post-image
MARA-2.41%
#Gate事件合约晒单挑战
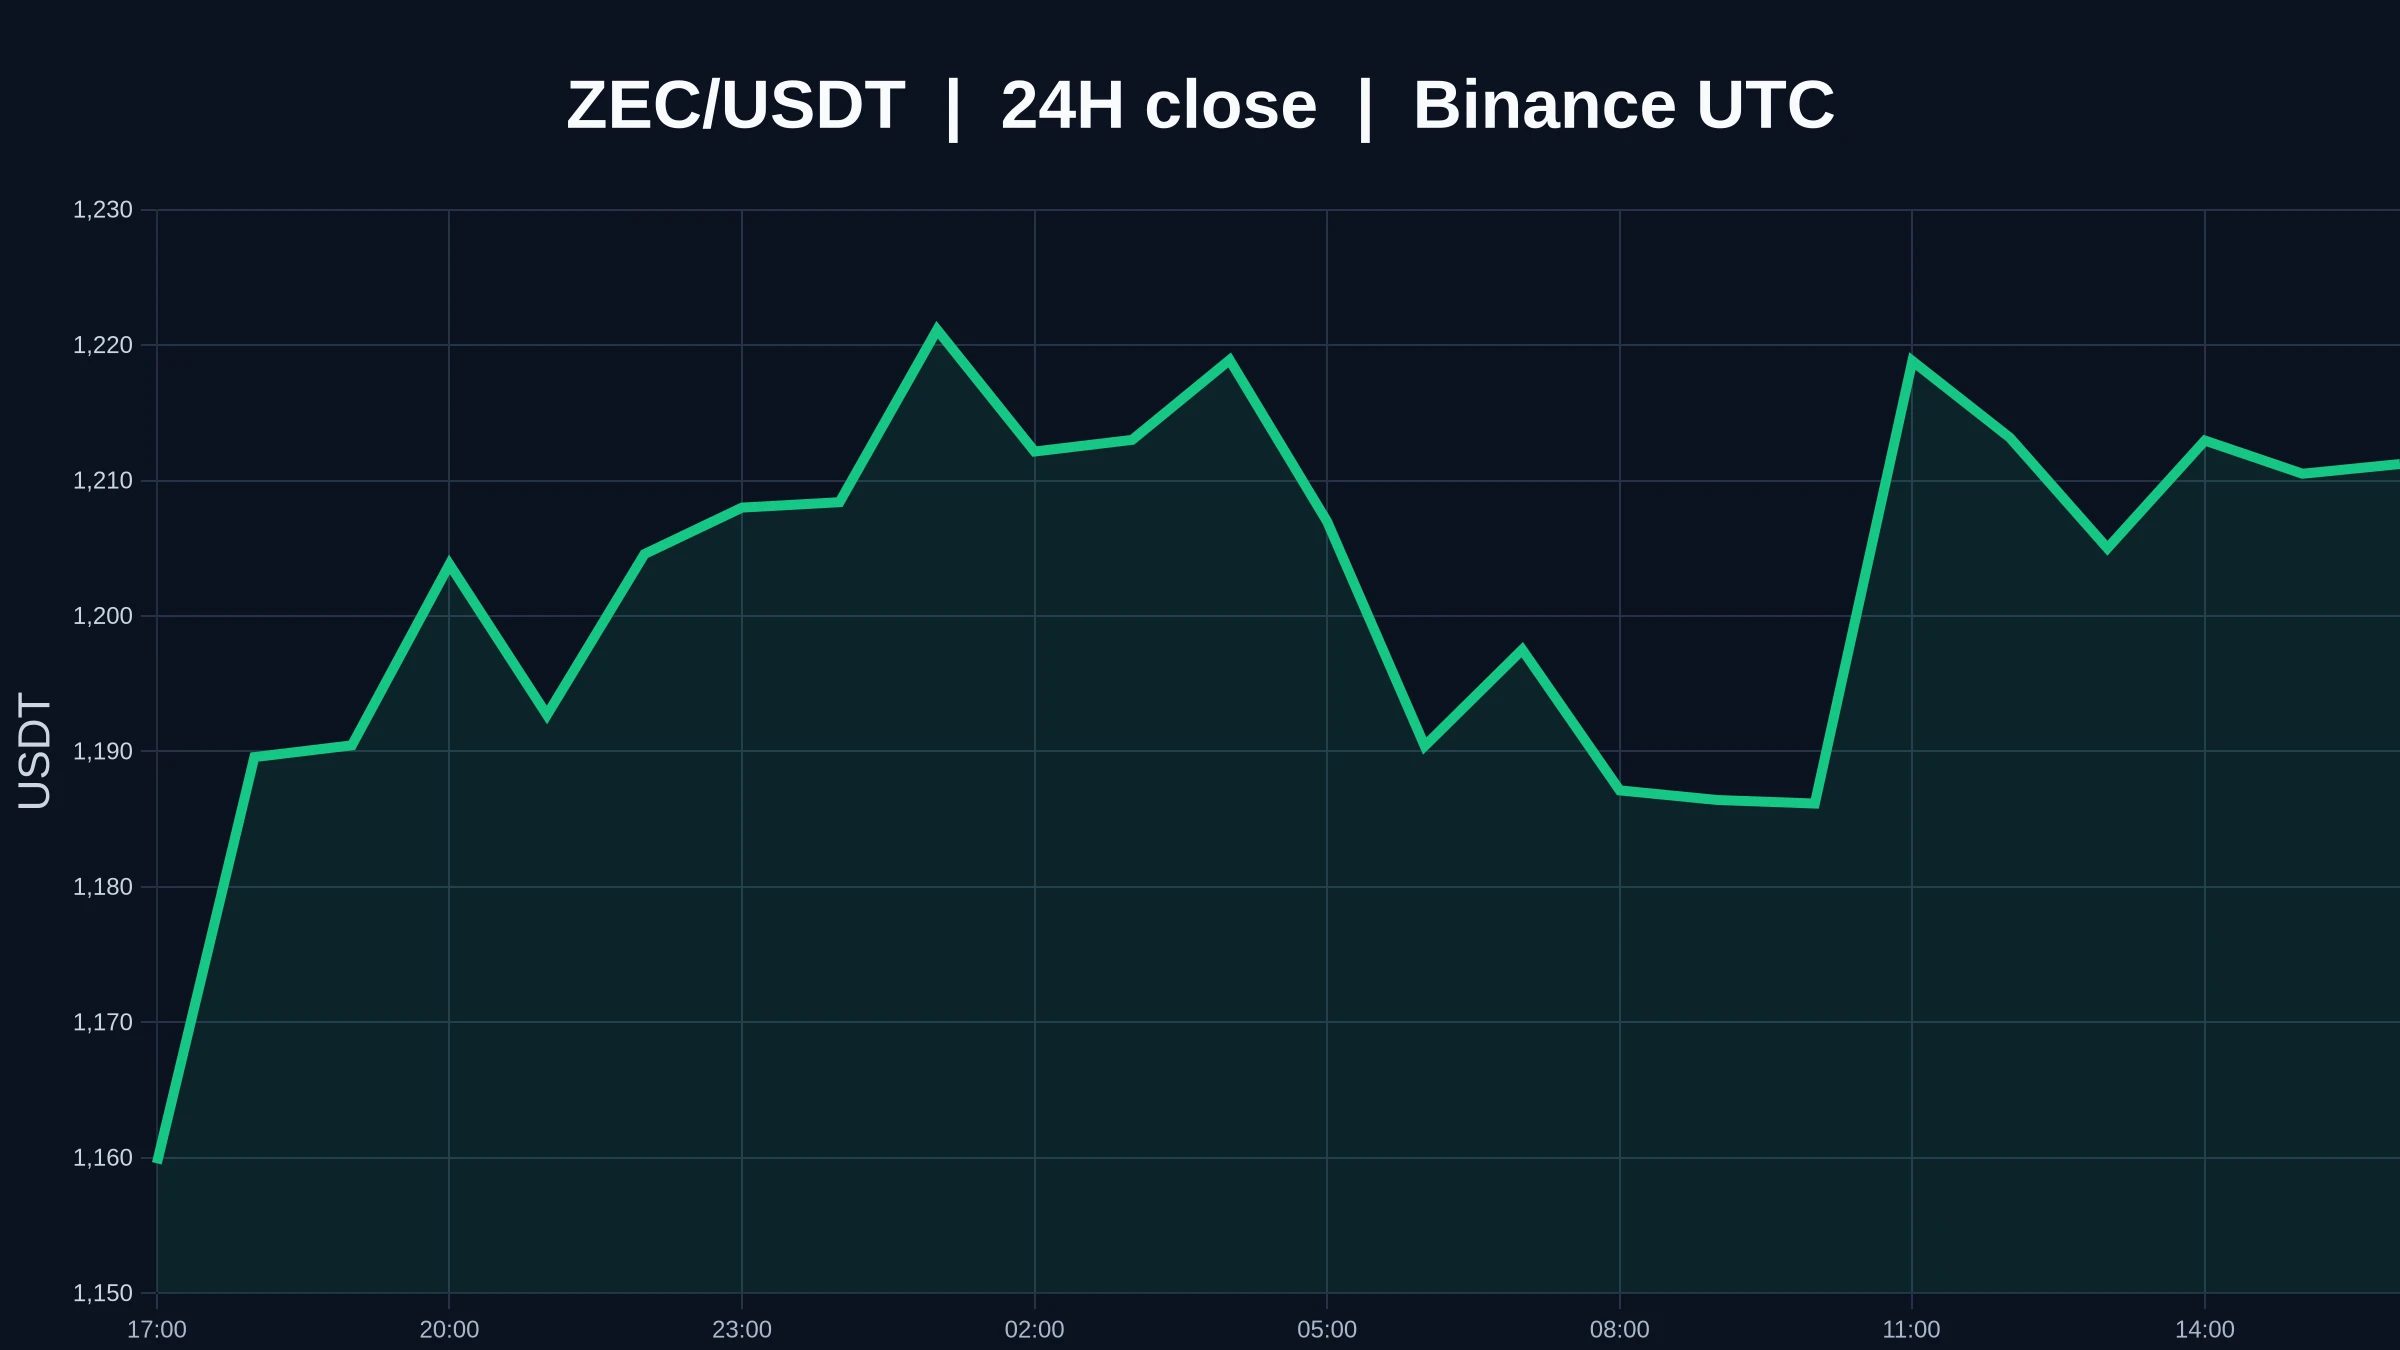
Zcash has moved ahead of Dogecoin to become the tenth-largest cryptocurrency by market capitalization. Latest data from CoinMarketCap and market reports on September 6, 2026 show ZEC’s market value at approximately 19.64 billion dollars, placing it above DOGE.
ZEC has traded in a strong upward range in recent sessions, with prices moving through the 1,000 to 1,170 dollar zone on elevated volume. Circulating supply sits near 16.8 million coins against a maximum of 21 million. This relatively limited float has magnified the effect of recent capital inflows. Over the past thirty da
post-image
ZEC+22.58%
DOGE+0.04%
I was just about to go to the forum and rant, but then I saw my balance and decided against it—the market is always right.

During the intraday plunge, $ZKC fell from 0.04950 all the way down. Watching the entire screen turn green actually calmed me down. Before that, it had rebounded several times, but every time it approached 0.04950, it was pushed back down. Selling pressure remained heavy, making it clear that no one above was willing to take the other side. So I didn’t chase longs; instead, I waited for the rebound to lose momentum and tried a short. The price has now dropped to 0.04876
post-image
ZKC-1.01%
BNB-2.57%
BTC+0.05%
Load More

Join 40 M users in our growing community

⚡️ Join 40 M users in the crypto craze discussion

💬 Engage with your favorite top creators

👍 See what interests you

View More