Share your thoughts
placeholder
Article
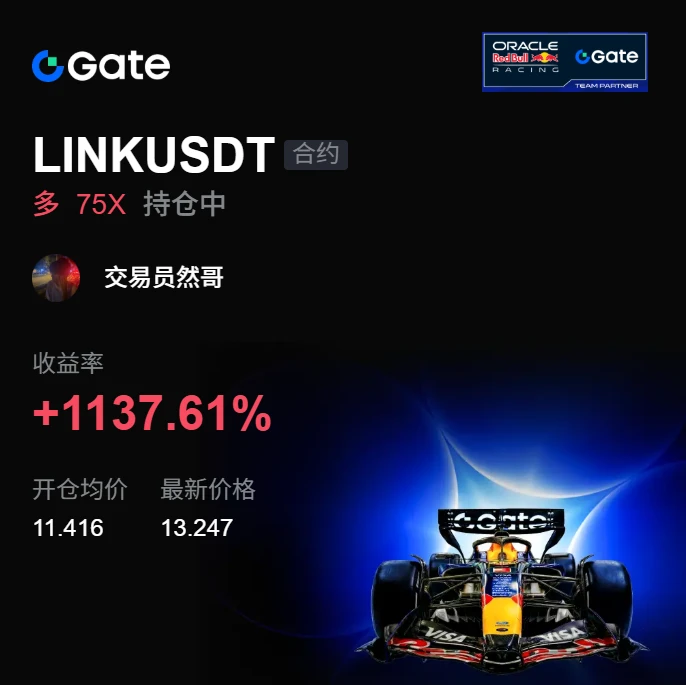
This return has me feeling nervous, afraid the market will come to its senses tomorrow and blacklist me🙈. The last thing I saw before bed a few days ago was that the key level for $LINK was still holding firmly; after several pullbacks failed to break it, I knew the position could safely be held overnight.

I didn't predict much—there were buyers, volume hadn't contracted, and the risk-reward at 11.416 was good enough, so I went long with the trend. The rest was best left to time.

Refreshing the price first thing in the morning, 13.253 had already written the performance report for me: +11
post-image
LINK+10.18%
XRP+0.55%
BTC+0.42%
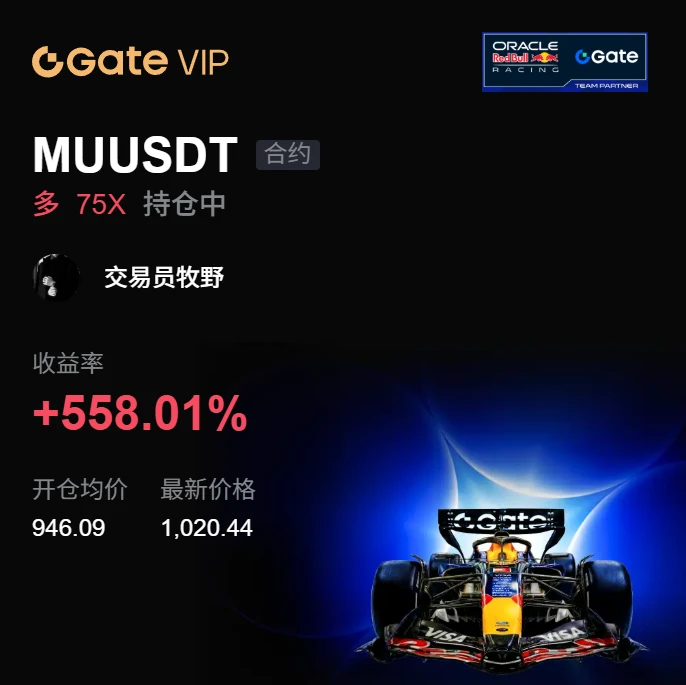
A few days ago, my hand trembled as I set the stop-loss; this morning I realized that was unnecessary filial piety. During the repeated intraday swings, $MU /MU kept making scary fake drops, but it held firm after every pullback, so I went long with my eyes closed.
I checked the market this morning and saw that staying up late hadn't been in vain. With a cost basis of 946.09, it's now at 1020.44, +558.01%. This move climbed up step by step from the bottom—solid and reassuring.
I’ve pocketed 80%, and raised the protection on the remaining 20%. Let the remaining profits run; even if it turns bad,
post-image
MU+1.05%
BNB-1.92%
SOL+2.84%
#GateTops7DayNetInflowsGlobally Gate Tops Global 7-Day Net Inflows — A Strong Signal of Growing Market Confidence
In the fast-moving world of crypto, capital flow is one of the most important indicators of market sentiment. While prices can change within minutes, sustained net inflows can provide a broader picture of where users and capital are moving.
GateTops7DayNetInflowsGlobally highlights Gate’s strong position in global 7-day net inflows, drawing attention to the platform’s growing activity and increasing participation from the crypto community.
Why does this matter?
Net inflows reflec
post-image
BTC+0.39%
ETH+1.33%
Everyone’s long $PONS /USDT at 0.8448—but the 4h tape just whispered a trap.

$PONS /USDT - SHORT

Trade Plan:
Entry: N/A – N/A
SL: N/A
TP1: N/A
TP2: N/A
TP3: N/A

Why this setup?
Why now?
- Daily trend is *range*, not breakout—mean reversion is the game.
- RSI on 15m at 53.74 shows zero momentum, just a dead cat bounce.
- Signal says SHORT with 55% confidence—not a slam dunk, but the edge is against the crowd.
- Entry ref 0.8448 is the line: below it, shorts breathe; above it, the range wins.

Debate:
If PONS breaks 0.8448, do you fade the range or flip long—what’s your invalidati
PONS-2.32%
$PI Once again, those clues are being spread for the thousandth time.
This, of course, is not a coincidence
The Beta System is shedding its old shell and will soon transform into its planned version, its ideal version
If you know, you know
PI-0.79%
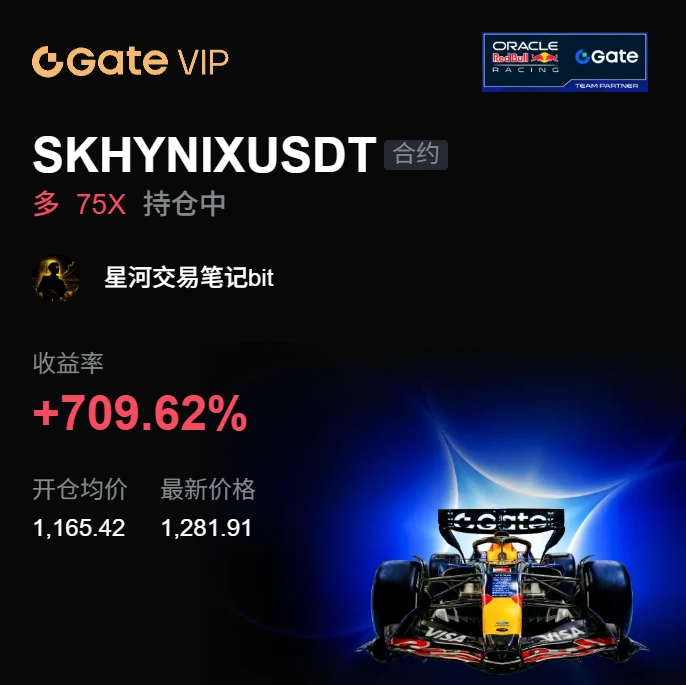
This long trade was actually rather uncomfortable. Right after entering, I got hit by a false-breakout wick, which nearly swept my stop-loss at a key level. I didn’t cut the position at that level because volume hadn’t expanded; instead, it looked more like a shakeout. The chart then saw a series of consecutive small bullish candles, and the battle between bulls and bears quickly shifted in favor of the bulls. When the price reached around 1282.02, I took profit on 70% of the position and moved the stop-loss on the remaining position above breakeven. The profit is currently at +710.41%, and th
post-image
BTC+0.42%
BNB-1.92%
Cast the line on Sunday, reeled it in on Monday. The fish isn’t big, but 3,000 little joys are just enough to start Monday in a good mood. 🎣
#BTC收复8万美元 $BTC $GT $ETH
BTC+0.42%
GT-1.34%
ETH+1.33%
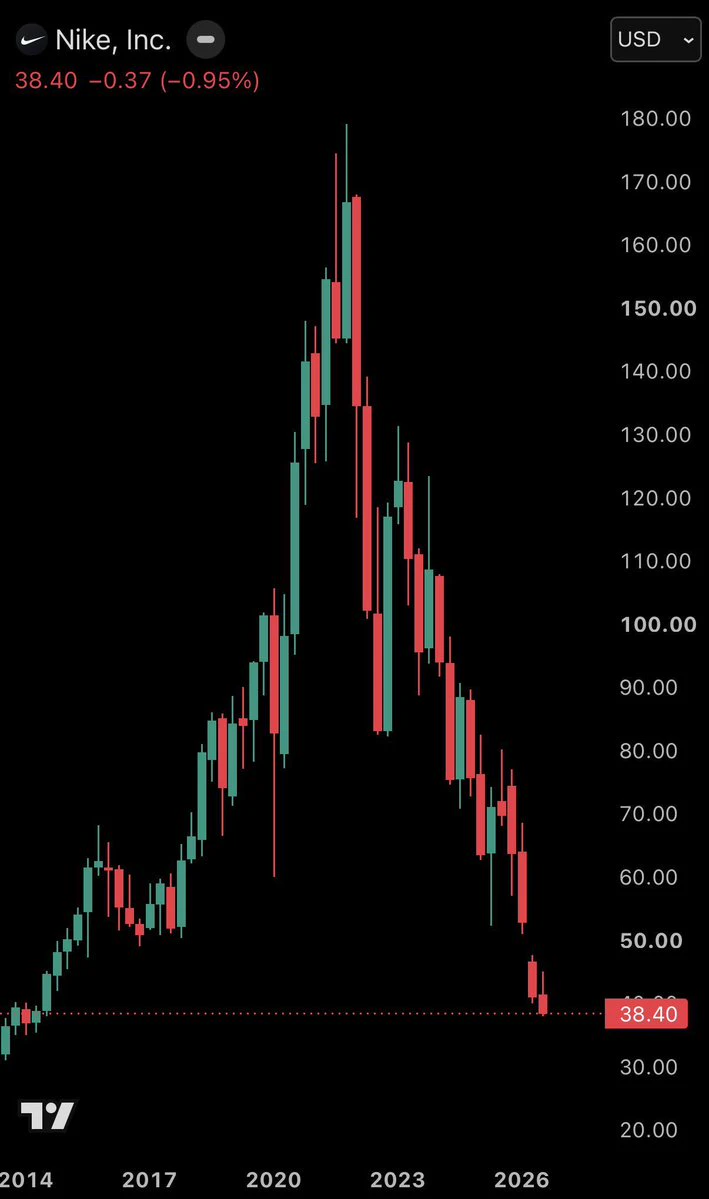
This is not an altcoin, not a meme coin—this is Nike.
post-image
NKE-0.86%
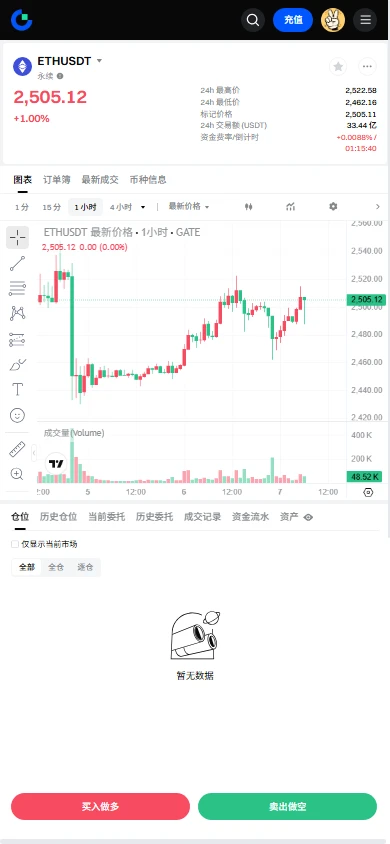
$ETH Signal】long + 4H MACD bullish expansion/1H pullback support
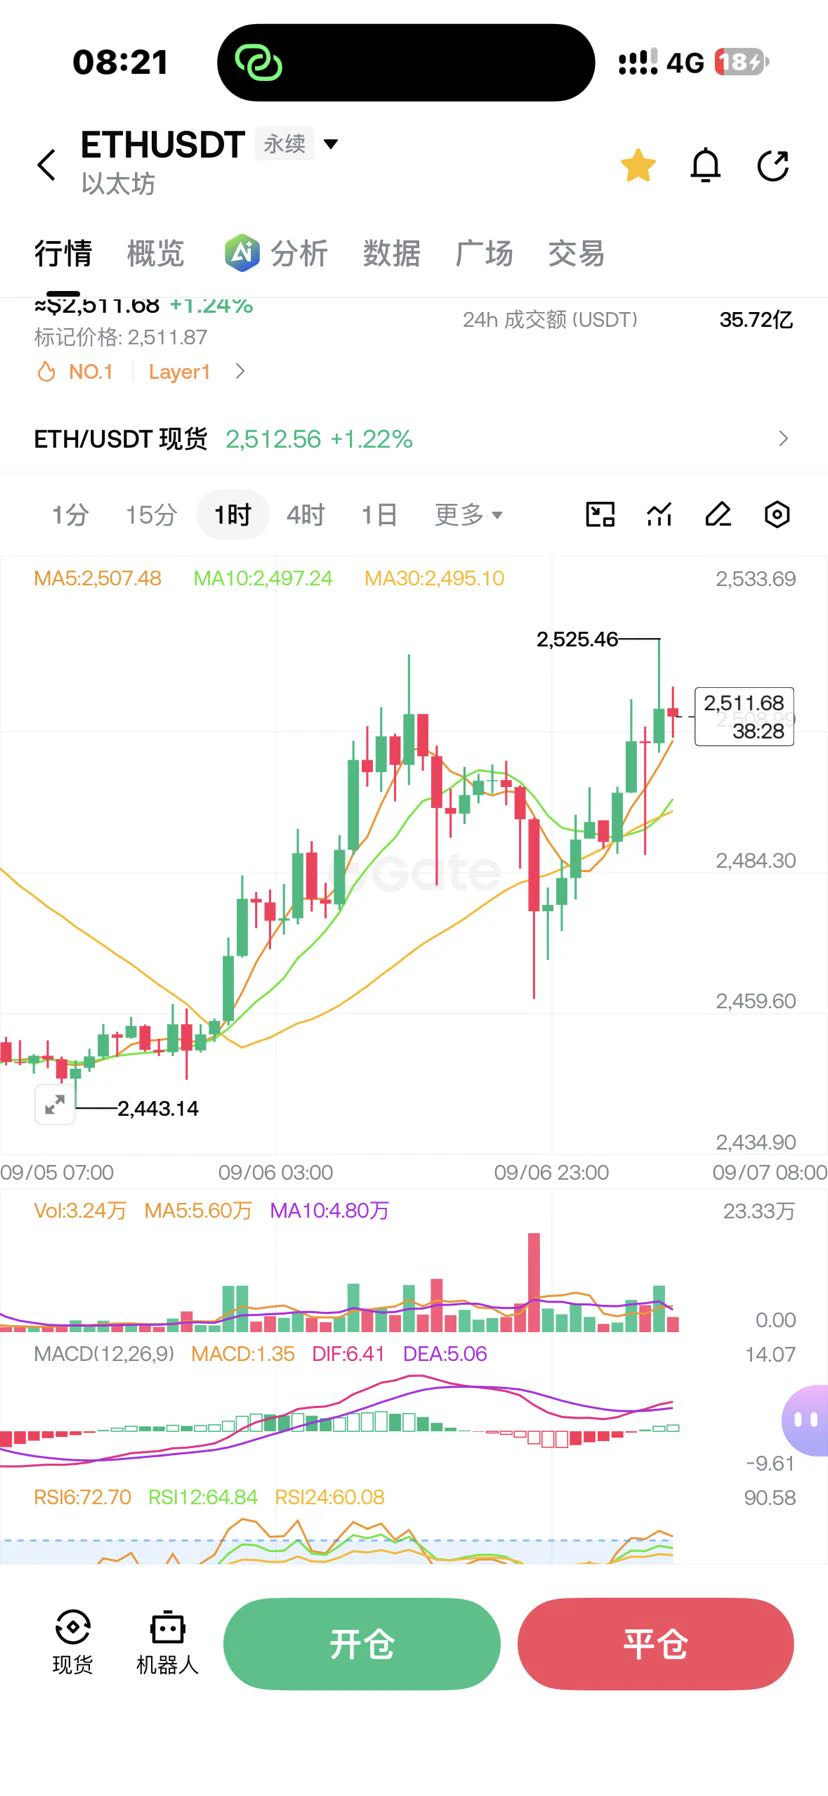
$ETH Depth imbalance -57.52%, sell orders dominate, with price holding above 2489. The 4H MACD bullish bars are expanding, while OI remains stable without contracting. 1H Bollinger Bands are tightening at 2478-2514, with two dips to 2488 followed by a rebound to 2496. RSI is 54 on 1H and 57 on 4H. The funding rate is 0.0051%, indicating little short pressure. Sell orders at 2489 have been tested repeatedly without a break.
🎯 Direction: long
⚡ Entry/order placement: 2489.6409 - 2496.3200
🛑 Stop loss: 2462.9246
🚀 Target 1: 25
post-image
ETH+1.33%
BTC+0.39%
SOL+2.82%
Overall maintaining a range-bound upward trend
ETH is currently trading at $2,510, up about 0.57% over the past 24 hours and slightly down 0.64% over 7 days, overall moving sideways while building momentum. The funding rate is only 0.0068%, with a long-short ratio of 1.42, indicating mildly positive derivatives sentiment; the latest available daily net inflow for spot ETFs was approximately $26.46 million. Bullish sentiment dominates the community, but whale short positions and resistance around $2,530 are creating divergence. In the short term, ETH is expected to remain range-bound with a bul
post-image
Everyone’s staring at gold—but silver just flashed a quiet sell signal that could catch the crowd off guard.

$XAG /USDT - SHORT

Trade Plan:
Entry: 66.19 – 66.25
SL: 66.48
TP1: 66.02
TP2: 65.89
TP3: 65.69

Why this setup?
- $XAG /USDT is pinned at 66.22 with a 4h SHORT bias (55% confidence), yet the 1D trend is range—so this isn’t a breakout, it’s a squeeze.
- RSI on the 15m sits at 51.38—neutral, meaning the next push down to TP1 (66.02) won’t be overbought resistance, just pure gravity.
- ATR on 1h (0.11) is tight—when volatility this low finally breaks, the move to TP3 (65.69) often
XAG+0.14%
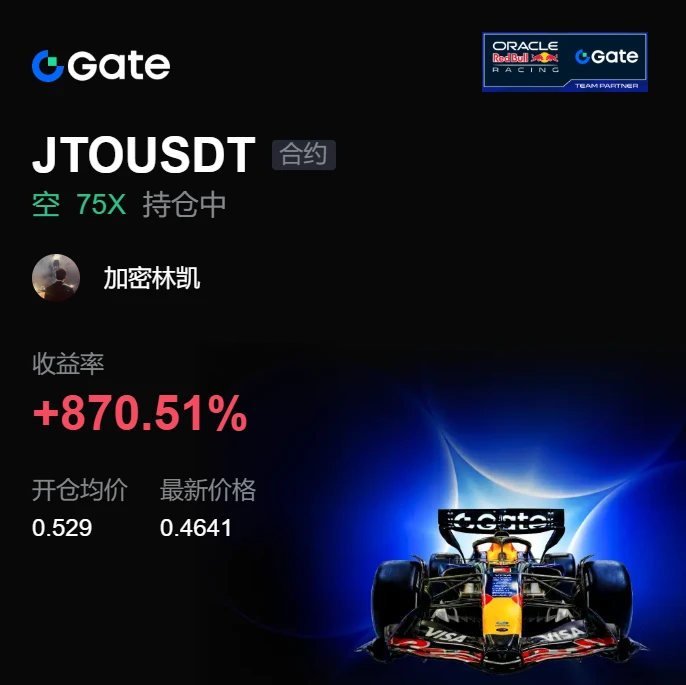
With this trend, I don’t even need to think—the account is dancing its way downward on its own, and all I need to do is cheer from the sidelines.

While everyone else was still watching from the sidelines, I already felt something was off. $JTO bounced for two days, but each upward push kept falling just short, with low trading volume—a textbook weak rebound. Before the market had fully started moving, I was watching its ability to absorb selling pressure. The more I looked, the weaker it seemed, so I simply opened a short at 0.5290.

I was nervous at the time too, worried that entering on
post-image
JTO+12.22%
SNDK+1.29%
ETH+1.33%
#GateTops7DayNetInflowsGlobally
💰 CAPITAL FLOW IS SPEAKING — BUT BTC STILL HAS TO CONFIRM THE MESSAGE
One of the biggest mistakes traders can make is watching only the price chart.
Price tells us what is happening.
But capital flow can sometimes tell us where market participants are positioning themselves.
That is why Gate’s latest net-inflow data has caught my attention.
According to recent DeFiLlama-based data reported by Gate, Gate recorded approximately $520.45 million in net inflows over the past month, placing it #3 globally among centralized exchanges.
Earlier August data also showed
BTC+0.39%
ETH-2.49%
#GateEventContractTradeSharingChallenge
🎯 WHAT IF TRADING WASN’T ONLY ABOUT PRICE?
Crypto trading has always been about trying to understand what comes next.
Will Bitcoin break higher?
Will Ethereum hold its momentum?
Can Solana continue outperforming?
Will a major event push the market in one direction?
These questions are at the center of every trader’s decision.
Now, Gate is giving users another way to express those market expectations through its Event Contract Trading & Sharing Challenge, which is currently live through September 10.
What makes this campaign different is that it combine
BTC+0.39%
ETH+1.33%
SOL+2.82%
GT-1.29%
ZEC+18.28%
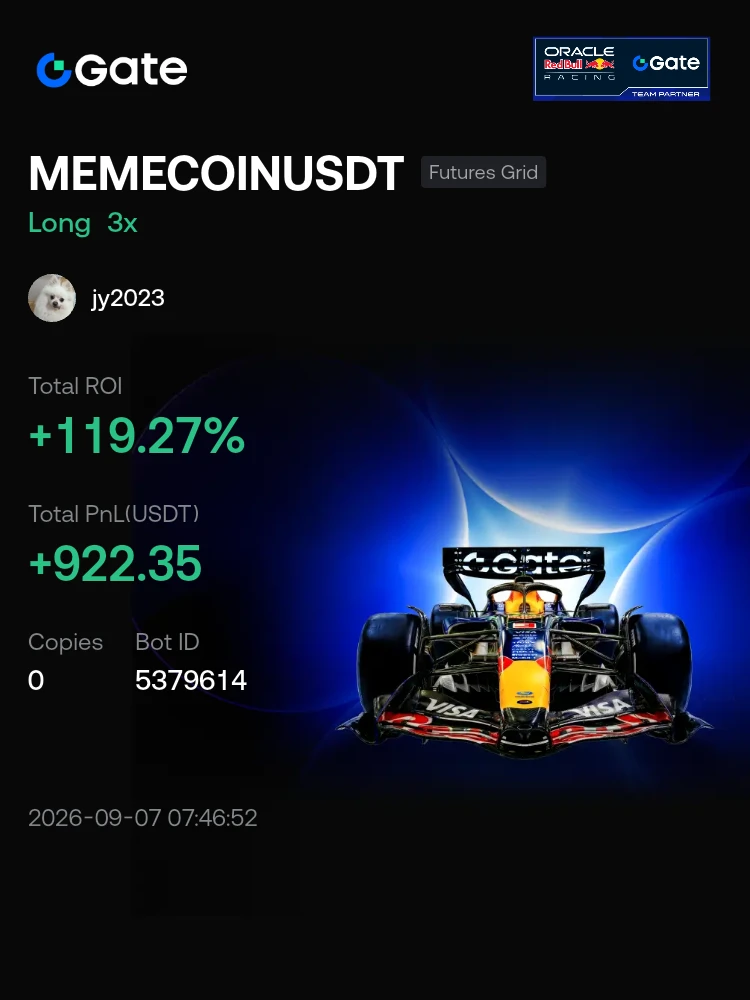
#Bots I'm trading MEMECOINUSDT with the Futures Grid bot on Gate. Join me!
post-image
BOT+0.41%
$RAY
RAY is up approximately 40.85% over 24 hours, currently at 1.2816 USDT, with a trading volume of approximately 3.43M USDT. On the 1-hour timeframe, it rose continuously from around 0.90, touched 1.4416, and then pulled back. For now, it looks more like high-volatility turnover than one-sided acceleration.
In the short term, watch the 1.25—1.26 support first; if it breaks, look to 1.20. Above, 1.33—1.40 is the first resistance zone, while 1.4416 is the key high for this move. Raydium is a decentralized trading and liquidity protocol on Solana, covering AMM, concentrated liquidity, LaunchL
post-image
RAY+43.04%
Everyone’s staring at TAO’s 260.5, but the real trap is the range you’re ignoring.

$TAO /USDT - SHORT

Trade Plan:
Entry: 259.2 – 261.8
SL: 276.3
TP1: 248.7
TP2: 240.8
TP3: 229.0

Why this setup?
Why now?
- 1D trend is *range*, not trend—so the 77% SHORT bias is a mean-reversion play, not a breakout.
- 4h structure pins entry at 260.5 with tight 1h ATR (5.05)—volatility is compressing, which precedes a snap.
- RSI 15m at 54 shows no exhaustion yet, but price is stalling under range highs; TP1 at 248.7 is a 4.5% drop, not a gamble.

Debate:
If range holds, do you fade the first touch
TAO+11.98%
Load More

Join 40 M users in our growing community

⚡️ Join 40 M users in the crypto craze discussion

💬 Engage with your favorite top creators

👍 See what interests you

View More