
Square
Following
Hot
News
Notifications
Profile
Share your thoughts
placeholder
Article
$SOXL $TQQQ My positions today totaled 300k U from the low to the high, and I’ve secured all the profits. I’ll leave the gains from here on to others. Thanks, market
post-image
SOXL-1.16%
TQQQ+10.32%
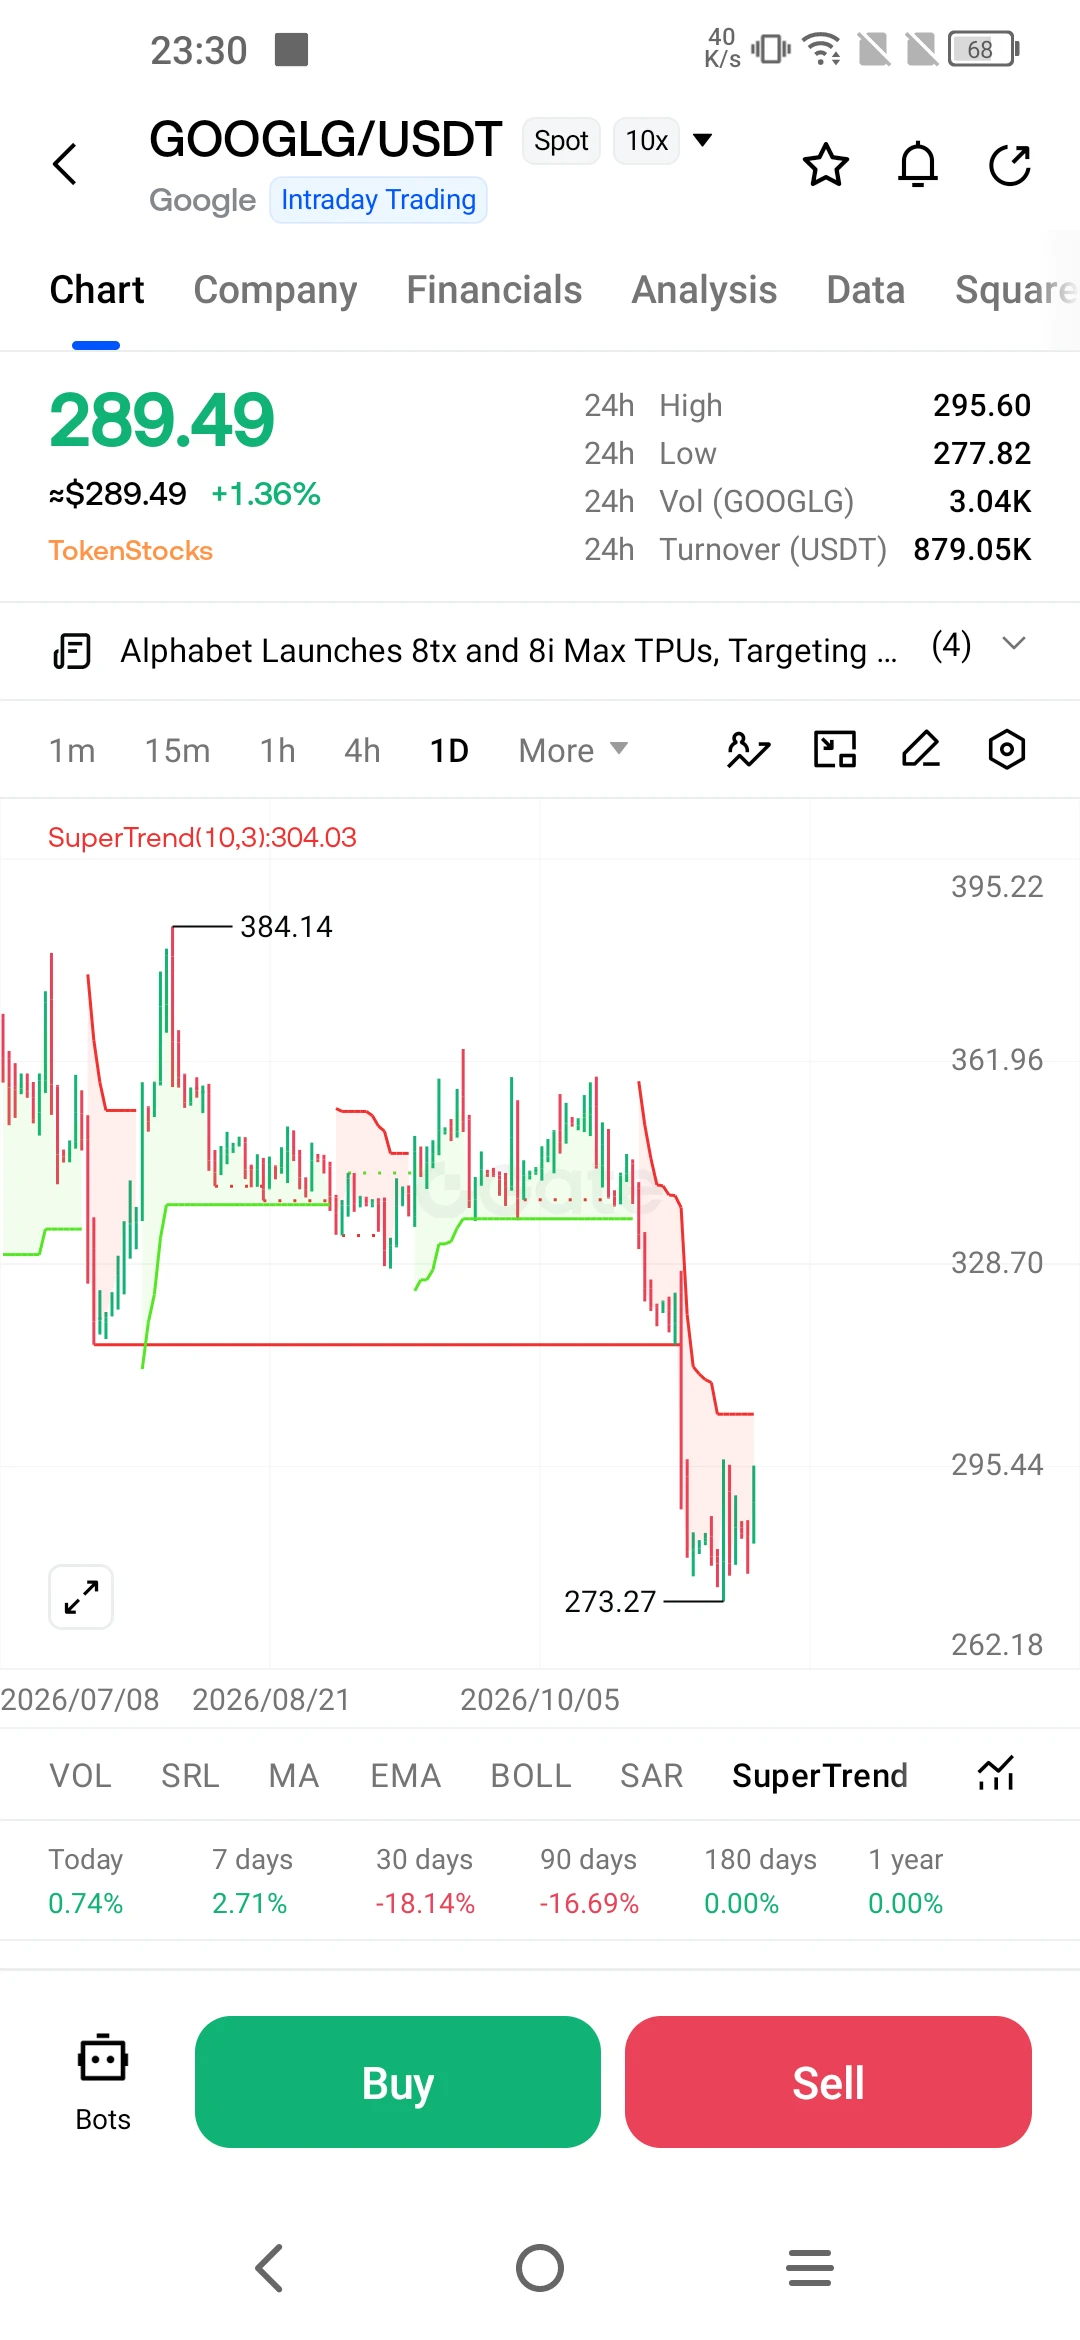
Sometimes, the market presents such peculiar moments—a stock hits rock bottom just as the company unveils a breakthrough in new technology. This is precisely what happened with GOOGL/USDT. The chart shows a sharp decline from $384 to $273, followed by an attempt at recovery. At first glance, one might attribute this drop to the new artificial intelligence chips introduced on November 9. In reality, however, the situation is more nuanced; the decline wasn’t caused by the chips themselves, but rather by Google paying the price for its own success.

The catalyst for the collapse was the earnings
post-image
GOOGLG+0.09%
GOOGL+0.11%
GOOGL+1.21%
GOOGL-0.13%
Trenches
牛逼
牛
bade
b
牛逼
0x96...7777
Market Cap
$.
Change
.
24h Vol
$.
Holders
.
PIEVERSE
P
bade
b
PIEVERSE
0x0e...25a9
Market Cap
$.
Change
.
24h Vol
$.
Holders
.
STONK
S
bade
b
STONK
6GmA...UNgx
Market Cap
$.
Change
.
24h Vol
$.
Holders
.
BTC
B
bade
b
BTC
C5xp...pump
Market Cap
$.
Change
.
24h Vol
$.
Holders
.
ON
O
bade
b
ON
0x0e...1d48
Market Cap
$.
Change
.
24h Vol
$.
Holders
.
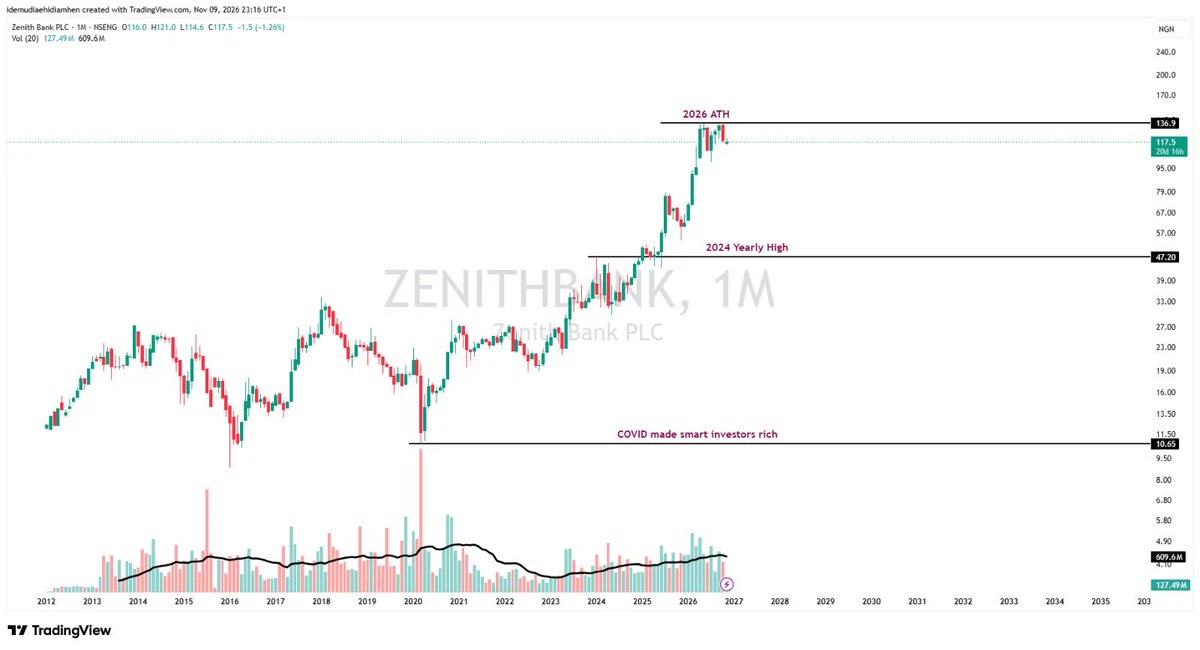
ZENITHBANK
Monthly chart for Zenith in one word: SUBLIME
Read the COVID part and check what price it traded at .
Never put ACCESSCORP and ZENITHBANK in the same statement. Compare their charts from the COVID period to date
#NFA
post-image
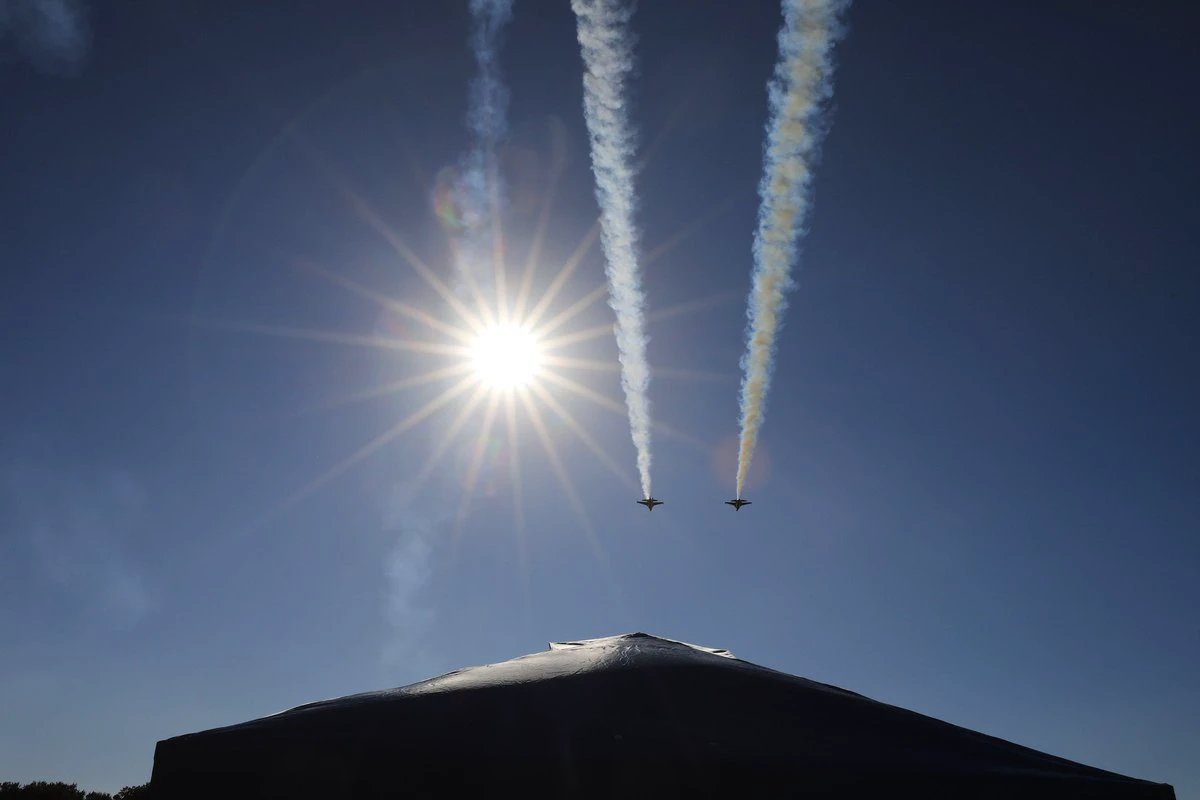
NASA hosts its first aerospace expo in Florida to celebrate America’s 250th anniversary, showcasing new aircraft, lunar plans, and a technology extravaganza featuring the president.
The highlights of space exploration are packaged as a public celebration, while the technical details remain behind the exhibition booths.
$BTC
post-image
BTC-0.67%
Boost Your Rewards With Futures Trading, Hold GT to Share 3,000 GT https://www.gate.com/campaigns/6932?ch=9548&ref=VLARBF1YAG&ref_type=132
post-image
GT-2.24%
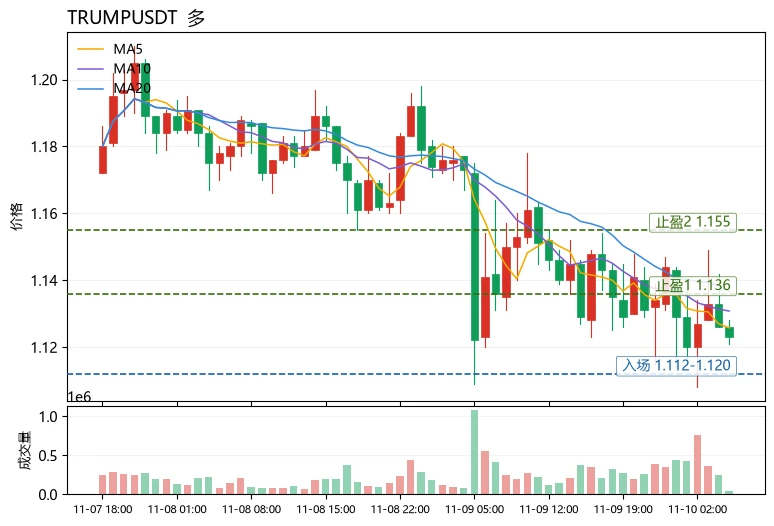
$TRUMP Short-term outlook is bullish, with the funding rate as the key signal. The current price is 1.123, down 3.94% over 24h, while the funding rate is -0.0253%. Shorts are continuously paying to hold their positions, indicating that the decline is driven by both long position reductions and shorts chasing the move, rather than being led by new short positions. The price is above the Bollinger lower band at 1.116. Although MA5 at 1.1258 is below MA20 at 1.1368, the MACD histogram has turned positive, RSI at 41.8 is approaching oversold territory, and the Fear and Greed Index is at 29, in fe
post-image
TRUMP-0.95%
XPL-0.60%
UNI+3.05%
BTC ETH DOGE BTC ETH DOGE
live-cover
LIVE14
$BTW Another opportunity to open a short (sell) trade 📉🚨 Targets 🎯 0.88 and 0.7 Stop loss ❌ 1.35
post-image
BTW-7.42%
Looking at the Zcash chart, we are witnessing a cooling-off period following the strong rally seen since the beginning of 2026. The price has pulled back from its peak of $1,695 and settled into the $1,170 range. The SuperTrend indicator is flashing red at the $1,464 level, signaling a downward trend in the short term.

This is not a collapse that warrants panic, nor is it a situation to be ignored as if everything is perfectly fine. The market is currently seeking a balance—weighing the strong narrative that has persisted since the start of the year against short-term profit-taking and a loss
ZEC+1.29%
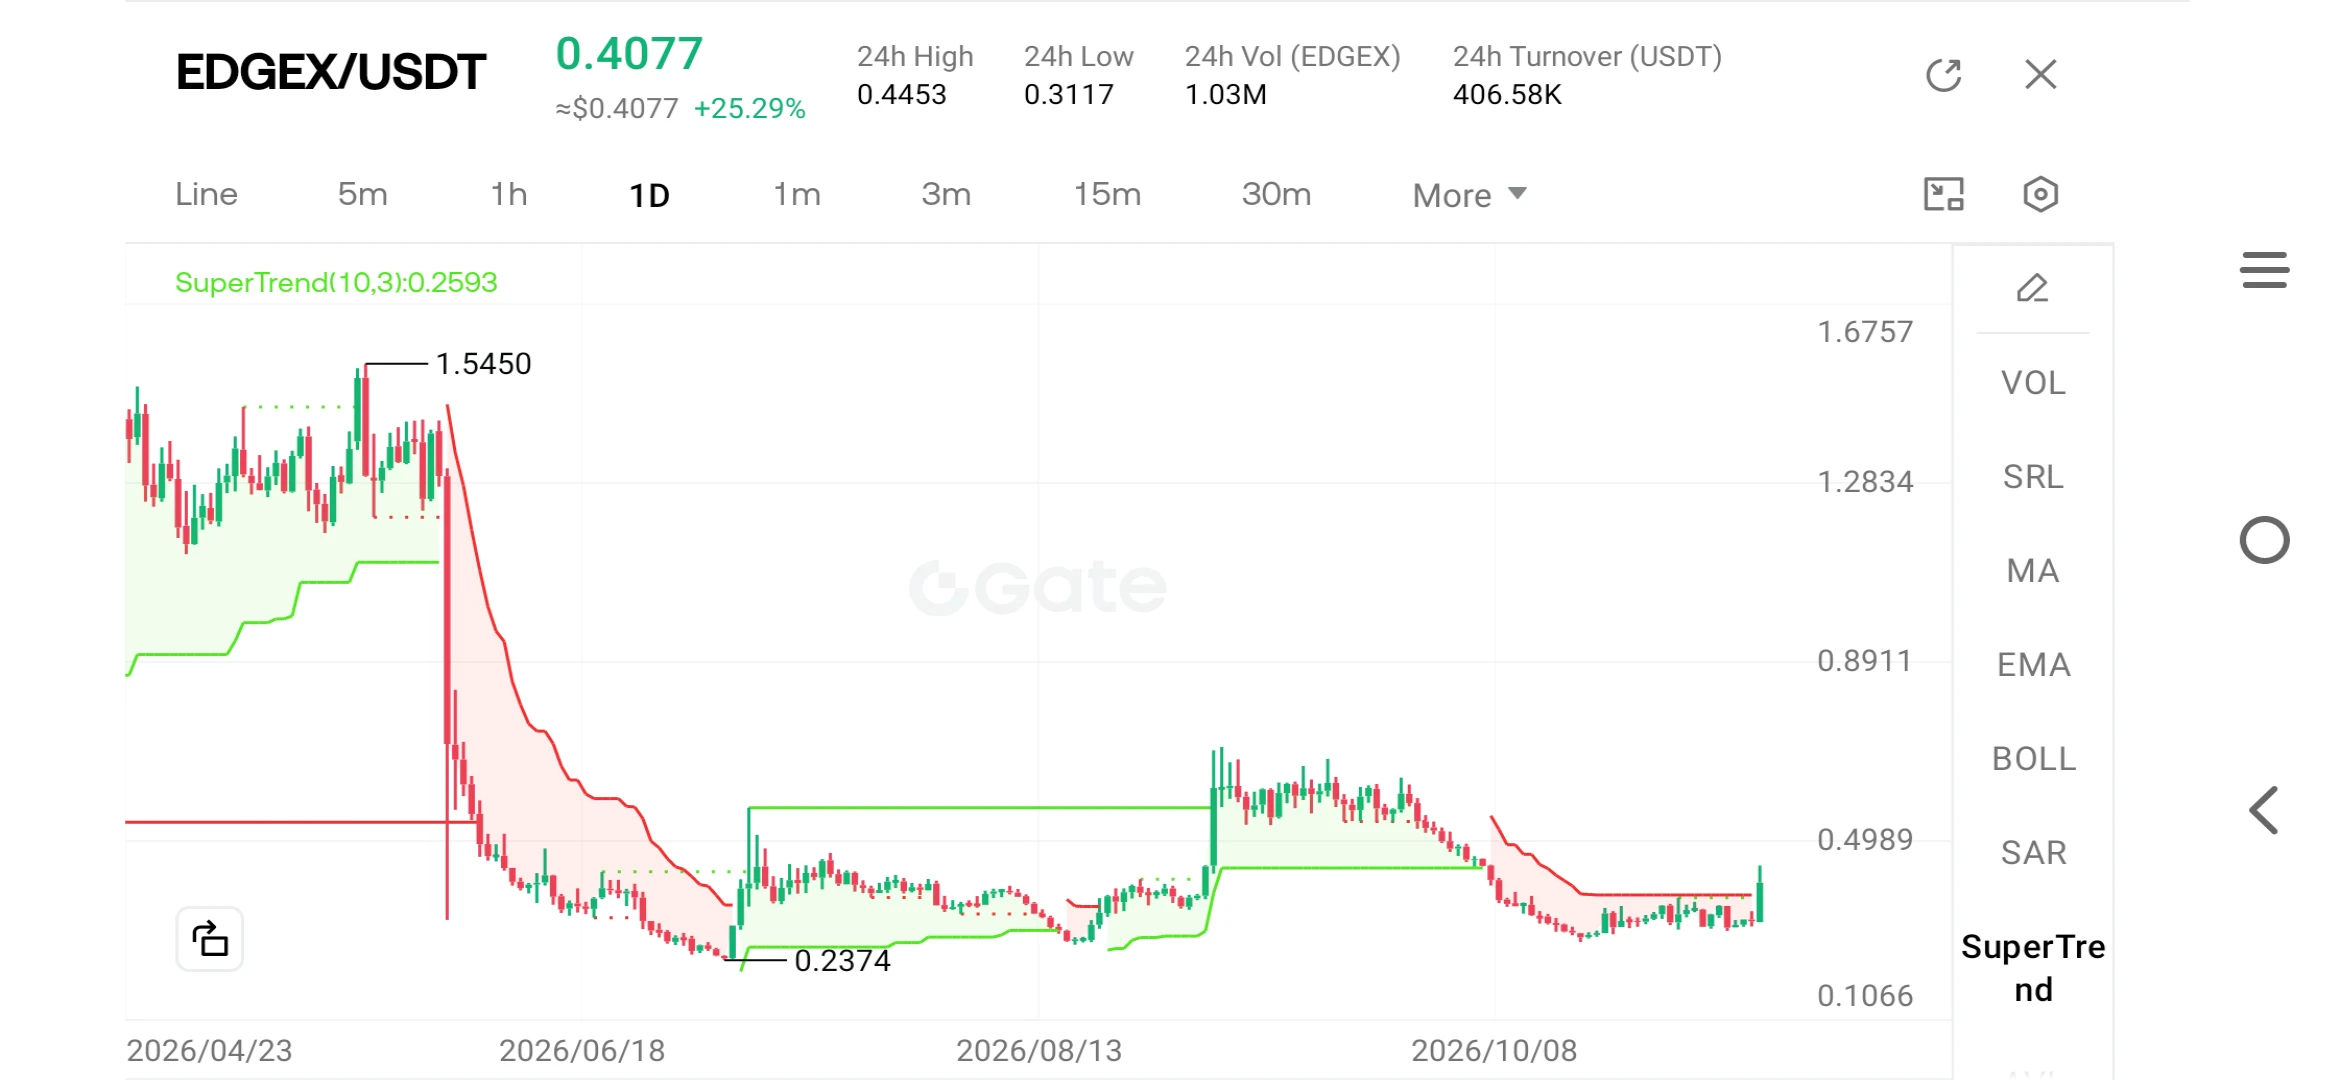
Today’s chart looks exciting at first glance. EDGEX is trading around $0.4077, up 25.29% in 24 hours. The daily range was $0.3117 to $0.4453, and turnover on this venue was about $407K.

But the excitement fades when you zoom out. The peak on the chart was $1.5450 back in the spring. The low was $0.2374. That means price is still about 74% below its high, and about 72% above its low. In other words, today’s move is a bounce inside a large downtrend, not a reversal yet. Treat it that way until it proves otherwise.

SuperTrend on the daily chart appears to have flipped bullish on today’s candle.
post-image
EDGEX+1.20%
BTC-0.67%
ETH-1.26%
SOL-0.77%
XRP-1.15%
“Ghost Stories of Naples”

Refers to the rich folklore, ghost stories, and urban legends of Naples, Napoli, in southern Italy
(whose Chinese name is commonly translated as “Napoli” or “Naples”).
The city has been steeped in mystery since ancient times.
From the Sirens of Greek mythology to medieval ghosts,
underground labyrinths, and the worship of the dead,
it has developed a distinctive tradition of ghost stories.

The most common version of the origin legend
comes from 19th-century writer Matilde Serao:
In the 15th century, a merchant’s daughter fell in love with a commoner.
After her lover
post-image
Crypto Market update
live-cover
LIVE73
GN. Nasdaq +2.7%, S&P +2.3%, best day since April. Bitcoin finished red anyway.
Oil dumped on Iran headlines, VIX back under 20, semis ripped even with NVDA down 4% on the Huang story. BTC couldn't hold 75k and sits near 74.8k, ETH and XRP lost around 5%. Crypto sells with stocks and ignores them on the way up. Same tape as earlier this year.
Tomorrow 8:30 ET is October CPI, 0.3% headline and 0.2% core expected. CoreWeave reports after the close. A December hike is mostly priced already.
Not adding anything until 75k is reclaimed.
#Bitcoin
post-image
SPX+0.33%
BTC-0.67%
ETH-1.26%
XRP-1.15%
NVDA-4.34%
$ACE /USDT SHORT TRADE SETUP: Conflicting Momentum

$ACE /USDT

Direction: SHORT

Entry: 0.119720

Stop Loss: 0.123344

🎯 Targets:
TP1: 0.117002
TP2: 0.115190
TP3: 0.112472

$ACE ‌
ACE-4.27%
If price action can break back into the pattern and get above the yellow 15 minute 200MA.
We look at a likely retest of the yellow 1 hour 200 ma in the second picture.
This is starting to look possible...
Remember, don't chase the trade. Let it come to you.
Stake USDT, GT, or XAUT to earn a share of 36 XAUT

https://www.gate.com/share/act/cf2f3f29
post-image
GT-2.41%
XAUT+0.30%
AI Tech in Focus: Invite Friends to Try Stock Trading and Share $52,000 in NVDAG Rewards https://www.gate.com/campaigns/6931?ch=9522&ref=VLARBF1YAG&ref_type=132&utm_cmp=YrkWJvZl
post-image
NVDAG-0.24%
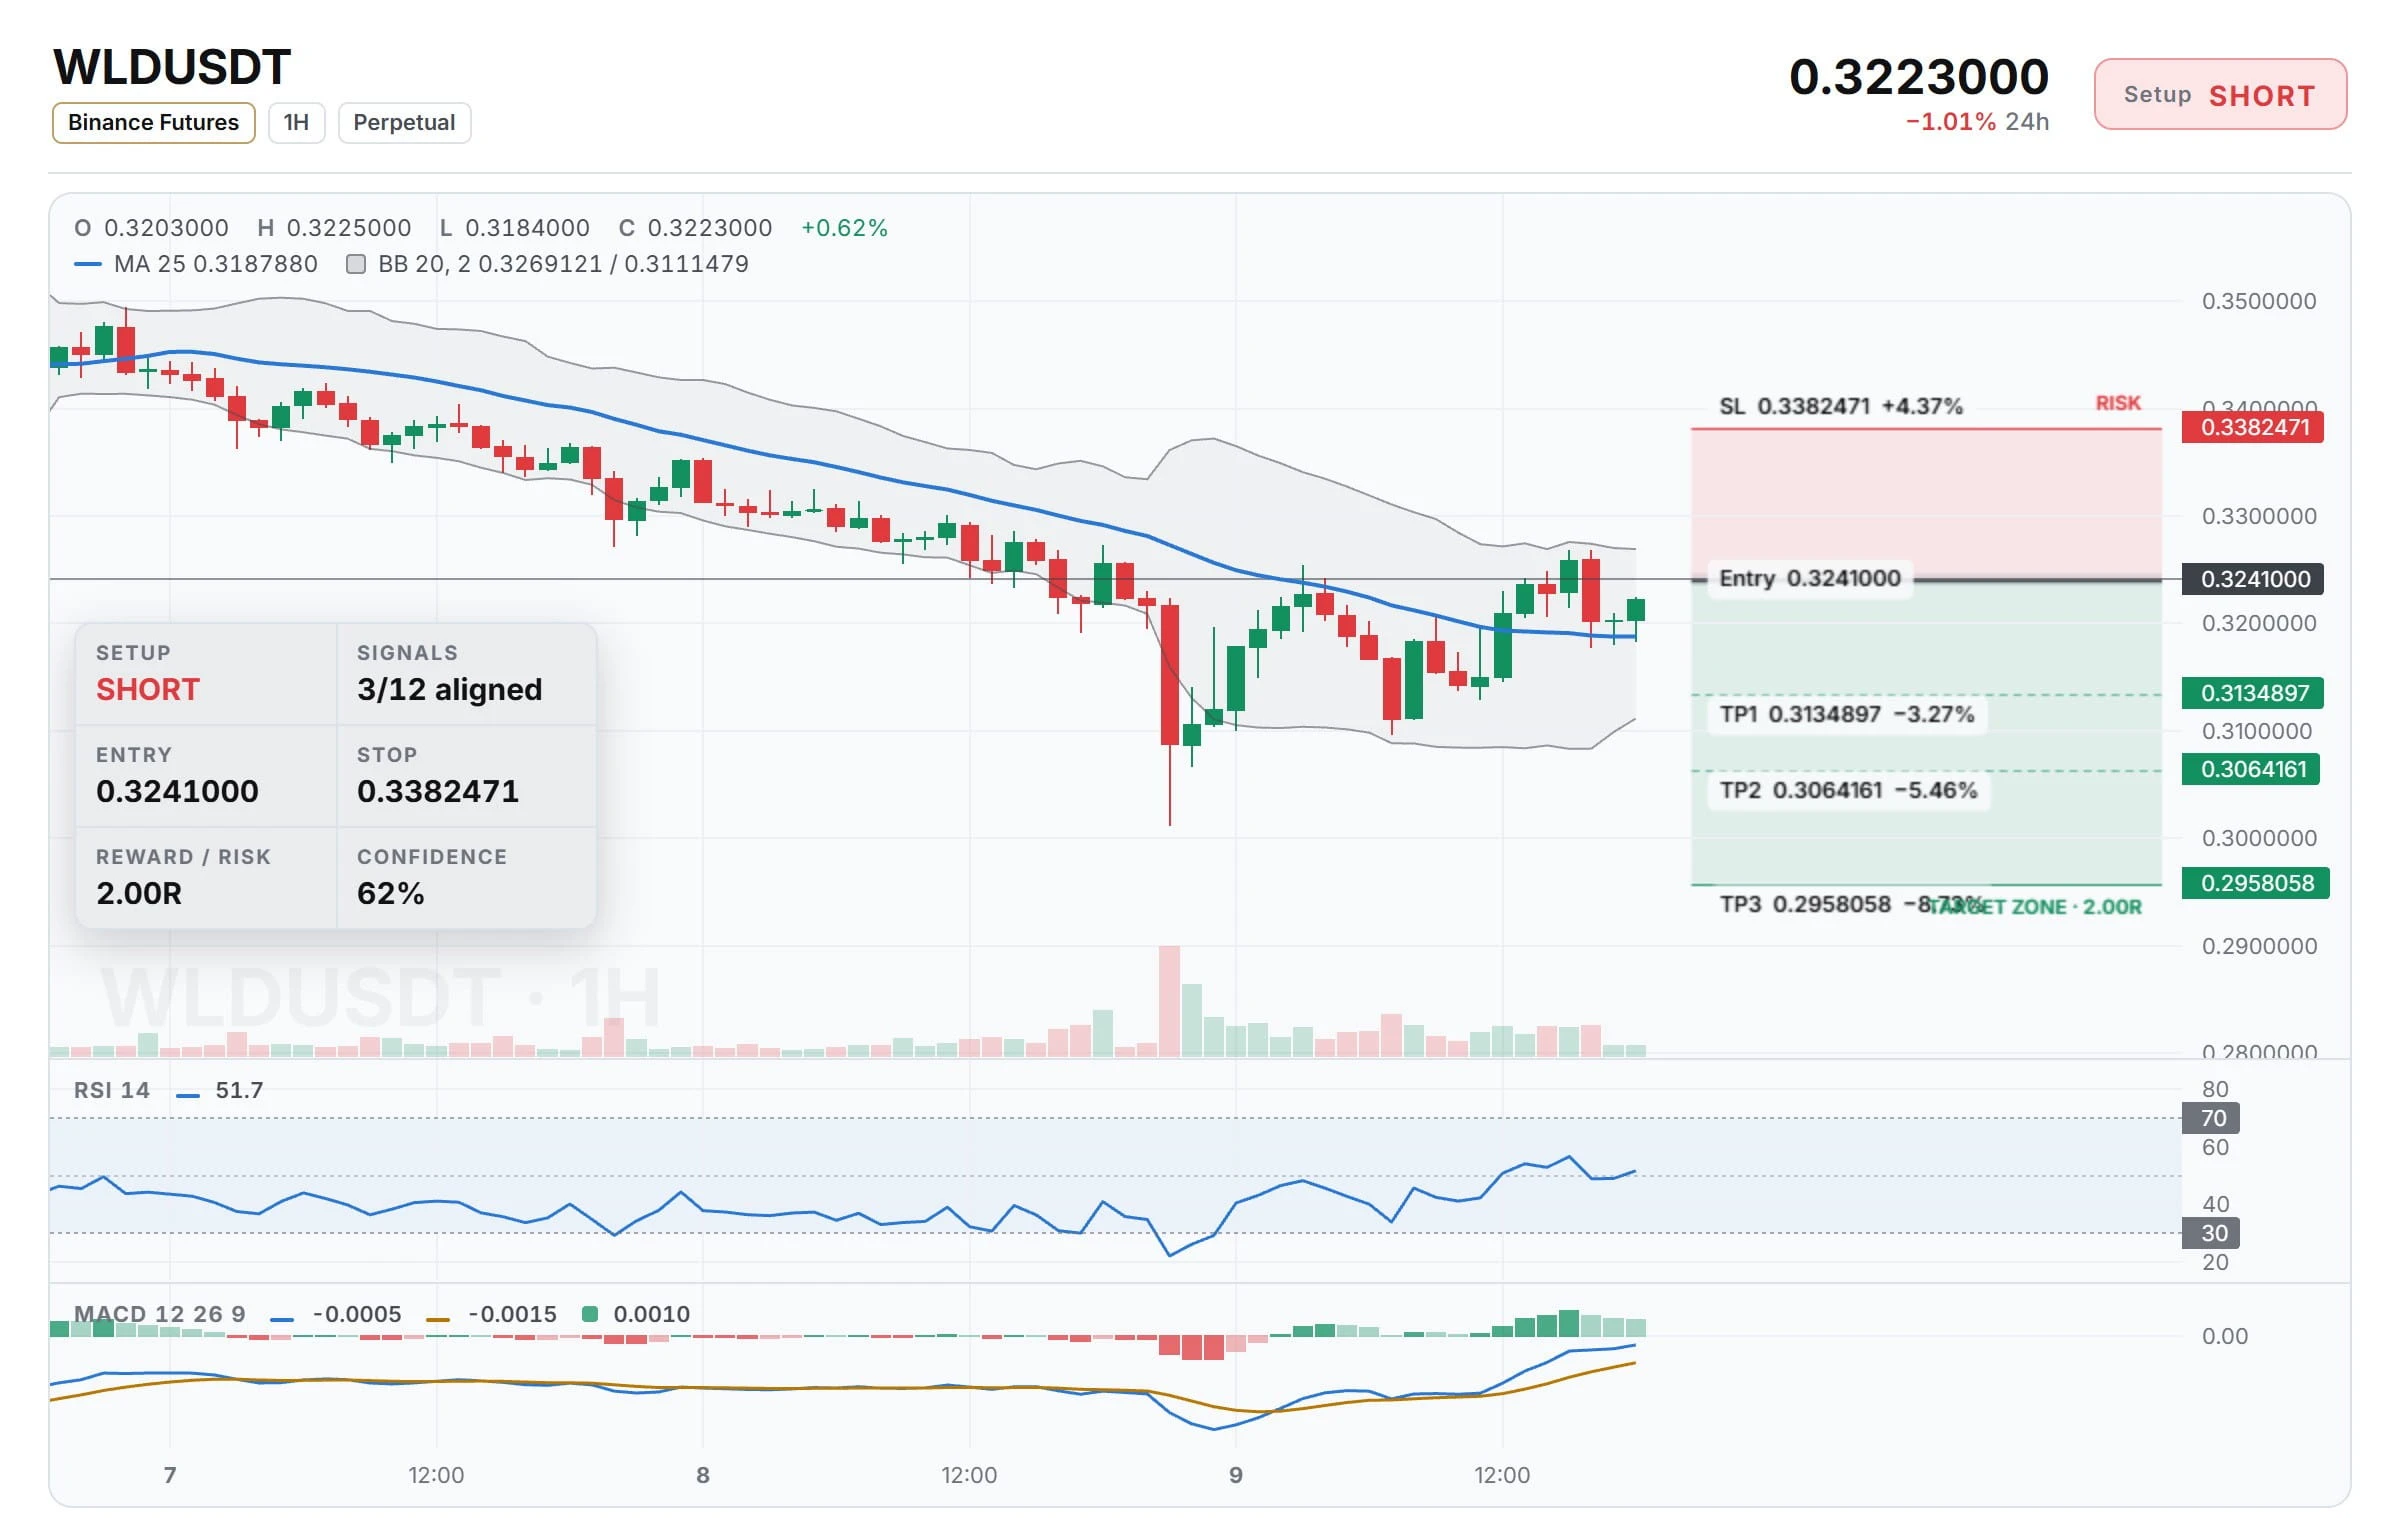
Bulls Are Trapped: $WLD USDT Short Setup Is Ready to Launch

$WLD /USDT

Trade Direction: SHORT
Entry Range: 0.3241000

Take-Profit Targets
🔹 TP1: 0.3134897
🔹 TP2: 0.3064161
🔹 TP3: 0.2958058

🛑 Stop-Loss: 0.3382471

$WLD ‌
post-image
WLD-5.57%
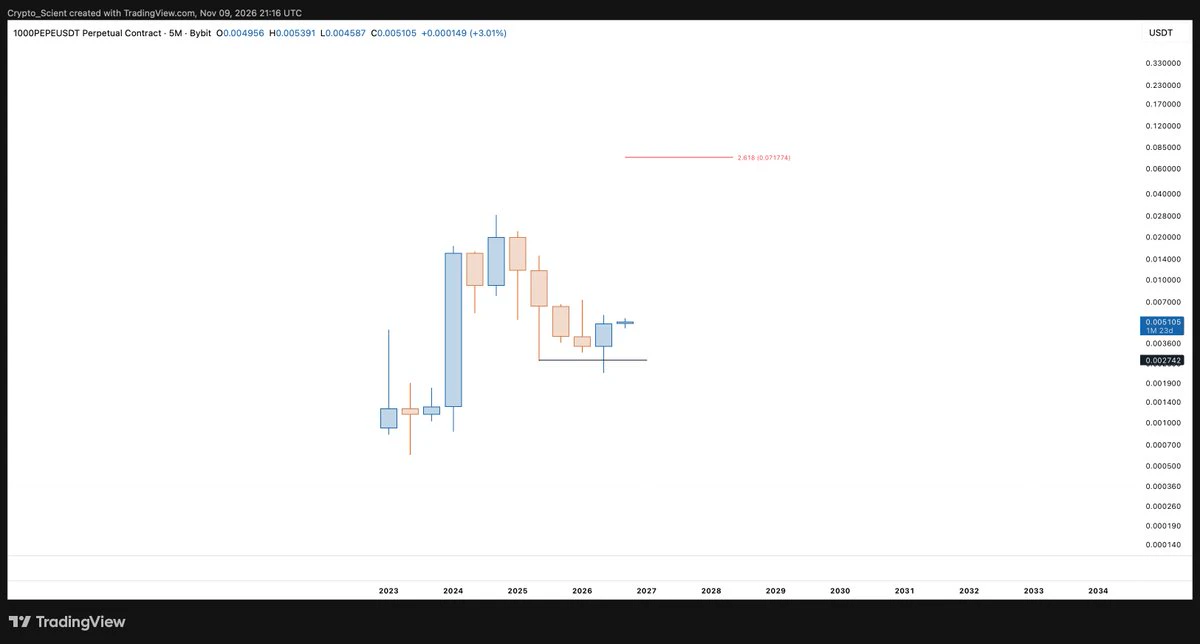
$PEPE , Amidst chaotic charts across the board among altcoins, this one is look very beautiful on macro.
post-image
PEPE+0.97%
Load More

Join 40 M users in our growing community

⚡️ Join 40 M users in the crypto craze discussion

💬 Engage with your favorite top creators

👍 See what interests you

Trending Topics

USCPIDataIncoming

44.86k Views2.04k Discussing

The U.S. October CPI report will be released on November 10 at 8:30 a.m. ET. September CPI came in at 3.7% year over year, and markets will be watching closely for signs that inflation is cooling, especially in core CPI. A softer-than-expected reading could strengthen rate-cut expectations, while hotter inflation may pressure risk assets through higher Treasury yields and a stronger dollar. How do you think this CPI print will move $BTC, U.S. stocks and gold?

RedBullDoublePodiumInBrazil

10.37k Views30.59k Discussing

BTCFlashCrash

229.27k Views66.6k Discussing

View More