Square
Following
Hot
News
Notifications
Profile
Share your thoughts
placeholder
Article
Is BTC suitable for dollar-cost averaging? Use time to invest at a more comfortable pace!

In the cryptocurrency market, many people hope to buy at the lowest point and sell at the highest. But in reality, even experienced investors find it difficult to accurately predict every market turn. Some make a lump-sum purchase and then face a sharp drawdown, while others keep waiting for a lower price and ultimately miss a long-term rally.

So, is BTC actually suitable for dollar-cost averaging?

First, it reduces the difficulty of timing the market. The key feature of dollar-cost averaging is invest
post-image
BTC-0.67%
Every pair is great! If they were on the show, which pair would you be most excited to see?
post-image
Trenches
mihao
m
bade
b
mihao
4Cxj...pump
Market Cap
$.
Change
.
24h Vol
$.
Holders
.
IDOL
I
bade
b
IDOL
0x3b...ab07
Market Cap
$.
Change
.
24h Vol
$.
Holders
.
FOOD
F
bade
b
FOOD
FTu5...pump
Market Cap
$.
Change
.
24h Vol
$.
Holders
.
Sakura
S
bade
b
Sakura
9sFG...pump
Market Cap
$.
Change
.
24h Vol
$.
Holders
.
NIO
N
bade
b
NIO
7SL2...pump
Market Cap
$
Change
.
24h Vol
$.
Holders
.
#ETH and #ETH have fallen for six consecutive weeks, something rarely seen historically. By contrast, the recent decline in U.S. stocks is only the tip of the iceberg overall! If a bear market is coming, #BTC 's decline is unimaginable!
The market's good times are almost over! I've lost more than $2 million recently. Time to get some rest and travel!
ETH-1.26%
BTC-0.67%
BTC Outlook for the Next Year: An Analysis of Three Possible Market Scenarios!

In the cryptocurrency market, many investors want to know in advance how high BTC might rise over the next year. But predicting prices is never simple. Rather than trying to give a definitive target, it is better to analyze several possible scenarios based on different market conditions.

First, the bullish scenario: Continued inflows. If global liquidity conditions improve, institutional funds continue to flow in, and demand keeps growing, BTC may regain upward momentum. In this case, the market could form a new m
post-image
BTC-0.67%
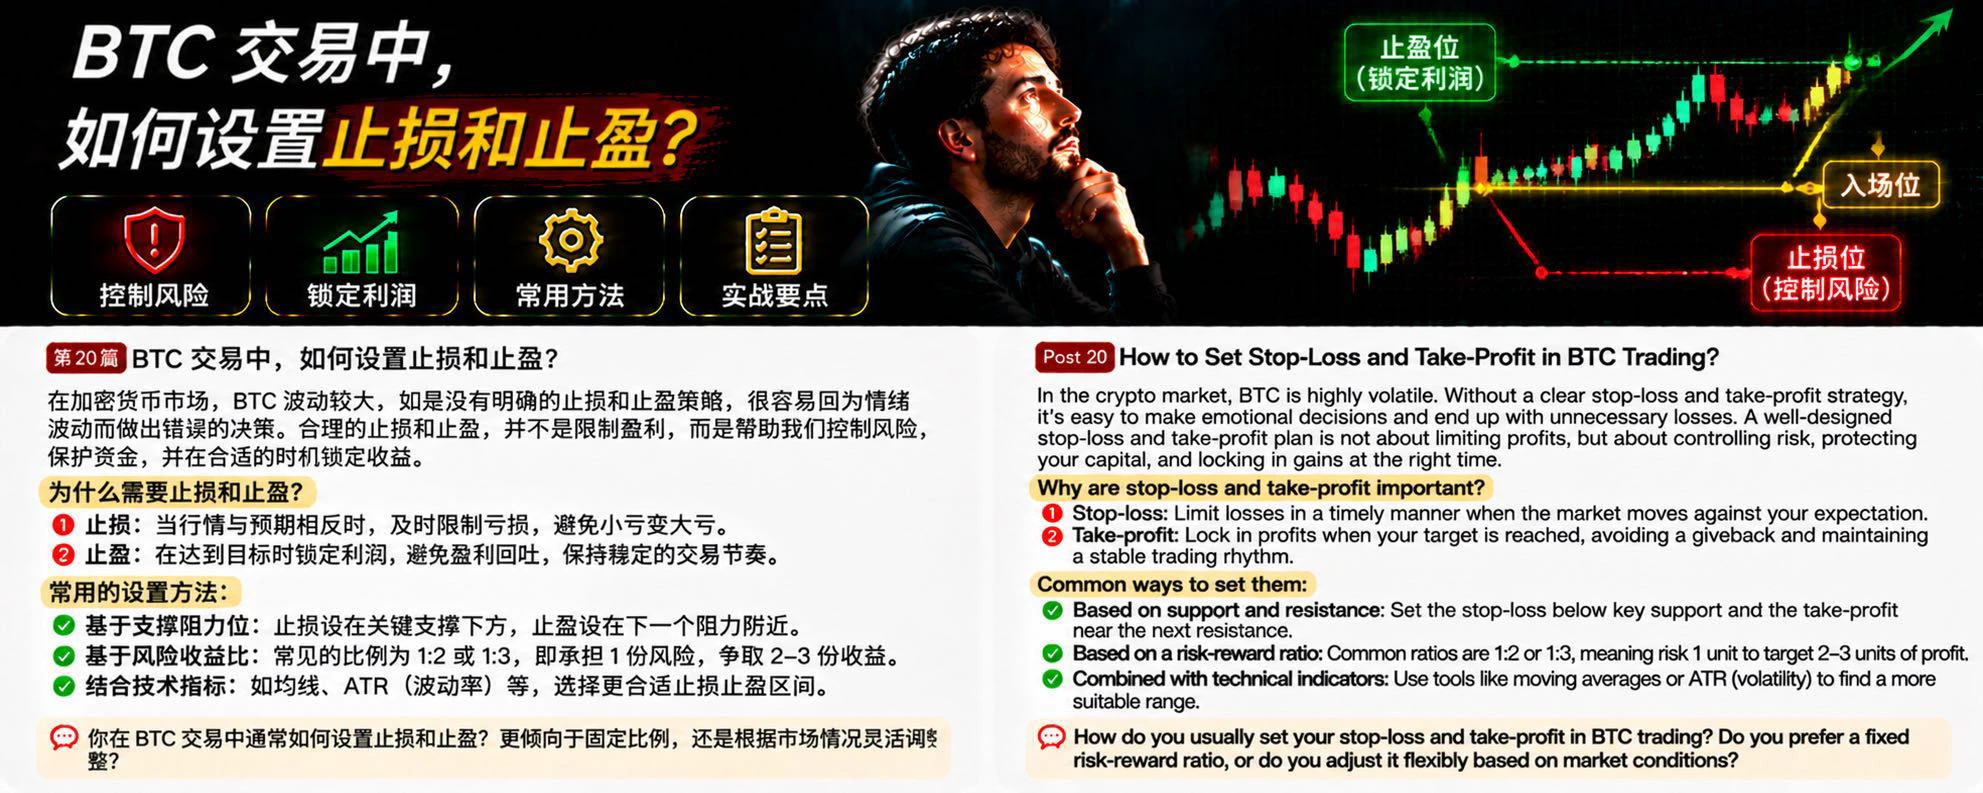
In cryptocurrency trading, many people spend a lot of time studying whether BTC will rise or fall, but overlook a more important question: even if your prediction is correct, without a sound stop-loss and take-profit plan, you may still end up making no money.

Why are stop-losses and take-profits so important?

First, stop-losses are about controlling risk. When the market moves against your view, exiting in time can prevent small losses from growing. This is especially important in futures trading, where leverage amplifies the impact of price fluctuations on your account, so it is crucial to
post-image
BTC-0.65%
In the cryptocurrency market, many traders know some technical analysis methods, yet still repeatedly lose money in choppy markets. The reason may not be that their technical skills are lacking, but that they have failed to identify the current market state.

The biggest difference between trending and choppy markets is how prices move.

First, in a choppy market, prices usually fluctuate repeatedly within a certain range, with resistance above and support below. If you follow a trend-trading approach—going long when you see prices rise and short when you see them fall—you can easily get caugh
post-image
According to Polymarket data, in the prediction market for the “next NVIDIA CEO,” the probability of the “No change” outcome for Jensen Huang rose from 19% earlier today to 29%, putting it in first place. NVIDIA Vice President of High-Performance Computing Ian Buck is in second place with 25%, while CFO Colette Kress is third with 23.3%. Under the rules, “No change” means NVIDIA has not announced an official successor by 11:59 PM EST on December 31, 2028, and interim CEOs do not count. Thus, even if Huang steps down, as long as NVIDIA appoints only an interim CEO by the deadline, this outcome
NVDA-1.92%
BTC, ETH, SOL: Which Could Be the First to Emerge from the Market Trough?
THREE GIANTS, THREE DIFFERENT FUTURES
As the crypto market enters a deep correction, what investors really need to consider is not which asset has fallen the most, but which will be more competitive when capital returns in the next cycle.
First is Bitcoin. BTC remains the core asset of the entire crypto market, with the most mature institutional investment channels, the highest market recognition, and the deepest trading liquidity. When market uncertainty rises, it usually attracts capital more easily than most altcoins.
post-image
BTC-3.45%
ETH-1.26%
SOL-0.77%
filcoin
😂
I'm not shouting anymore
Life has no meaning at all.
post-image
In the cryptocurrency market, many traders see BTC trading volume suddenly surge and assume that the market is about to rise. But sometimes, volume increases significantly while the price fails to rise and instead falls. Why is that?

First, understand that trading volume represents market activity, not simply buying pressure. Every trade has both a buyer and a seller, so increased volume does not necessarily mean the price will rise.

First, rising price with increased volume. If the price continues to rise while volume increases, it indicates that market participation is growing and buyers m
post-image
BTC-0.67%
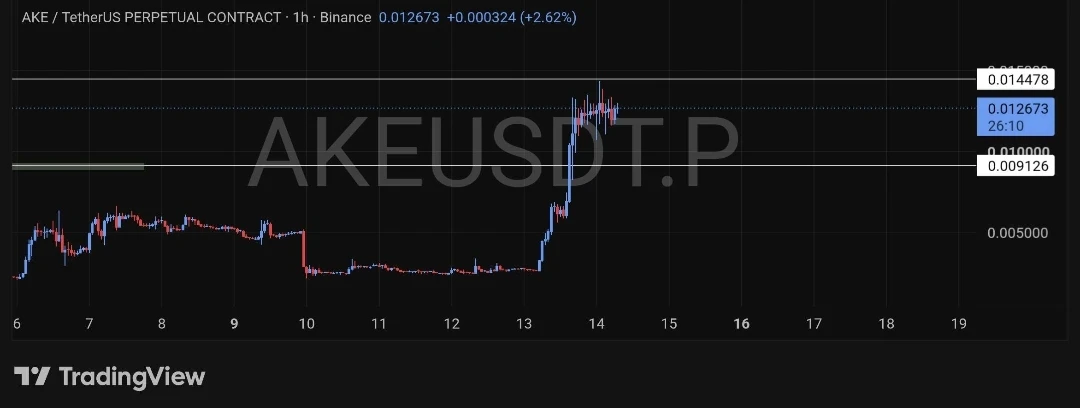
$AKE is maintaining strong bullish momentum on the 1-hour timeframe following a sharp breakout from the $0.0030 region, currently trading around $0.01267. Price is consolidating near its recent highs, suggesting buyers are still holding much of the gains.

The former resistance around $0.009126 is now an important support level to watch. Holding above this area could allow AKE to extend its rally, while the next major resistance sits around $0.014478.

A continued consolidation above the breakout level could set the stage for another push toward $0.014478. However, losing $0.009126 would weake
post-image
AKE+6.39%
Whales Mves in sync!
live-cover
LIVE1,998
Positions have been flushed out, and valuations are reverting to the mean!

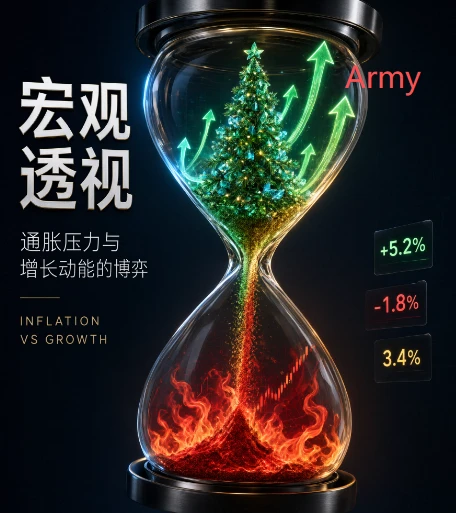
Goldman Sachs and other Wall Street institutions are collectively betting on a year-end rally in U.S. stocks:
Liquidity is flowing back, institutional portfolio rebalancing is wrapping up, and risk appetite is recovering. Historically, the odds have been favorable in the fourth quarter.

But they’re also warning:
Inflationary pressures could flare up again in Q1 next year—
Tariff pass-through, sticky rents, and a wage-price spiral are all laying the groundwork for trouble.

Whether it’s a rebound or a reversal, the mar
post-image
GS+0.31%
  • 2
[New Streamer] Market Prediction
live-cover
LIVE1,853
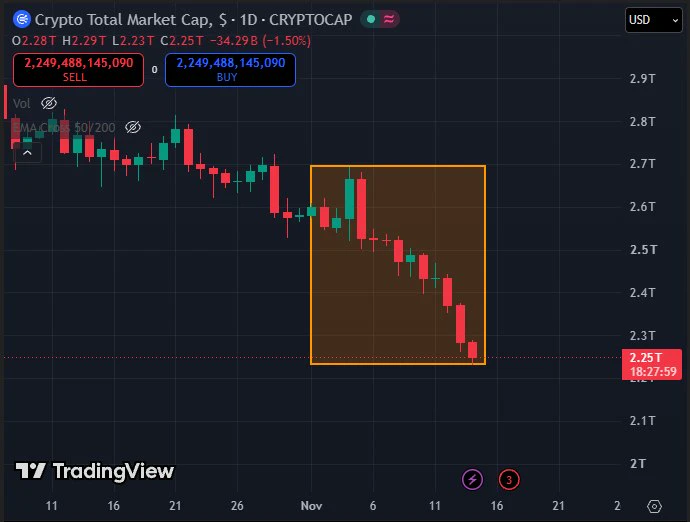
$330B gone from crypto in 2 weeks.
Fear is loud right now.
post-image
$AKT is now live on solana through sunrise, expanding its accessibility across the solana ecosystem.

$AKT $SOL #GATE
post-image
AKT-0.10%
SOL-0.77%
The downside is low returns…
The upside is extremely high risk resilience. After all, it’s been running live for more than two years, and you can see how many times we’ve had these “shitshow” market conditions over that period…
For example, today the broader market is still a “shitshow,” but that doesn’t affect it—its price movements aren’t positively or negatively correlated with BTC.
Lately, I’ve shifted my focus to MT5. It can’t be as complex as standard quantitative strategies, but it makes up for that by being simple and fast enough…
It’s not like there can be no opportunities in all the
BTC-0.67%
  • 3
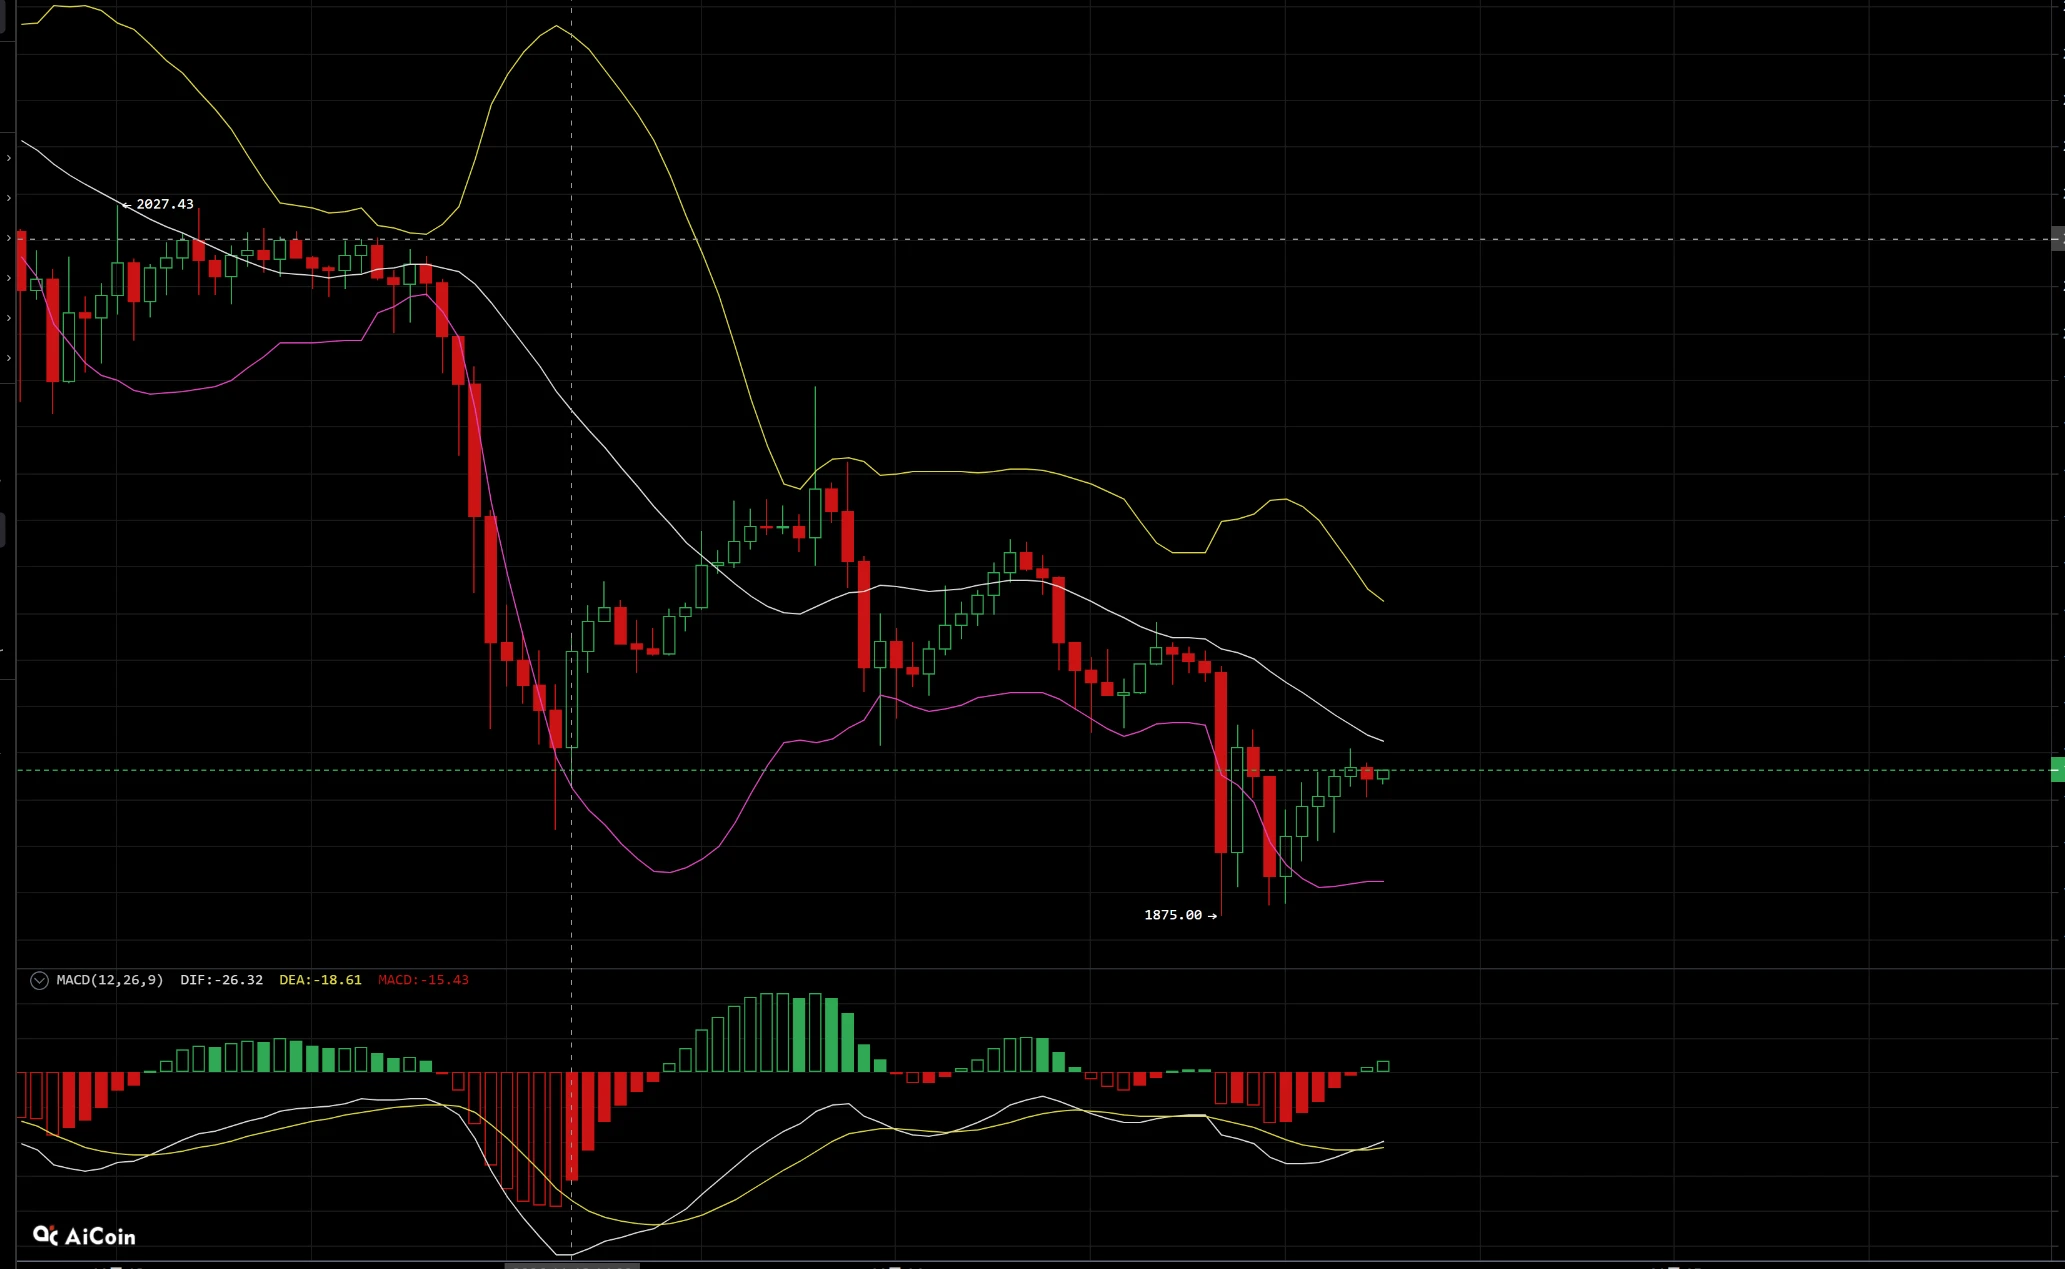
11.14 ETH Trading Setup

ETH is in a downtrend dominated by bears. The Bollinger Bands are opening downward, and the price is trading below the middle band overall. The recent rebound after bottoming at 1875 is a weak recovery within the downtrend. The key resistance is in the 1925-1935 range, where the Bollinger middle band converges with resistance from the previous support breakdown and support-to-resistance flip. Strong resistance is at 1950-1960, corresponding to the Bollinger upper band and the previous rebound high, making this a high-probability area for the rebound to face pressure. T
post-image
ETH-1.23%
Support and resistance levels are among the most basic and practical concepts in technical analysis. Many traders study candlestick charts and indicators every day, yet overlook an important question: at which price levels are buying and selling pressures likely to shift?

First, a support level is an area where buying pressure may increase as the price falls. When the price approaches this level, some buyers may start entering the market, slowing the decline. But a support level does not mean the price definitely won’t break below it.

Second, a resistance level is an area where selling press
BTC-0.67%
Load More

Join 40 M users in our growing community

⚡️ Join 40 M users in the crypto craze discussion

💬 Engage with your favorite top creators

👍 See what interests you

Trending Topics

GateIPOAccessAnthropic

306.9K Views2.8K Discussing

Gate IPO Access Phase 3 features Anthropic (ANT), with USDT subscription interest starting from 100 USDT. Successful allocations will be delivered as real shares to Gate Stock Accounts. Indicative price: $70–$78/share Subscription: Nov 12–17 (UTC+8) Allocation is not guaranteed. Please manage risk accordingly.

Dr.HanOxfordUnionSpeech

147.3K Views587 Discussing

USOctoberPPIBelowExpectations

461.7K Views1.4K Discussing

View More