Share your thoughts
placeholder
Article
$BTC Current price 81288. In the short term, the key levels are the Bollinger lower band at 80896.5 and upper band at 81721.5. MA5 at 81231.8 has crossed below MA20 at 81309, with the moving averages showing a weak bearish alignment.
The Fear & Greed Index stands at 71, remaining in greed territory, but the MACD histogram at -132.4 indicates fading upward momentum. The price is consolidating sideways within the narrow Bollinger channel of 80896.5–81721.5, with the 30-candle range at only about 1.42%, a typical low-volatility accumulation structure. RSI at 57.9 is moderately above neutral and
post-image
BTC-0.04%
GRAM+1.67%
$BTC BTCUSDT 5m - Liquidity sweep at 80902 then higher-low reversal i
Market structure mapping combining break-of-structure, order block identification and liquidity sweep confirmation to frame a short-term reversal.
Context: price rallied strongly from the 81038 open up to a distribution zone near 81820-81915, then reversed sharply into a multi-hour decline that swept liquidity below prior lows near 80902.
Key levels: 81820-81915 acted as a bearish order block and resistance flip; the 80902-81020 zone was a liquidity sweep; 81456-81545 is a prior order block that can act as resistance on a bo
post-image
BTC-0.04%
Nasdaq 100 rebalancing: SpaceX’s weight jumps to 2.82% next Monday, closing the gap between market cap and index placement (ranked ~7th but underweight in the index) $SPX100? $SpaceX
post-image
NAS100+0.81%
SPCX-1.29%
With the same 1000U, whether you enter $AR now or wait for a pullback will lead to completely different outcomes.
Bulls: Up 20.9% in 24h, with 266 million U of real money flowing in. From a low of 3.5660 to a high of 4.9500, the price range was nearly 39%—this is major players accumulating, not retail investors blindly rushing in. AR is not a meme; it represents Arweave’s permanent storage narrative and the essential sector of putting AI training data on-chain. The fundamentals can support it.
Bears: The current price of 4.3620 has already pulled back 12% from the high of 4.95, leaving those
AR+22.46%
#ZEC持续拉升突破1500美元 #Gate广场中秋团圆局 Is Bitcoin Becoming “Ossified”? Behind ZEC’s Surge, Crypto Faces a Soul-Searching Question
Something highly intriguing has happened in crypto recently. As Bitcoin remains range-bound at high levels, privacy-sector asset ZEC has staged a spectacular independent rally, surging sharply in a short period and pushing its market capitalization to around $23 billion, successfully entering the top ten cryptocurrencies by market cap.
Regarding this round of ZEC’s surge, Eli Ben‑Sasson, co-founder of Starknet and a founding scientist of Zcash, offered a highly controversial
ZEC-6.77%
  • 2
$EPIC pulling back into the $0.45–$0.46 support/MA7 zone after today's sharp sell-off.
Momentum is cooling after the rejection at $0.53 — losing $0.45 could weaken the short-term structure further.
Bearish Setup — confirmation required
Entry: $0.447 – $0.452
TP1: $0.425
TP2: $0.400
TP3: $0.385
SL: $0.478
As long as price breaks below $0.45 on a 4H candle without a quick reclaim, this bearish setup stays valid; a reclaim above $0.478 invalidates it.
Short $EPIC
post-image
EPIC+11.58%
EPIC+12.22%
  • 5
  • 1
#GateMeme狂欢季 #GateMeme
#Gate广场中秋团圆局
Token Launchpads — Comparison of PONS, STONK, PUMP, and BONK
I. Basic Overview of the Assets
Token launchpads are permissionless, one-click token issuance infrastructure. Relying on a bonding curve mechanism, they enable token issuance and on-chain trading. Their core business model is to collect transaction fees and capture token value through buybacks and burns.
PONS
The native token launchpad of Robinhood Chain, comparable to Solana’s shturlc, fairly launched in mid-July 2026. It supports one-click deployment of Meme and RWA tokens. Trading fees are al
post-image
ThisIsTranslateContent:
#GateMeme狂欢季 #GateMeme Meme Token Launchpads — Comparison of PONS, STONK, PUMP, and BONK
I. Basic Overview of the Assets
Token launchpads are permissionless, one-click token issuance infrastructure. They rely on bonding curves to facilitate token issuance and on-chain trading. Their core business model is to collect trading fees and capture token value through buybacks and burns.
PONS
The native token launchpad of Robinhood Chain, modeled after Solana’s shturlc, with a fair launch in mid-July 2026. It supports one-click deployment of Meme and RWA tokens. Trading fees are split 70:30, with 70% going to token creators and the remaining 30% allocated to the protocol treasury. Of the protocol treasury’s revenue, 80% is used to buy back and permanently burn PONS through TWAP (time-weighted average price), while 20% is used for operations and development. It is Robinhood Chain’s core traffic-generating application and has cumulatively burned approximately 30% of the total supply.
DefiLlama data: Protocol revenue available for buybacks over the past 30 days was $14.49 million, annualized at approximately ¥176.3M; the current price is 0.71, the circulating supply is 686 million tokens, and the circulating market cap is ¥483.9 million; the buyback payback period is 4.839/1.76295 = 2.74 years.
Meaning: If revenue and the token price remain unchanged, the buyback funds could theoretically purchase all tokens back in 2.74 years.
STONK
A Robinhood Chain token launchpad, fairly launched in August 2026 and competing with PONS on the same chain with differentiated positioning. It focuses on issuing tokenized RWA stock pairs and uses a bonding curve mechanism. 60% of platform fees are used to buy back and burn the token.
Differentiating feature: Token issuers can customize token transfer taxes, with the proceeds distributed directly to holders of that token.
DefiLlama data: Protocol revenue available for buybacks over the past 30 days was $5.69 million, annualized at approximately ¥69.23M; the current price is 0.27, the circulating supply is 838 million tokens, and the circulating market cap is ¥222.2 million; the buyback payback period is 3.22 years.
PUMP
The leading native Meme token launchpad on Solana and a pioneer in the sector. The platform launched in January 2024, and its token had a fair launch in mid-2025. It uses a bonding curve to enable one-click token issuance and built-in trading pools. 50% of the platform’s net revenue is used to buy back and burn the token, creating a complete business loop of “token issuance → curve trading → graduation and migration to its own AMM.”
DefiLlama data: Protocol revenue available for buybacks over the past 30 days was $25.15 million, annualized at approximately ¥305.9917 million; the current price is 0.0043, the circulating supply is 467.85B tokens, and the fully diluted valuation is ¥3.57B; the buyback payback period is 11.66 years.
BONK
A native Solana community Meme coin created at the end of 2022, rather than a pure launchpad project. Its ecosystem matrix includes the BONKfun token launchpad, a TG on-chain trading bot, BONKswap, and multiple other business lines. 50% of ecosystem fees are used to buy back and burn the token. It has exceptionally strong community consensus and more diversified revenue sources, with the launchpad serving only as a sub-business within the ecosystem.
DefiLlama data: Protocol revenue available for buybacks over the past 30 days was $1.74 million, annualized at approximately ¥21.17 million; the current price is 0.0000028, the circulating supply is 87.99 trillion tokens, and the fully diluted valuation is ¥247.62 million; the buyback payback period is 11.68 years.
II. Valuation Differences: The Underlying Logic Behind the Significant Discount of Robinhood Chain Assets
The buyback payback periods calculated above make it clear: PONS (2.74 years) and STONK (3.22 years) on Robinhood Chain are valued far below PUMP (11.66 years) and BONK (11.68 years) in the Solana ecosystem. Although they share the same token launchpad business model of using fees for buybacks and burns, the significant valuation gap clearly stems from differences in market risk premiums.
1. Risk Discount Resulting from the Maturity of the Public-Chain Ecosystem
PUMP and BONK are rooted in the Solana public chain. Their ecosystem has been tested through bull and bear cycles and has accumulated long-term native users, mature market makers, and MEV infrastructure, with high recognition among both retail and institutional investors. The market believes that demand for Meme token issuance will remain sustainable over the long term. Even if revenue fluctuates in the short term, the sector’s foundation will not collapse overnight, so investors are willing to assign a growth premium and accept longer payback periods.
By contrast, PONS and STONK are deployed on Robinhood Chain, a brand-new L2 ecosystem launched only in 2026. The market generally believes that current traffic reflects a short-term pulse driven by platform referrals rather than long-term native users. At the same time, strategic adjustments by Robinhood’s parent company and changes in RWA token regulatory policies could directly impact the entire ecosystem. As a result, the market demands an extremely high margin of safety for Robinhood Chain assets, creating a clear risk discount.
2. Different Project Lifecycles: Short-Term Traffic Dividends vs. a Bull-and-Bear-Tested Moat
PUMP is the sector’s pioneering leader and has completed a full bull-bear cycle. Its brand moat is solid, and it has near-monopoly status in the Solana Meme launchpad sector, making it difficult for new competitors to seize its core traffic. BONK itself is a leading Solana Meme IP. In addition to its launchpad, its TG trading bot provides stable baseline cash flow, while business diversification hedges the risks of relying on a single business.
By contrast, PONS and STONK have been live for only 2–3 months and have not yet undergone a bear-market stress test. Their current high revenue comes from the traffic dividend during the initial launch of Robinhood Chain. Market pricing already reflects the expectation that “revenue will likely decline in the future,” so short-term peak revenue will not simply be extrapolated linearly into long-term cash flow.
3. Differences in Internal Competition and Narrative Optionality
There is direct internal competition within the Robinhood Chain ecosystem. PONS and STONK are competing for creator resources, and new launchpads will enter the market in the future to divide fee revenue. The market expects long-term profit margins to continue being compressed by competition.
At the narrative level, PUMP has growth optionality as a leading sector asset. BONK relies on a top-tier Meme brand IP whose IP itself has independent value and is not entirely dependent on launchpad fees. By contrast, the value of PONS and STONK is almost entirely tied to launchpad fees and buybacks and burns. They currently lack additional sources of narrative premium, so their valuations are determined solely by current cash flow.
III. Reasonable Valuation Ranges for the Token Launchpad Sector (Based on Buyback Payback Periods)
Token launchpads are highly procyclical. Explosive trading volume in bull markets leads to surging revenue, while cooling market sentiment in bear markets causes token issuance demand to approach zero. Therefore, valuation ranges need to be differentiated by ecosystem maturity and cannot simply apply traditional DeFi or stock valuation frameworks:
For assets in emerging ecosystems (Robinhood Chain-type assets, with no bear-market validation and intense same-chain competition), the reasonable steady-state buyback payback period is 3–6 years. PONS is currently at 2.74 years and STONK at 3.22 years, placing them near the lower bound of the range and reflecting bearish market pricing. However, this valuation depends on ecosystem traffic continuing to accumulate. Once enthusiasm fades, declining revenue will directly extend the payback period.
For leading assets in mature public-chain sectors (PUMP-type assets that have experienced bull and bear cycles and possess relatively strong moats), the reasonable steady-state buyback payback period is 8–15 years. PUMP is currently at 11.66 years, within the reasonable valuation range for a mature leader.
For Meme + diversified ecosystem assets (BONK-type assets), the reasonable steady-state buyback payback period is 10–18 years, with the valuation including a brand IP premium. BONK is currently at 11.68 years, toward the lower end of the range.
IV. Opportunities Embedded in the Sector
1. Valuation Recovery Potential from Ecosystem Dividends
The extremely low current buyback payback periods of Robinhood Chain’s PONS and STONK already fully reflect the market’s bearish expectations for a new ecosystem. If Robinhood Chain can continue to accumulate users and its popularity is not merely a one-off pulse, these assets have room for valuation recovery. 2. A Clear Deflationary Flywheel with Auditable On-Chain Data
The sector’s business model is straightforward: revenue comes from trading fees, and cash flow is directly converted into secondary-market buybacks and burns, continuously reducing the circulating token supply. When trading volume rises in a bull market, the burn volume expands accordingly, forming a positive flywheel of “rising trading volume → increased fees → more buybacks and burns → reduced circulating supply.” Fees and burn records are all verifiable on-chain, making fundamental indicators easy to track and validate.
3. Sustained Market Demand in the Sector
Meme coins are a long-term narrative vehicle in the crypto market. Permissionless, one-click token issuance lowers the barrier to launching tokens, and in a bull-market environment, creators’ demand for issuing tokens will persist. The launchpad sector therefore has fundamental long-term market demand.
V. Risk Warnings
1. Short-Term Annualized Revenue Can Create a Major Illusion
The calculation annualizes short-term peak revenue from the past 30 days, which is the sector’s biggest valuation trap. Launchpad revenue depends heavily on market speculation. Once market conditions cool, the number of token launches and trading volume can fall off a cliff, causing annualized revenue to shrink rapidly and instantly invalidating the valuation logic based on low buyback payback periods.
2. Governance Risk in Buyback-and-Burn Rules
The buyback-and-burn ratios of all four projects are governance rules rather than being permanently locked into hard contracts. Community votes can reduce the burn ratio and increase the team’s operations share. Once the value-capture mechanism is modified, the core valuation logic of the token will be undermined.
3. Risk of the Public-Chain Ecosystem Going to Zero
The Robinhood Chain ecosystem relies heavily on traffic from Robinhood’s parent company. If the parent company changes its strategy or regulators introduce policies restricting RWA tokens, traffic throughout the ecosystem could disappear rapidly. By comparison, the Solana ecosystem is more independent and faces relatively lower risk.
4. Persistent Internal Competition Driven by Low Barriers to Entry
The development barrier for token launchpads is relatively low. New protocols can attract token issuers by offering creators a higher revenue share, continuously compressing protocol fee revenue and directly reducing the cash flow available for buybacks and burns.
5. Differentiated Liquidity Risk
PONS and STONK have been live for only a short time and have thin trading depth, so large trades can generate significant slippage. When the market turns bearish, their downside volatility is far greater than that of mature assets such as PUMP and BONK.
repost-content-media
PONS-11.82%
STONK+17.33%
PUMP-1.69%
BONK+1.03%
  • 4
market update
live-cover
LIVE1,482
I will significantly increase my $ETH
position this cycle, mainly for a very simple reason: I believe ETH will outperform BTC this cycle. If BTC doubles, I currently expect ETH to achieve 1.5–2 times BTC’s performance. If RWA truly begins to see large-scale adoption later on, this gap could widen further, and ETH’s upside could potentially exceed 2x. But if another scenario occurs—RWA takes off while BTC’s “digital gold” status is further recognized by the market, causing both directions to rise together—ETH’s advantage over BTC could return to the 1.5–2x range. In addition, judging from the
post-image
ETH+0.27%
BTC-0.06%
RWA+0.96%
𝐒𝐓𝐎𝐏..... 𝐒𝐓𝐎𝐏..... 𝐒𝐓𝐎𝐏 🚨$BT The trap may be closer than you think
Everyone sees 83K and assumes the rebound is finally back. But I’m watching the opposite setup.👀$81 → $85K → 72K → 66K → 60K
$81K — Confidence returns$85K — Breakout euphoria at 72K — “Just a pullback” at 66K — Denial begins at 60K — Maximum panicThe most dangerous move isn’t the drop. It’s the rally that makes everyone believe the drop is over. Stay alert. The next move could “wash out” both sides.⚠️🔔 Open notifications—the next update is critical. BTCBreaks80K BitcoinMarketCapTopsTesla
post-image
#USAIConceptStocksRally
Yes — but the recent move looks more like a high-beta AI/infrastructure rebound than proof of a durable, broad AI bull run.
* The backdrop is supportive: Thursday’s rally saw the Nasdaq gain 1.69%, while semiconductors and AI-infrastructure names led. AP attributed the broader rally partly to lower oil prices and a decline in the 10-year Treasury yield.
* AI demand remains the key fundamental support. Analysts cited by MarketWatch argue that inference, enterprise AI and physical AI could keep infrastructure demand strong, even if some frontier-model developers slow sp
NDAQ+2.44%
ARM+4.07%
AMD+2.76%
NVDA+1.23%
【$G Signal】Long + 1H/4H bullish expansion, snipe near the upper Bollinger Band
$G 4H RSI 82.79, 1H RSI 65.37, bid/ask order book depth ratio 0.71. The 4H MACD histogram is expanding, with 1H expanding in sync. The 1H upper Bollinger Band is 0.0114, while the current price is 0.011224, hugging the upper band. OI is stable, sell orders are suppressing price, and the tolerance for chasing is narrow. The risk/reward ratio is 1.5, with sufficient short-term upside; accept the stop-loss distance before execution.
🎯Direction: Long
⚡Entry/limit order: 0.01119033 - 0.01122400
🛑Stop-loss: 0.01111176
post-image
BTC-0.04%
ETH+0.27%
SOL-2.60%
Starting September 17 and through September 17, 2031, eligible tokenized securities trading venues may, subject to meeting relevant requirements, explore the use of permissioned AMMs and liquidity pools for secondary trading.
The conditions are also quite clear: the relevant tokens must correspond to actual U.S. NMS stocks and provide shareholder rights corresponding to those of traditional stocks. Synthetic exposure, as well as products without actual legal or beneficial rights to the underlying stocks, does not fall within this exemption.
I think what is truly worth watching this time is tha
post-image
After surging to around 81900 last night, Bitcoin was hit by a rebound from the bears, but quickly halted its pullback near 80800 in the early hours, indicating strong buying support below. The price has now returned to around 81200. Structurally, yesterday’s pullback after the rally did not break key support, and the 80800 level has formed the preliminary shape of a short-term double bottom. The retracement was also limited, constituting a healthy correction within a strong market.
On the moving-average system, short-term moving averages are beginning to turn upward, with the price reclaiming
post-image
BTC-0.04%
Bitcoin and Ethereum remained strongly bullish on Saturday. Fortunately, after seeing a bit of hope, they moved down to the expected level, with the peak closing at 1100+54 points.
$BTC $ETH
ChenMingyuan_guanjin
Good evening, September 19! Bitcoin's intraday bullish-candle sentiment was relatively strong, rising to 81740 before beginning to slowly decline; it is currently trading around 81300.
Saturday night
If it rebounds to around 81500-81900, short, targeting
around 80700-79500.
If it rebounds to around 2650-2670, short, targeting
around 2610-2570.
$BTC $ETH
BTC-0.06%
ETH+7.79%
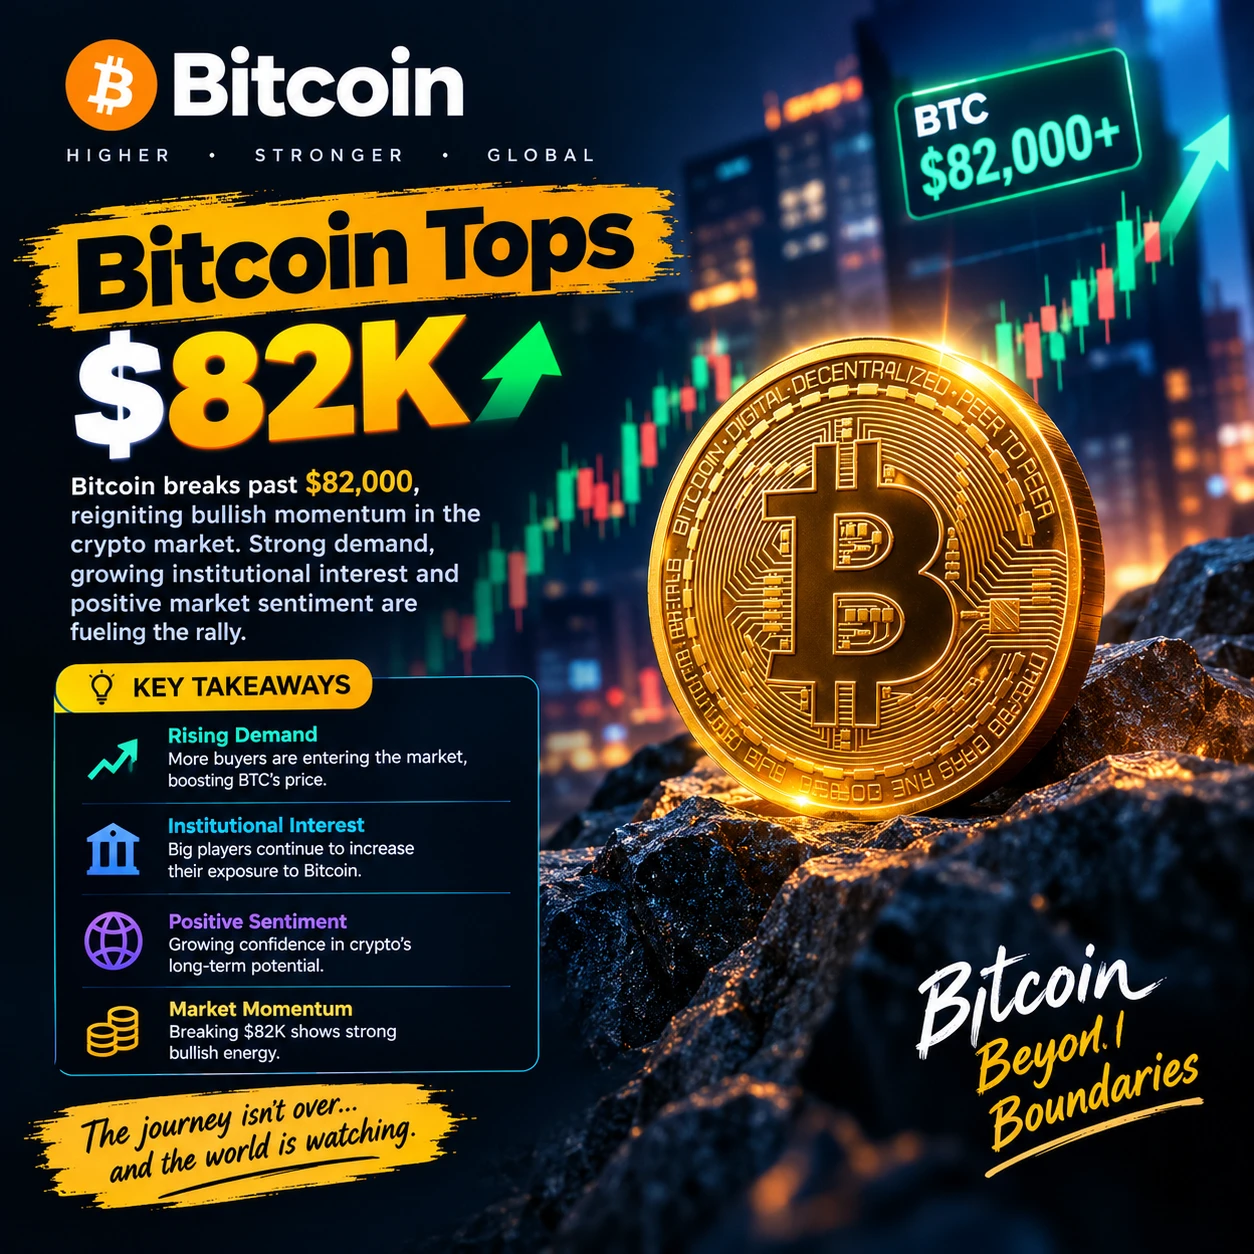
🔹 Bitcoins market capitalization surpasses Teslas, returning it to the top 15 globally.
live-cover
LIVE1,485
I had already finished complaining to my friends about this week’s market, but now I have to take it all back—pretty awkward. A few days ago, before bed, I saw that $SKYAI lacked buying support; every push upward fell just short, clearly showing a weak rebound.
We simply held the short from 0.06198 to 0.05078, delivering +443.11%—that’s the answer. Nailed the rhythm, and it feels great.
Panic comes from having no plan; losses come from overthinking.
The market specializes in humbling all kinds of overconfidence, especially those who think they’re the smartest.
Take most of it off the table fi
post-image
SKYAI+0.24%
BNB-0.07%
ETH+0.35%
Technically, the weekly chart closed bullish and broke out of the range-bound downtrend, with the bullish trend in control and upward momentum. After the strong short-term rally, a pullback is likely, but the correction should be weak and limited in scope, representing a pause in the uptrend rather than a reversal. Overall, the market is shifting toward a bullish trend.
Continue to follow the bullish rhythm. Prioritize opening long positions after the price pulls back to key support and stabilizes, manage risk based on support, and hold through the upward swing.
btc: Go long near 81000-80500 o
post-image
BTC-0.06%
ETH+0.27%
September 18: The policy rate was raised by 25 basis points from 1% to 1.25%, directly reaching its highest level in 31 years since 1995, with a 7–2 vote.
But interestingly—the rate was raised, yet the yen fell.
The market had already priced in this rate hike. What truly made traders nervous was whether further hikes would follow and exactly how fast the pace would be. Two policymakers voted against the hike, also cooling market expectations for subsequent tightening.
This is no small matter for the crypto market either.
Japan has long been an important source of low-cost financing globally. A
BTC-0.06%
Nobody is talking about XRP's hidden weakness right now.

$XRP /USDT - SHORT

Trade Plan:
Entry: 1.4063 – 1.4145
SL: 1.4495
TP1: 1.3810
TP2: 1.3615
TP3: 1.3321

Why this setup?
Why now? The daily trend is range, which means XRP has been trapped in a tight band, and a breakout is overdue. The 1h ATR is 0.016307, showing that volatility is finally expanding enough to fuel a directional move. The 15m RSI sits at 42.09, confirming bearish momentum without being oversold yet. We are targeting TP1 at 1.3810 and TP2 at 1.3615 from an entry zone of 1.4104, with invalidation at 1.3794 acting as the
XRP-0.11%
Load More

Join 40 M users in our growing community

⚡️ Join 40 M users in the crypto craze discussion

💬 Engage with your favorite top creators

👍 See what interests you

Trending Topics

JapanRealEstatePowerChipStocksRise

59.91k Views4.58k Discussing

Japan's Nikkei extended gains on Sept 18, with real estate, power, and semiconductor sectors leading. Gate covers over 12,800 global stocks and ETFs, offering one-stop USDT trading across US, HK, Korean, and Japanese markets. [👉 Read more](https://www.odaily.news/en/newsflash/518749)

USAIConceptStocksRally

34.62k Views1.04k Discussing

GateTopsStockPerpetualCoverage

39.14k Views2.62k Discussing

View More