



Square
Following
Hot
News
Notifications
Profile
Share your thoughts
placeholder
Article
Michael Saylor Reveals 400-Year History Behind Bitcoin Earnings
Michael Saylor traced the financing model for holding bitcoin through Strategy’s dividend-paying stock back to four centuries of financial history. His analysis linked Dutch trading companies, railroad financing, and U.S. tax law to the company’s Stretch securities.
In an analysis dated November 7, Michael Saylor, founder and executive chairman of Strategy Inc. (Nasdaq: MSTR), linked the company’s yield-bearing securities to four centuries of financial history. He described Stretch, Strategy’s variable-rate preferred stock trading
post-image
BTC-0.67%
MSTR-0.30%
STRC+0.34%
$UAI Entered at 0.12 with 100U and made over 100, then I didn’t check for a few minutes and got blown up for 400U
post-image
UAI-7.58%
Trenches
ZIG
Z
bade
b
ZIG
0x8c...1145
Market Cap
$.
Change
.
24h Vol
$.
Holders
.
STONK
S
bade
b
STONK
6GmA...UNgx
Market Cap
$.
Change
.
24h Vol
$.
Holders
.
IDOL
I
bade
b
IDOL
0x3b...ab07
Market Cap
$.
Change
.
24h Vol
$.
Holders
.
FLOAT
F
bade
b
FLOAT
Bv1a...BMmr
Market Cap
$.
Change
.
24h Vol
$.
Holders
.
BTC
B
bade
b
BTC
C5xp...pump
Market Cap
$.
Change
.
24h Vol
$.
Holders
.
#ARB

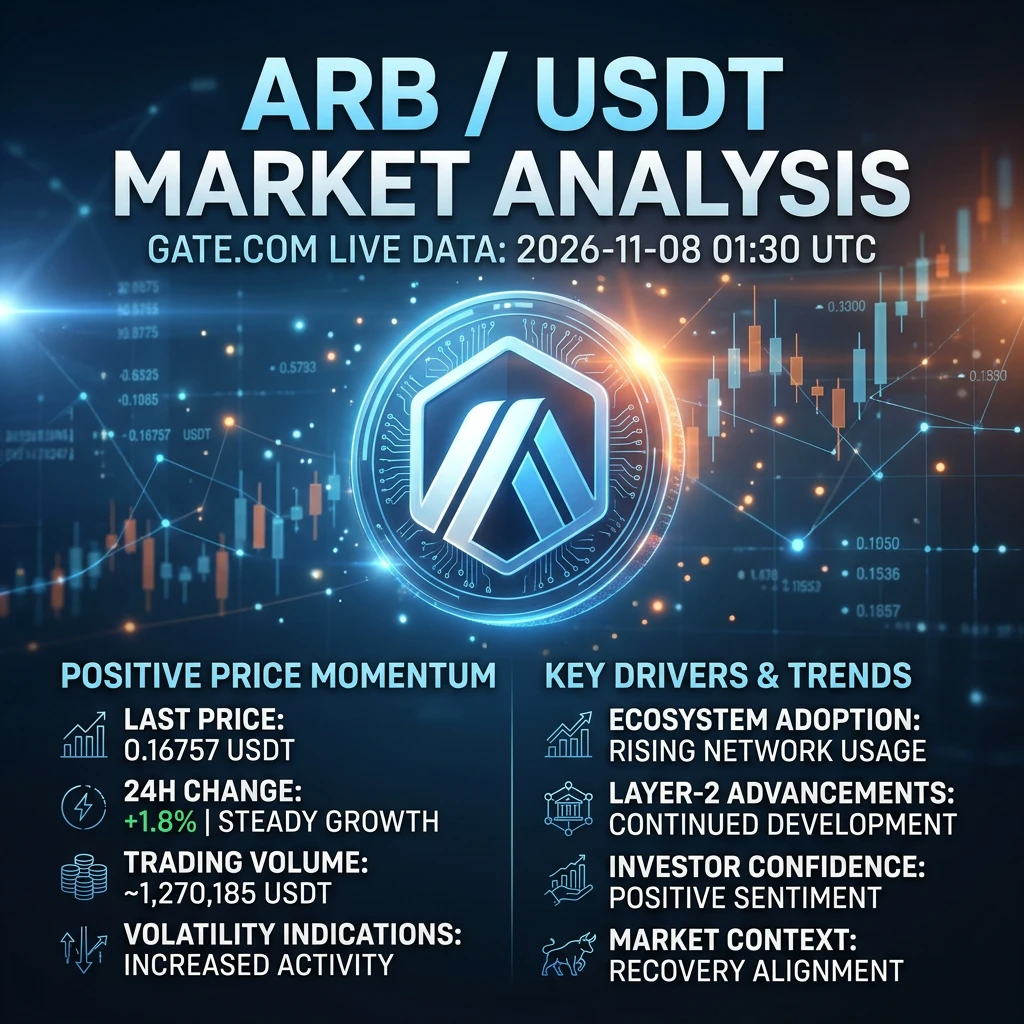
ARB Rises 1.8%: A Small Recovery, but the Bigger Story Is Token Supply

The Market Has Turned Slightly Positive

Arbitrum's ARB token is showing a modest recovery, with its price reaching $0.16757 and gaining 1.8% over the previous 24 hours. Trading volume during the same period was approximately $1.27 million USDT.

The move puts ARB in positive territory for the day. However, a single 24-hour increase does not establish a lasting recovery. The more important question is whether the market can maintain interest in the token beyond this short-term move.

MYTH 1: A Green Price Means a St
post-image
ARB+1.17%
$BTC LONG SETUP — BIG REBOUND AHEAD?

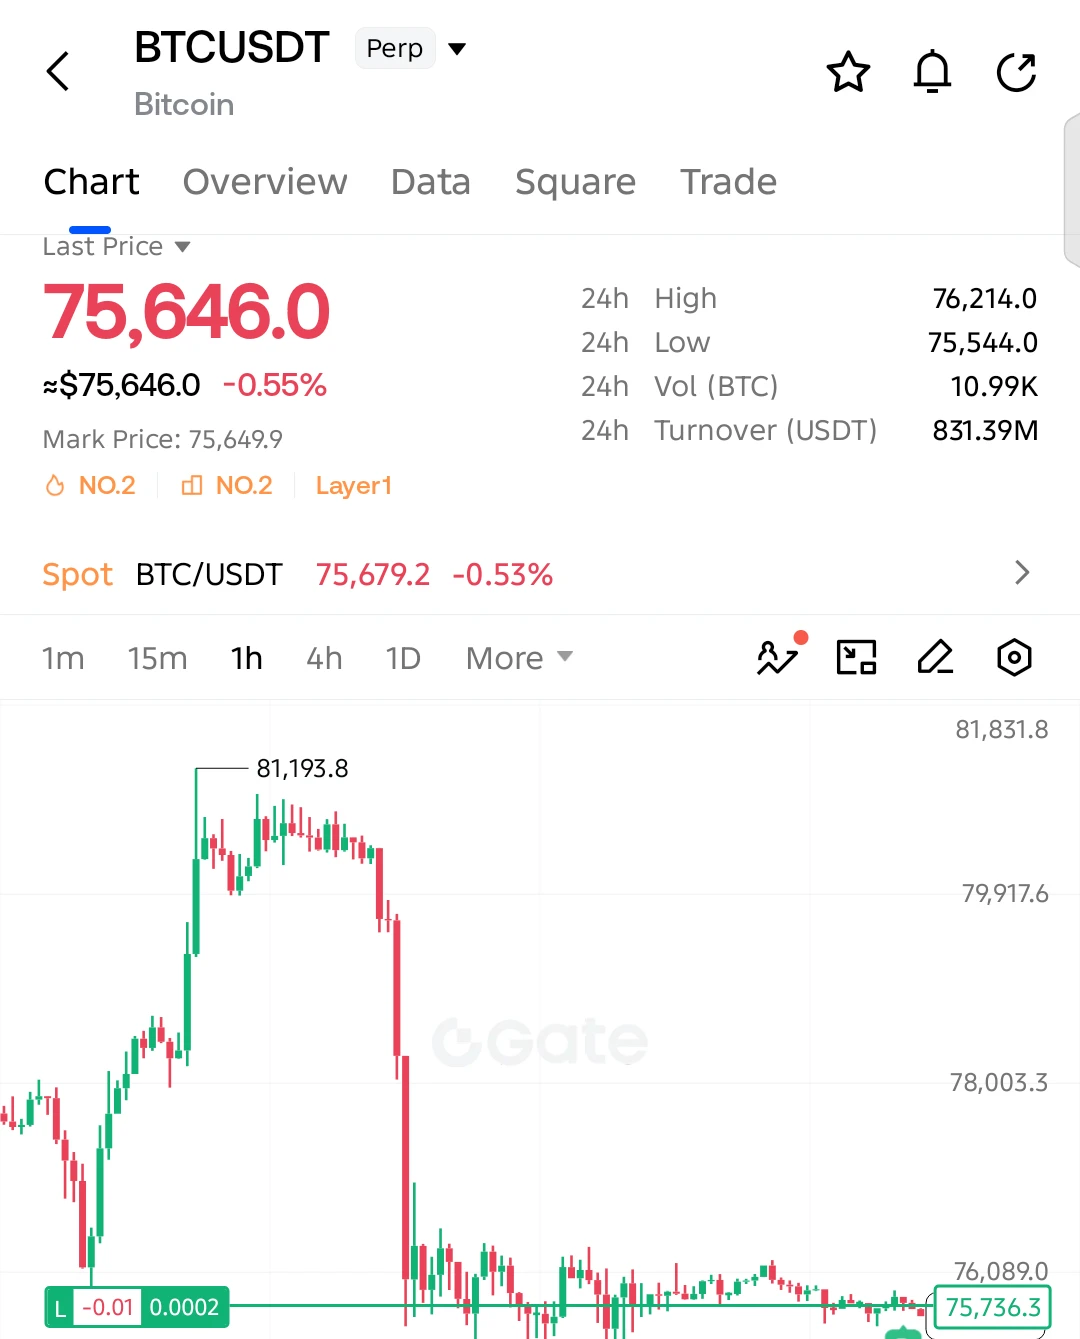
$BTC is holding near the 75,500 support zone after a massive sell-off. Buyers are defending this area, and a recovery could be developing!

Entry: 75,646
SL: 75,320

TP1: 76,090
TP2: 76,214
TP3: 76,800
Final Target: 78,000

Bitcoin is consolidating after its sharp decline from 81,193. The 75,500 area remains crucial for buyers. If this support holds and BTC reclaims 76,214, a stronger recovery toward 76,800–78,000 could follow.

Invalidation: A sustained break below 75,320 invalidates the bullish setup.

Keep your eyes on $BTC!
post-image
BTC-0.67%
🚀🚀🚀$BTC ‌$GT ‌$ETH ‌#CPI数据前瞻
post-image
BTC-0.65%
GT-2.24%
ETH-1.23%
  • 4
Crypto Market update
live-cover
LIVE623
#PIEVERSE

Worked for 7s

PIEVERSE at $1.4049: Is a Nearly Flat Market Hiding a Bigger Supply Risk?

Imagine watching PIEVERSE throughout the day. The price moves slightly higher, trading activity continues, but there is no strong breakout or sudden change in market direction. Should traders interpret this as strength, or is the market simply waiting for its next major catalyst? That is the important question behind PIEVERSE's latest price action.

What Is the Market Showing?

At 01:30 UTC on November 8, 2026, PIEVERSE/USDT was trading at $1.4049, recording a modest 0.1% increase over the pre
PIEVERSE+0.58%
  • 1
Traders should remain cautious and watch BTC support and resistance levels.
live-cover
LIVE114
#USAIStocksHitHard
The AI trade just took a brutal beating.
What started as a post-midterm rally evaporated in a single session. On Thursday, November 5, 2026, the Nasdaq Composite plunged 5.5% — its worst day since the tariff shock of April 2025. The S&P 500 dropped 4.4%. Roughly $2.5 trillion was wiped from the Nasdaq 100 alone. Across the broader U.S. equity market, the damage from the recent peak has reached approximately $5.7 trillion.

This was not a broad market correction. It was a targeted assault on the AI complex.

**The damage report:**
- Nvidia (NVDA): −9.3% on the day, finishing
  • 1
Whale sell-off: the end of stock meme coins?
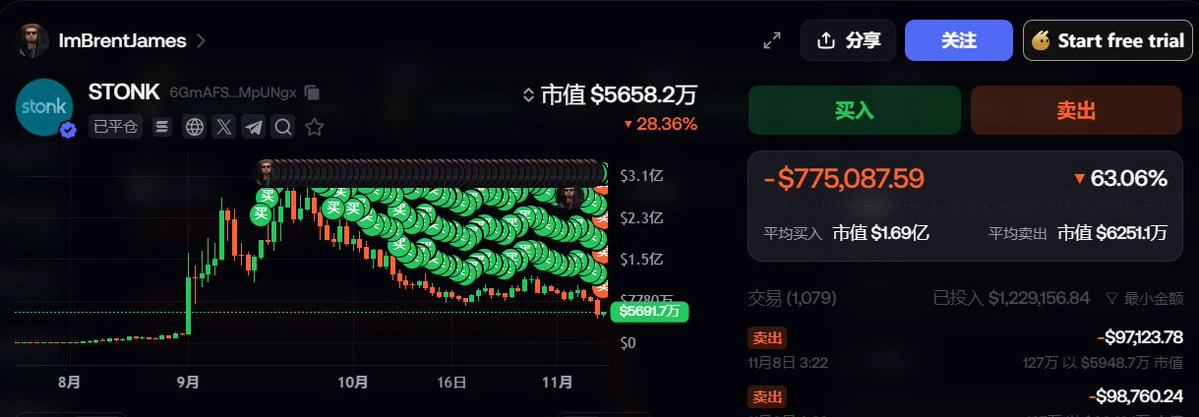
Solana stock meme launchpad STONK plunged more than 30% overnight
STONK whale @ImBrentJames, who has 12,000 followers on fomo, sold all their STONK, losing $775,000
ImBrentJames initially spent $1,229,000 buying at an average market cap of $169 million, but ultimately sold everything at a 63% loss
On the one hand, stock meme coins have cooled off, and both STONK and PONS are struggling, with buyback amounts dropping sharply
On the other hand, new players are emerging in the Solana Launchpad sector amid fierce competition, and some traders are shifti
post-image
MEME-0.94%
SOL-0.77%
STONK+11.55%
PONS+4.32%
🌈 #GateLiveStreamingInspiration -November 8

Go live with the following topics now to receive extra official support and promotional exposure!Today's Topic Recommendations:
🔹 Vitalik Buterin says the donation of SHIB worth hundreds of millions of dollars exceeded expectations
🔹 Bitcoin needs no banks, yet Strategy aims to become a Bitcoin bank
🔹 Former FBI agent pleads guilty to stealing $2.47 million in cryptocurrency, facing up to 20 years in prison
🔹 Cyber has repurchased approximately $13 million worth of CYBER tokens over the past year
🔹 Bitcoin ETFs saw a net outflow of $412 millio
GateLive
🌈 #GateLiveStreamingInspiration -November 8

Go live with the following topics now to receive extra official support and promotional exposure!Today's Topic Recommendations:
🔹 Vitalik Buterin says the donation of SHIB worth hundreds of millions of dollars exceeded expectations
🔹 Bitcoin needs no banks, yet Strategy aims to become a Bitcoin bank
🔹 Former FBI agent pleads guilty to stealing $2.47 million in cryptocurrency, facing up to 20 years in prison
🔹 Cyber has repurchased approximately $13 million worth of CYBER tokens over the past year
🔹 Bitcoin ETFs saw a net outflow of $412 million, with BlackRock’s IBIT posting a net outflow of $403 million
🔹 Prediction markets assign a 52% probability that Bitcoin will rise to $70,000 by the end of 2026
🔹 Gnosis Pay reports unauthorized access to its card system, resulting in customer data leakage
🔹 The SEC’s proposed rules for crypto broker-dealers have been submitted to the White House for review, covering four securities rules
Choose any topic to start a live stream, and you'll have a chance to be featured on the official website's homepage!
🔥 Start streaming now: https://www.gate.com/live/apply

repost-content-media
SHIB-1.28%
BTC-0.67%
CYBER-5.40%
IBIT-0.30%
GNO-1.28%
  • 2
$ZEC I caught the falling knife at 1241, and my hands are still shaking.
Let’s start with the data—no need to comfort me yet. ZEC is currently at 1241.52, down 8.06% over 24h, with an intraday high of 1355.45 and low of 1235.21. Trading volume is 1.349 billion—it hasn’t contracted, which means panic selling is still underway. I reviewed ZEC’s price action across the past three halving cycles: after the first halving, a roughly -12% shakeout came on day 18; after the second, it was -9.8% on day 22; after the third, -8.5% on day 15. Today is exactly day 16 after this halving, with a decline of 8
ZEC+1.16%
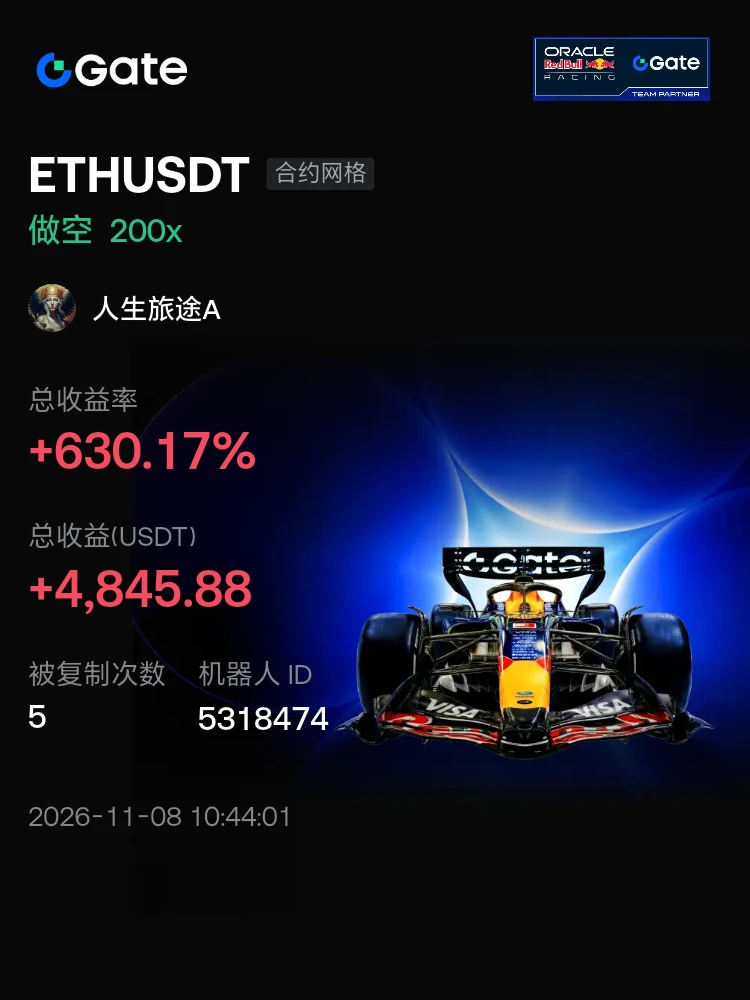
#交易机器人 I'm using the ETHUSDT contract grid bot on Gate—come copy my trades
post-image
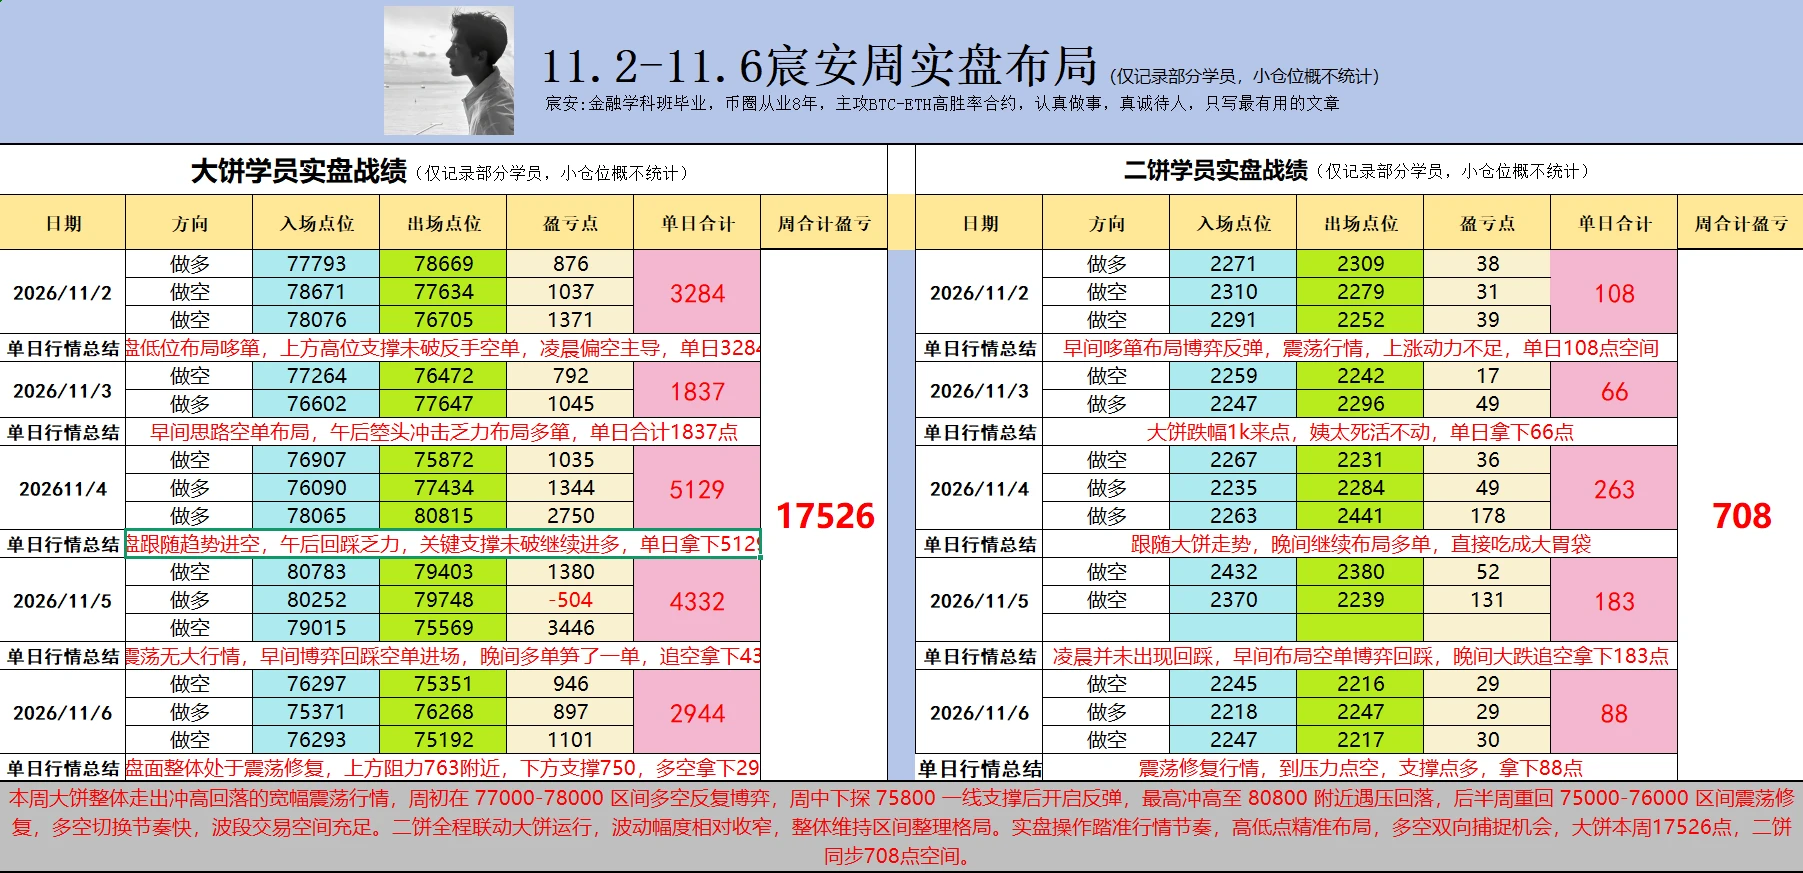
This week’s Bitcoin market action has officially wrapped up, with a wide-ranging move that first fell, then rose, and then pulled back. The battle between bulls and bears was fierce, and shifts in momentum far exceeded expectations.

  At the start of the week, bulls and bears repeatedly tussled around the 77k mark as market divisions continued to deepen. Then bearish pressure was unleashed in a concentrated burst, and the price quickly plunged to around 75,700 before finding support and stabilizing. Midweek, buying sentiment picked up, and the price launched a strong rally, climbing all the w
post-image
BTC-0.65%
ETH-1.23%
A brief analysis of BTC short-term trends from Dow Theory, Chan Theory, Elliott Wave Theory, volume-price relationships, order flow, and price action (strategy recommendations)
Comprehensive assessment
Dow Theory confirms that the break below 75,000 has accelerated the bearish trend + volume is contracting as the market consolidates
Chan Theory: Each stroke makes a new low; the 75,460 potential bottom fractal is unreliable due to low volume
Elliott Wave Theory: Subwave ③ of Wave C's fifth wave is nearly complete (74,791 is just 31 points above the 1.0× target); a subwave ④ rebound could begin
BTC-0.67%
📄 Decree 5,460: Less paperwork to export, more foreign currency flowing into P2P?
The Executive Branch repealed 37 administrative acts—permits, tariff codes, and guidelines—that had been hindering exports of fish, coffee, and cocoa. The regulation, published in Official Gazette 43,268 on November 5, 2026, has 36 articles and two final provisions and will remain in effect through December 31, 2026. It also ordered that no requirements, registrations, or authorizations not published in the Official Gazette may be required.
🔹 The hard numbers
• 37 administrative acts repealed (permits, tariff c
post-image
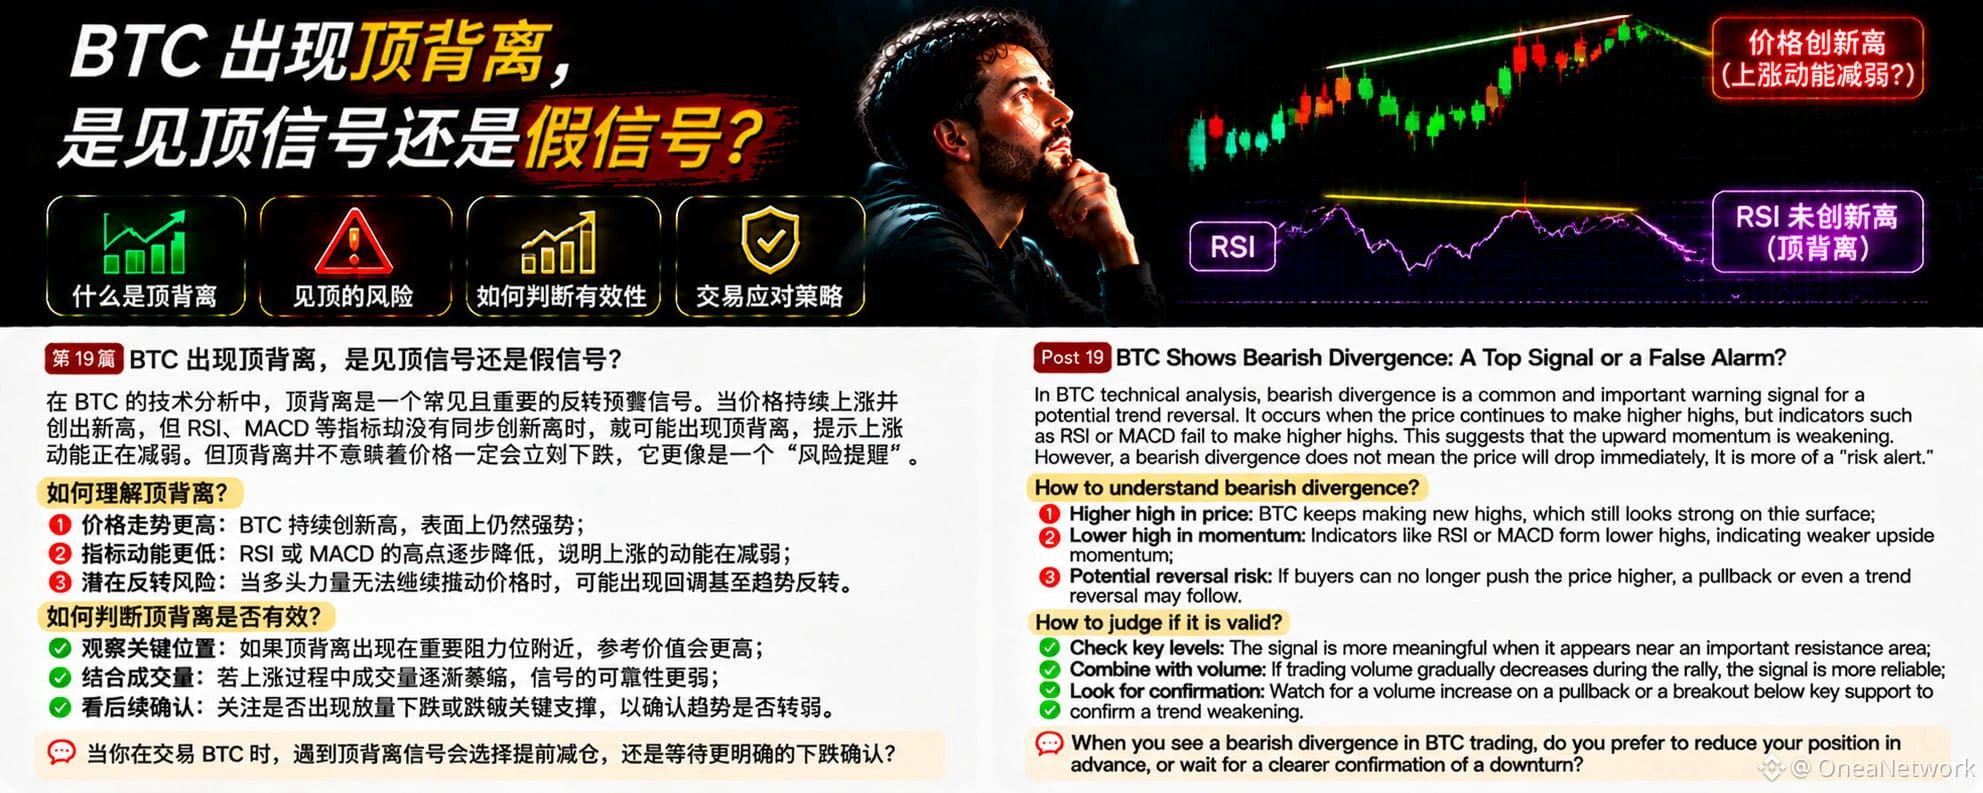
In BTC technical analysis, bearish divergence is a risk warning signal worth watching. Many traders see prices continually making new highs and assume the uptrend remains strong. But if prices continue to rise while indicators such as RSI or MACD fail to make new highs, bearish divergence may occur.
What is bearish divergence?
Simply put, it is when the price makes a higher high, but the technical indicator forms a lower high. This suggests that although the price is still rising, the momentum driving the rise may be weakening.
Why is bearish divergence worth watching?
First, upward momentum m
post-image
BTC-0.67%
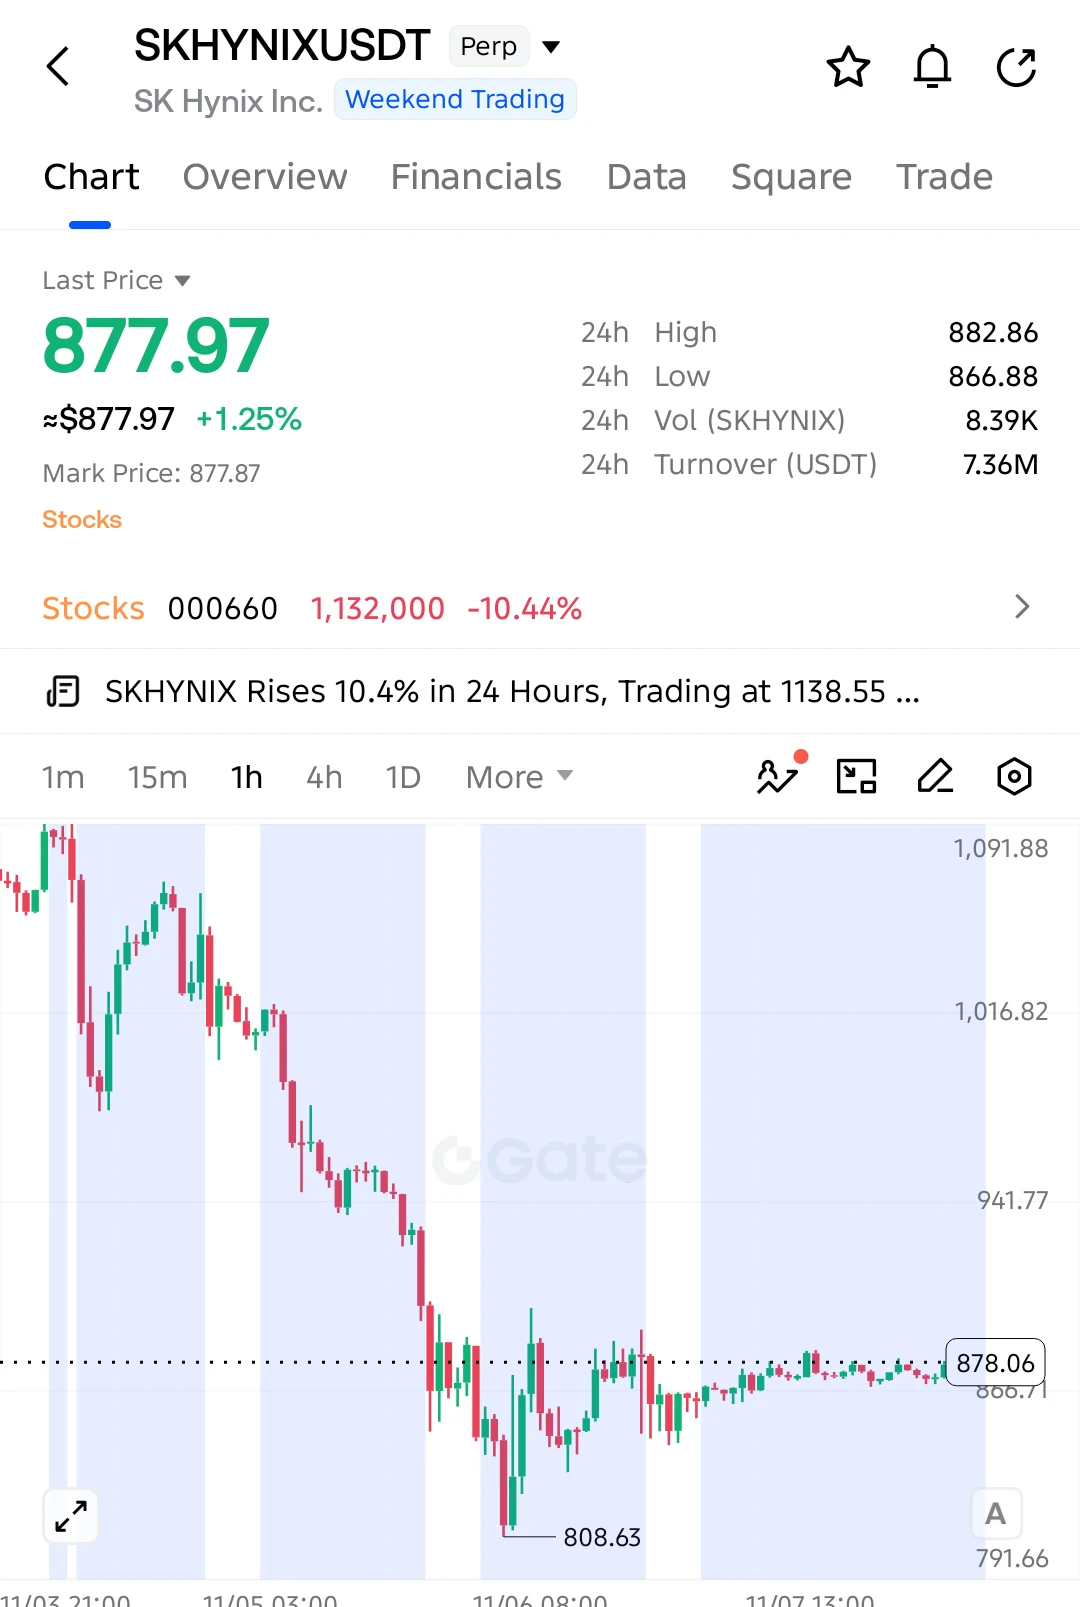
$SKHYNIX LONG SETUP — BIG RECOVERY AHEAD?

$SKHYNIX is showing signs of stabilization after a massive sell-off. Buyers are defending the 866 support area, with a potential recovery developing!

Entry: 877.97
SL: 865.00

TP1: 892.50
TP2: 905.00
TP3: 920.00
Final Target: 938.86

Selling pressure has eased as price consolidates near 878. Buyers are gradually rebuilding strength, and a breakout above 882.86 could open the door toward 905 and higher.

Invalidation: A sustained break below 865.00 weakens the bullish setup.

Keep your eyes on $SKHYNIX!
post-image
SKHYNIX+1.41%
$UAI is showing significant volatility, with the latest market snapshot indicating heavy selling pressure. The liquidation around $0.07784 highlights an important downside reference, while the current recovery area needs confirmation before considering a bullish reversal. A sustained reclaim of resistance could signal that buyers are regaining control.
Support: $0.1150 – $0.1200
Resistance: $0.1300 – $0.1360
Next Target: $0.1450 – $0.1550
Bullish Confirmation: Holding above $0.1200 and reclaiming $0.1360 could strengthen recovery momentum. A rejection may bring another liquidity sweep toward
post-image
UAI-7.58%
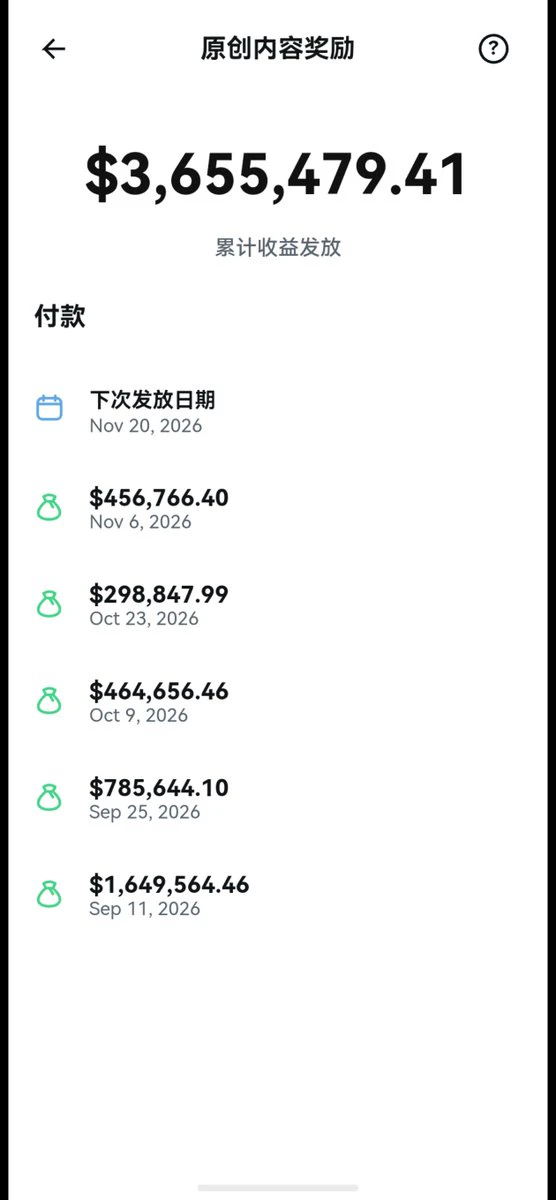
Revealing X creator earnings
I'm freaking shocked
post-image
Load More

Join 40 M users in our growing community

⚡️ Join 40 M users in the crypto craze discussion

💬 Engage with your favorite top creators

👍 See what interests you

Trending Topics

USCPIDataIncoming

188 Views1.47k Discussing

The U.S. October CPI report will be released on November 10 at 8:30 a.m. ET. September CPI came in at 3.7% year over year, and markets will be watching closely for signs that inflation is cooling, especially in core CPI. A softer-than-expected reading could strengthen rate-cut expectations, while hotter inflation may pressure risk assets through higher Treasury yields and a stronger dollar. How do you think this CPI print will move $BTC, U.S. stocks and gold?

USAIStocksHitHard

23.2k Views3.69k Discussing

USNonfarmPayrolls

39.23k Views4.38k Discussing

View More