Square
Following
Hot
News
Notifications
Profile
Share your thoughts
placeholder
Article
#美股史诗级抛售 #每周来晒
🤖 The Generative Pivot: Rotating Capital from Silicon Infrastructure to Software Commercialization

The architectural paradigm of the artificial intelligence supercycle is undergoing a monumental phase transition. Following an aggressive, multi-billion-dollar deleveraging event across hardware, foundry, and computational data-center stocks, public equity markets are executing a highly coordinated capital rotation. The foundational layer of the trade is fundamentally shifting: the market is moving rapidly away from tracking who is spending the most on raw computing power to scr
Falcon_Official
#USAIStocksHitHard NAS100 5M: Bulls Are Regaining Control – Key Demand Zone in Focus

NAS100 is showing encouraging bullish momentum on the 5-minute timeframe after sweeping sell-side liquidity (SSL) and reclaiming an important support area.

This price action suggests buyers are stepping back into the market. However, the next move will depend on how price reacts around the demand zone.

Key Levels to Watch:

- Equilibrium: 26,670
- OTE Zone: 26,513
- Bullish Order Block: 26,448
- Demand Zone: 26,513 – 26,448
- Liquidity Target: 27,054

Bullish Outlook

I'm watching for a controlled pullback into the 26,513–26,448 zone. If buyers defend this area and bullish confirmation develops, NAS100 could gain enough momentum to target the 27,054 liquidity level.

What Could Invalidate the Setup?

A strong move below the demand zone would weaken the bullish structure and require a fresh assessment of market conditions.

For now, there is no need to chase price. Let the market return to the planned zone, observe the reaction, and wait for confirmation before considering a long position.

Patience and discipline matter more than catching every move.

What are you watching on NAS100 — another bullish leg or a deeper pullback?

#USStocksFaceHistoricSelloff #GateLaunchesPoSECProofOfSecurity #GateGuardNowAvailableForFree #ShareWeekly $NAS100
GOOGL+0.72%
MSFT-0.95%
AMZN-0.44%
PLTR+3.57%
ORCL+0.84%
  • 3
$UAI Brutal plunge! Buyers who entered at the top are trapped. After setting an all-time high of 0.8413, UAI took a sharp hit, plunging to 0.0808. It is down as much as 90%, with the current price more than 10 times below its peak! The chart says it all: heavy selling pressure, steadily lower highs, and a completely broken bullish structure. Those who bought at the top are now facing steep losses, while a 43% drop over the past 24 hours shows that sellers remain firmly in control. A painful reminder that chasing a rally at the top can turn into a nightmare. UAI bulls are in serious trouble. $
post-image
UAI-7.58%
Trenches
ZIG
Z
bade
b
ZIG
0x8c...1145
Market Cap
$.
Change
.
24h Vol
$.
Holders
.
STONK
S
bade
b
STONK
6GmA...UNgx
Market Cap
$.
Change
.
24h Vol
$.
Holders
.
IDOL
I
bade
b
IDOL
0x3b...ab07
Market Cap
$.
Change
.
24h Vol
$.
Holders
.
BTC
B
bade
b
BTC
C5xp...pump
Market Cap
$.
Change
.
24h Vol
$.
Holders
.
FLOAT
F
bade
b
FLOAT
Bv1a...BMmr
Market Cap
$.
Change
.
24h Vol
$.
Holders
.
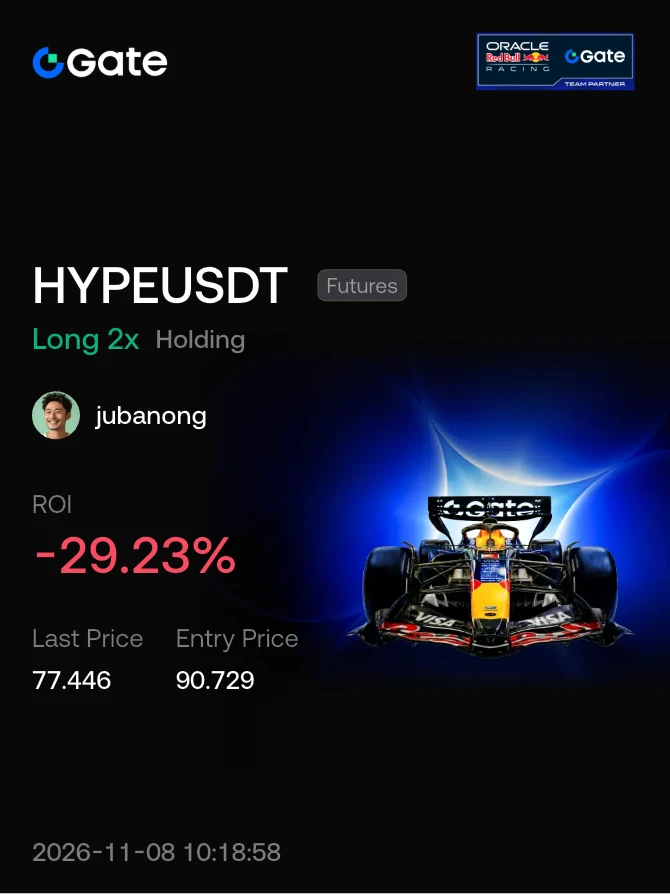
$DUSK Now aggressively shorting, then buying at $-0.02551; short entry price 0.07062 $DUSK 👇
post-image
DUSK+5.54%
post-image
HYPE+0.33%
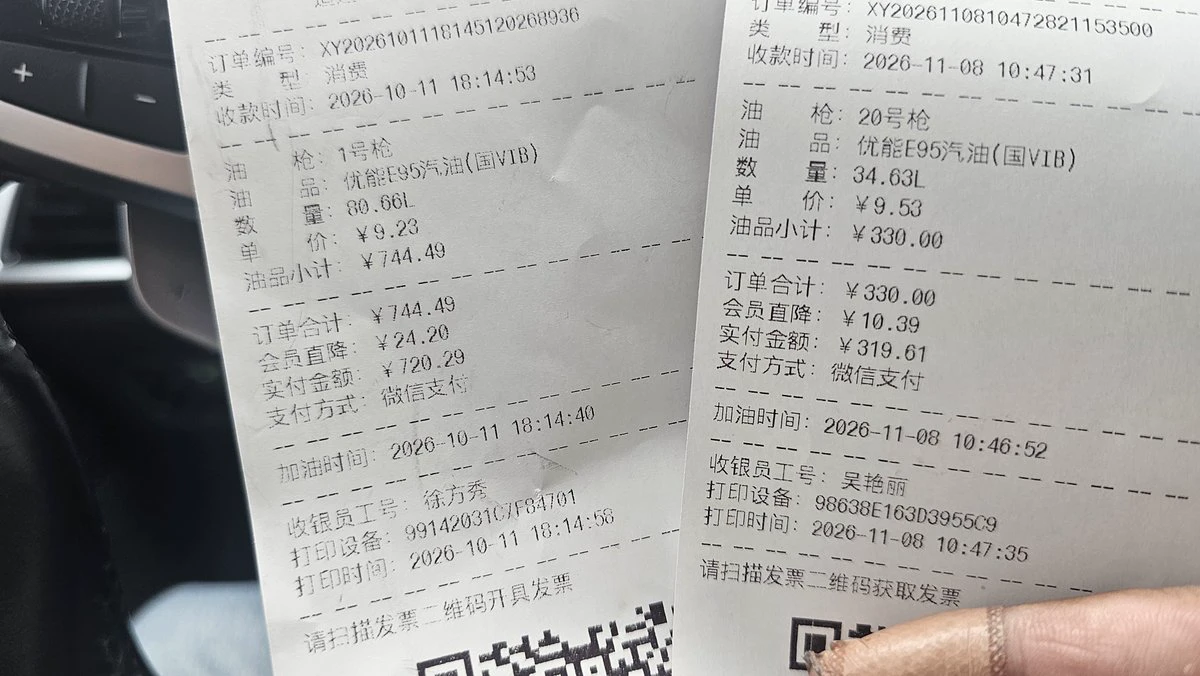
A month ago, international oil prices were the same, but domestic consumer prices were different.
Just looking at the impact on ordinary consumers, I’d also vote against Trump.
post-image
#GateSocialAnnualStreamerAndCreatorAwards #ShareWeekly
Gate Social Annual Streamer and Creator Awards: Celebrating Community Excellence
Introduction
The Gate Social Annual Streamer and Creator Awards represent an exciting opportunity to celebrate creativity, dedication, and outstanding contributions across the Gate community. As digital communities continue to grow, content creators and livestreamers play an essential role in connecting users, sharing knowledge, and making the crypto ecosystem more engaging.
This annual celebration recognizes the individuals who consistently contribute valuab
post-image
Can you imagine?
This is your boss’s eldest son.
He knew how it started, but not how it would end.
⛽ Dragon and Loran Gas: What the Agreement with Trinidad Means for P2P
Trinidad and Tobago is confident that OFAC licenses for the Dragon and Loran gas fields will remain in effect despite the election-related noise in Washington. Prime Minister Kamla Persad-Bissessar said her government will continue working with the United States to keep the licenses in effect. For Venezuela, every phase of gas development that moves forward also affects foreign currency flows, exchange-rate expectations, and sentiment in the USDT market.
🔹 The hard facts
• Dragon: 4.2 trillion cubic feet of gas, about 40 k
post-image
CVX-0.14%
SHEL-1.02%
$IDOL recorded a $5.14K short liquidation around $0.03178, suggesting buyers are starting to pressure short positions. If price maintains its demand zone, another push higher could target liquidity resting above recent swing highs. Watch for a clean breakout supported by volume.
Support: $0.0305 – $0.0295
Resistance: $0.0325 – $0.0340
Next Target: $0.0360
Confirmation: Holding above $0.0325 could strengthen bullish momentum and open the door to a short squeeze.
Let's go $IDOL 🚀
post-image
IDOL-6.71%
In the early hours of November 8, Yu Zheng posted a video late at night addressing Li Na: “Forgive Xu Fei.” In the caption, he said he was “shipping them like crazy” while watching “After We Meet Again.” When a netizen asked whether he had really sent it to Li Na, Yu Zheng replied, “She saw it and replied.” The topic shot straight to No. 1 on the entertainment charts, with its popularity exceeding 1.33 million.
The feud between the two dates back to Super Girl in 2006. Li Na said she had only told her friend Xu Fei about her plan to terminate her contract, but the news reached the company, and
post-image
Market update
live-cover
LIVE2,033
#Gate股票畅聊季 #美股财报季 What’s next for U.S. stocks?

Global market risks are building, and core AI assets may face a repricing of volatility. U.S. stocks have undergone a round of risk unwinding, so what comes next for the market?

The sharp swings in U.S. stocks recently reflect a shift in the market’s focus: investors are watching AI revenue growth while also asking when massive investments will translate into profits and cash flow. As of November 6, Eastern time, I’m more inclined to characterize the current market as being in a high-volatility correction phase, with room for a short-term reboun
NAS100-0.07%
AMZN-0.44%
MSFT-0.95%
AMD+11.55%
INTC+8.00%
  • 4
When BTC Moves Sideways, How Can You Determine Its Next Direction?

In the cryptocurrency market, sideways price action is often more frustrating for traders than a one-way rally or decline. Prices fluctuate repeatedly within a range, making it look like there are plenty of opportunities, but few people can actually capitalize on them. Some keep going long, while others repeatedly go short, only to find that fees and frequent stop-losses keep eating away at their accounts.

So, how should you determine BTC’s next move while it’s trading sideways?

First, watch for changes in trading volume. If
post-image
BTC-0.67%
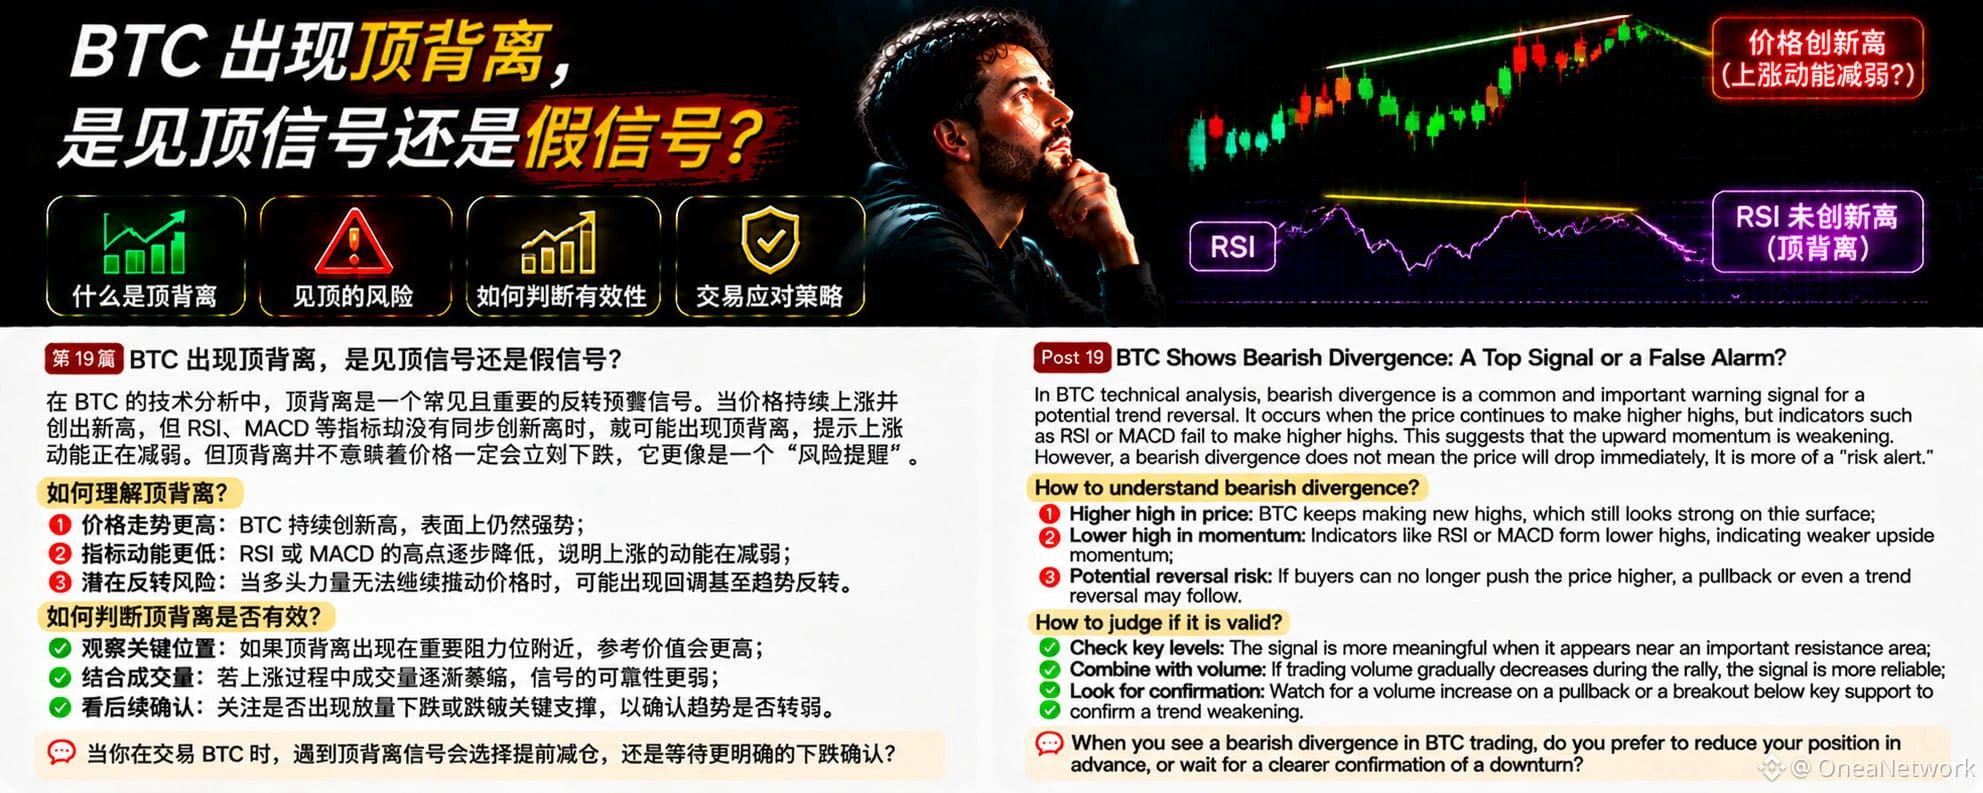
In BTC technical analysis, bearish divergence is a risk warning signal worth watching. Many traders see prices continually making new highs and assume the uptrend remains strong. But if prices continue to rise while indicators such as RSI or MACD fail to make new highs, bearish divergence may occur.
What is bearish divergence?
Simply put, it is when the price makes a higher high, but the technical indicator forms a lower high. This suggests that although the price is still rising, the momentum driving the rise may be weakening.
Why is bearish divergence worth watching?
First, upward momentum m
post-image
BTC-0.67%
Many traders expect a price pullback after BTC rises, hoping to get a better entry. But a retest is not always an opportunity; sometimes it can also signal that a downtrend is resuming. The key is to determine whether support is holding and whether the overall market trend remains healthy.
First, assess the strength of support. If a price area has repeatedly seen rebounds in the past, it may indicate strong buying demand there. When the price returns to this area, watch closely to see whether buyers step in again.
Second, watch for changes in trading volume. If volume gradually declines as the
BTC-0.67%
Apparently, this is the fifth-generation housing currently being piloted in China.
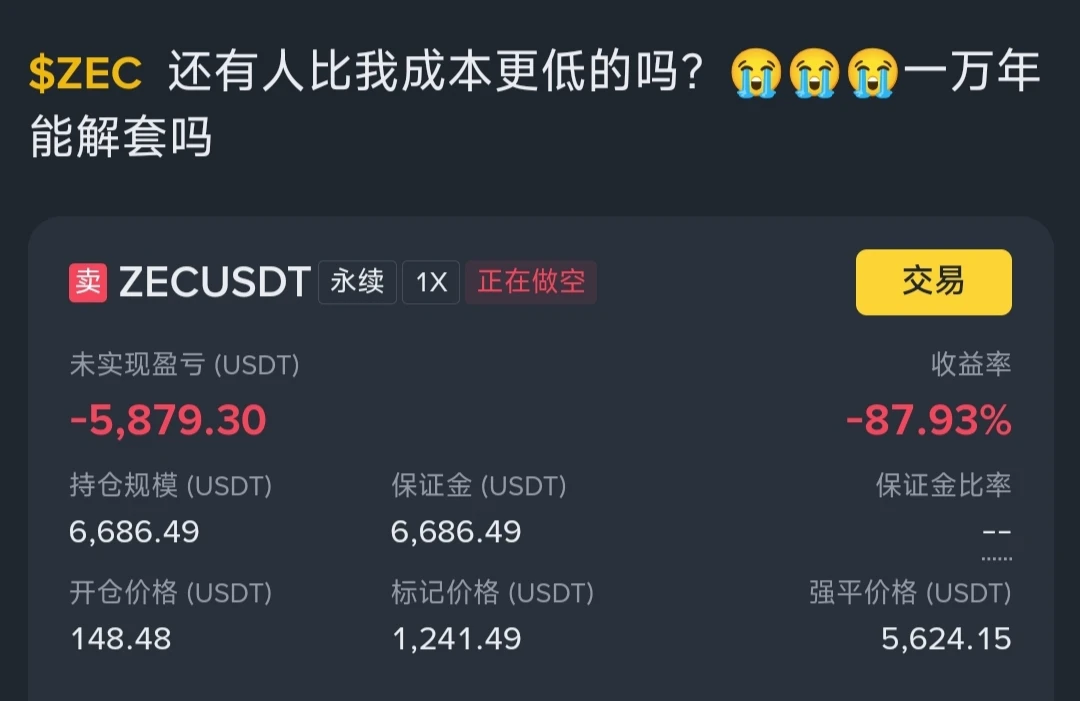
$ZEC The thing I find most curious about this coin is that no matter when you short it, you can always find someone who shorted at a lower price than you!#$ZEC ‌# ‌
post-image
ZEC+1.29%
  • 3
𝗘𝗧𝗛𝗘𝗥𝗘𝗨𝗠 ⚡ | 𝗣𝗥𝗜𝗖𝗘 𝗦𝗧𝗔𝗕𝗜𝗟𝗜𝗭𝗘𝗦 𝗡𝗘𝗔𝗥 $𝟮,𝟮𝟯𝟳

💰 Price: $2,236.92
₿ BTC Value: 0.02953 BTC

📊 Market Performance

- 1H Change: +0.24%
- 24H Change: +0.07%
- 7D Change: -0.70%

🏦 Market Cap: $273.34B
📈 24H Volume: $3.89B

Supply Details

- Circulating Supply: 122.19M ETH
- Total Supply: 122.19M ETH

Ethereum is showing slight positive movement over the past 24 hours, but its weekly performance remains marginally negative.

Trading activity remains important to watch. $ETH needs stronger buying momentum to establish a clearer recovery trend.

For now, the market i
post-image
ETH-0.91%
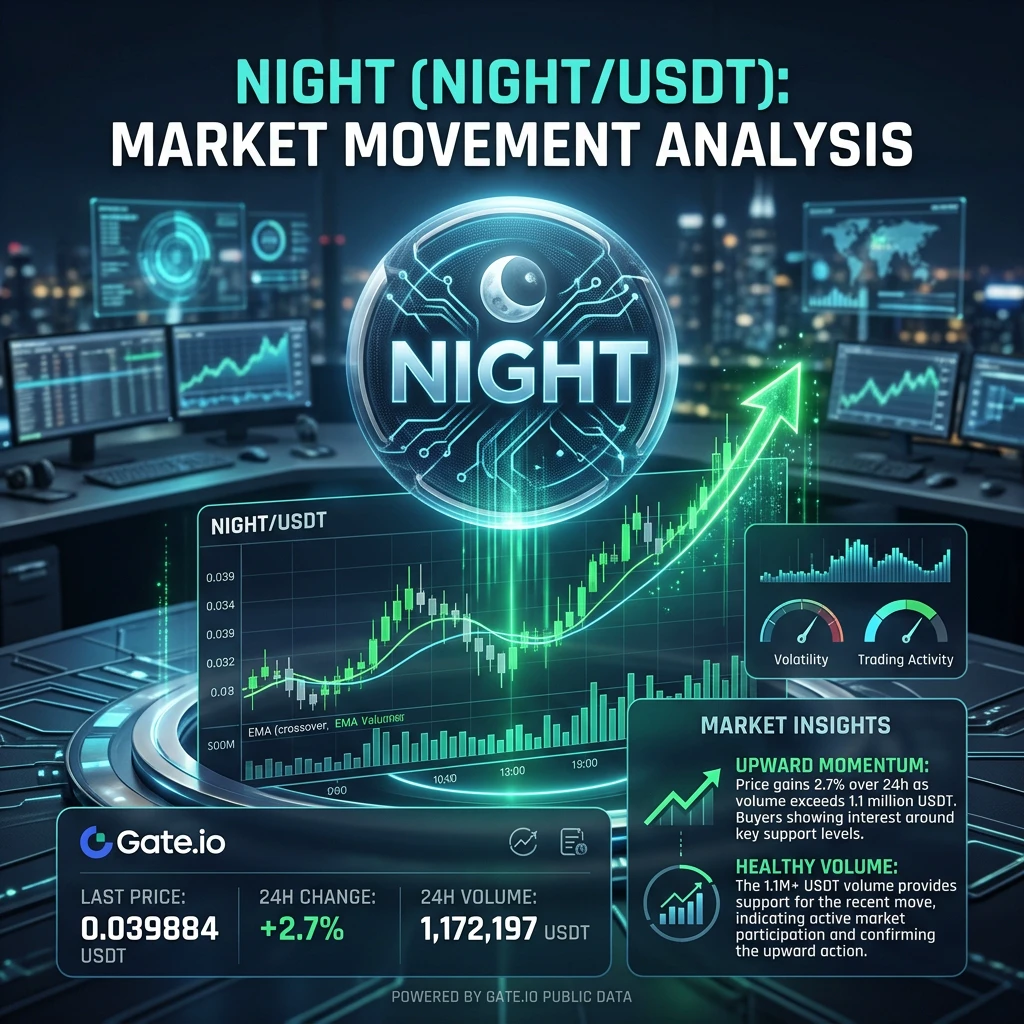
#NIGHT

NIGHT Edges Higher: A Beginner’s Guide to Its Price Movement and Midnight Network Developments

A Common Myth

A common mistake in crypto is thinking that whenever a coin rises, its project must be growing rapidly. Price movement alone cannot prove that. A market can move higher because of short-term buying interest, changing sentiment, new developments, or temporary trading activity. NIGHT’s latest movement is a useful example of why understanding the numbers matters more than simply watching the price.

The Latest Numbers

At 01:30 UTC on November 8, 2026, NIGHT/USDT was trading at
post-image
NIGHT-3.10%
  • 1
market prices updates
live-cover
LIVE1,271
Load More

Join 40 M users in our growing community

⚡️ Join 40 M users in the crypto craze discussion

💬 Engage with your favorite top creators

👍 See what interests you

Trending Topics

USCPIDataIncoming

1.04k Views1.47k Discussing

The U.S. October CPI report will be released on November 10 at 8:30 a.m. ET. September CPI came in at 3.7% year over year, and markets will be watching closely for signs that inflation is cooling, especially in core CPI. A softer-than-expected reading could strengthen rate-cut expectations, while hotter inflation may pressure risk assets through higher Treasury yields and a stronger dollar. How do you think this CPI print will move $BTC, U.S. stocks and gold?

USAIStocksHitHard

23.56k Views3.69k Discussing

USNonfarmPayrolls

40.34k Views4.38k Discussing

View More