Square
Following
Hot
News
Notifications
Profile
Share your thoughts
placeholder
Article
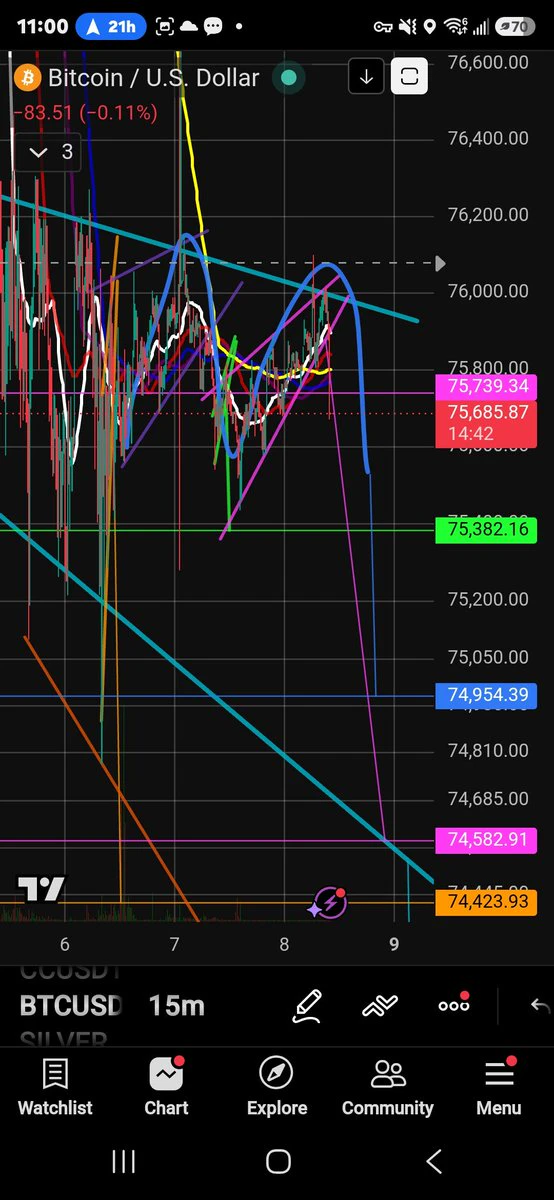
$BTC Breaking Downwards Fron The Pink Rising Wedge As Projected
Yes the chart is definitely messy. I understand. 💯
All of the patterns and measured moves play a role in price action.
I used to constantly clean the charts. Then I started to let it go.
This is when I realized how connected it all really is!
Nothing is ever financial advice.
I look at thing different than most.
My Goal Is To Learn And Teach The Symbiotic Nature Of The Charts.
#BTC #Crypto #Trading
post-image
BTC-0.67%
From 100,000 to 1 million takes three stages, and each stage has a completely different task
Many people treat these three stages as one, using the same approach from start to finish.
That’s why they blow up along the way.
Stage One: 100,000 → 200,000 (double)
The task at this stage isn’t to make money, but to prove “I have a method.”
Risk 1% per trade
Trade just 1 asset and 1 setup
Frequency: no more than 3 trades a week
Goal: double your account within a year, with a drawdown of no more than 20%
The biggest pitfall at this stage is “making money too fast.”
If you double your account in just
post-image
BTC-0.65%
Trenches
ZIG
Z
bade
b
ZIG
0x8c...1145
Market Cap
$.
Change
.
24h Vol
$.
Holders
.
STONK
S
bade
b
STONK
6GmA...UNgx
Market Cap
$.
Change
.
24h Vol
$.
Holders
.
CLAUDIA
C
bade
b
CLAUDIA
2j5S...W2ZM
Market Cap
$.
Change
.
24h Vol
$.
Holders
.
BTC
B
bade
b
BTC
C5xp...pump
Market Cap
$.
Change
.
24h Vol
$.
Holders
.
FLOAT
F
bade
b
FLOAT
Bv1a...BMmr
Market Cap
$.
Change
.
24h Vol
$.
Holders
.
CRYPTO MARKET UPDATES
live-cover
LIVE736
Gold fell from 4,106 to 4,029, but is still up 5% this week—who’s buying, and who’s selling?

Gold’s moves on NFP night were far more interesting than the number itself. Before the data came out, gold was around 4,106, having touched a weekly high of 4,146. After the 165,000 print, spot gold plunged to 4,029.82, dropping nearly $60 and briefly falling more than 1%. Spot gold closed around 4,074, while futures fell $38.6, or 0.94%. On the chart, it was a solid down day.

But look at the weekly chart, and gold is up more than 5% this week, its best weekly performance since August. In other words
BTC-0.65%
The U.S. has gone 62 months without the unemployment rate topping 5%. Sounds impressive, but that’s all in the rearview mirror. When hiring starts to slow, this record won’t stop it. Recession signals have never been about who holds on the longest—they’re about the turn. I’m watching initial jobless claims and hours worked. Maybe I’m wrong; I’ll wait to be proven wrong.
post-image
$ERA $ERA Short entry: 0.07710 Stop-loss: 0.07902 Take-profit 1: 0.07600 Take-profit 2: 0.07400 Take-profit 3: 0.07311
post-image
ERA+24.21%
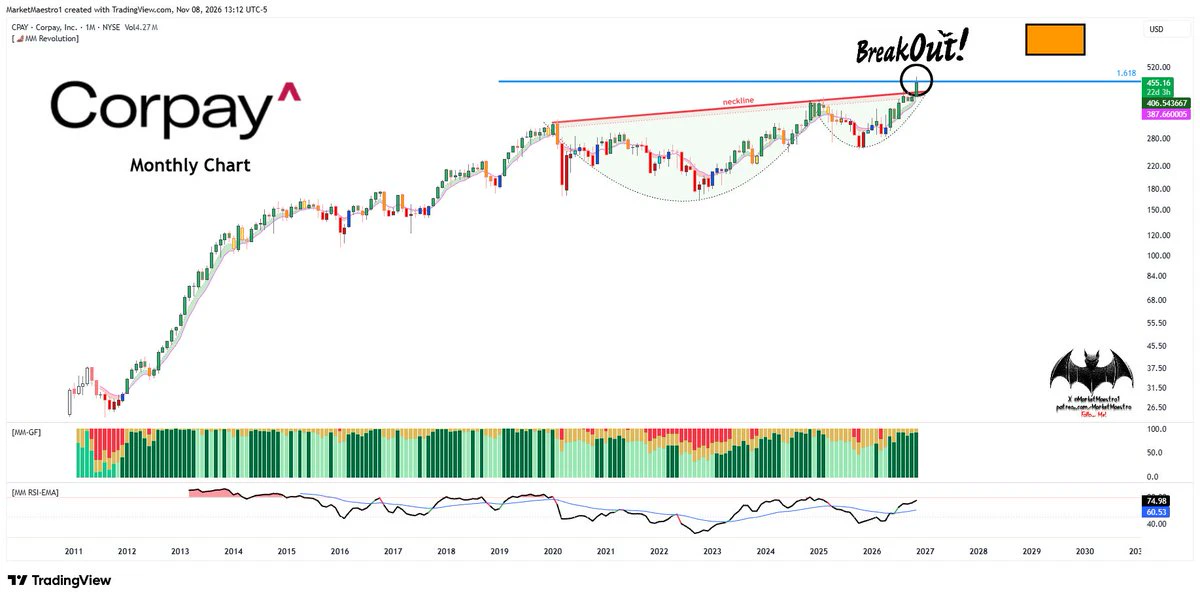
$CPAY
We haven’t seen bullish setups like this in a long time. It reached a key resistance level but broke out 💥 of its cup+handle pattern
post-image
CPAY+1.98%
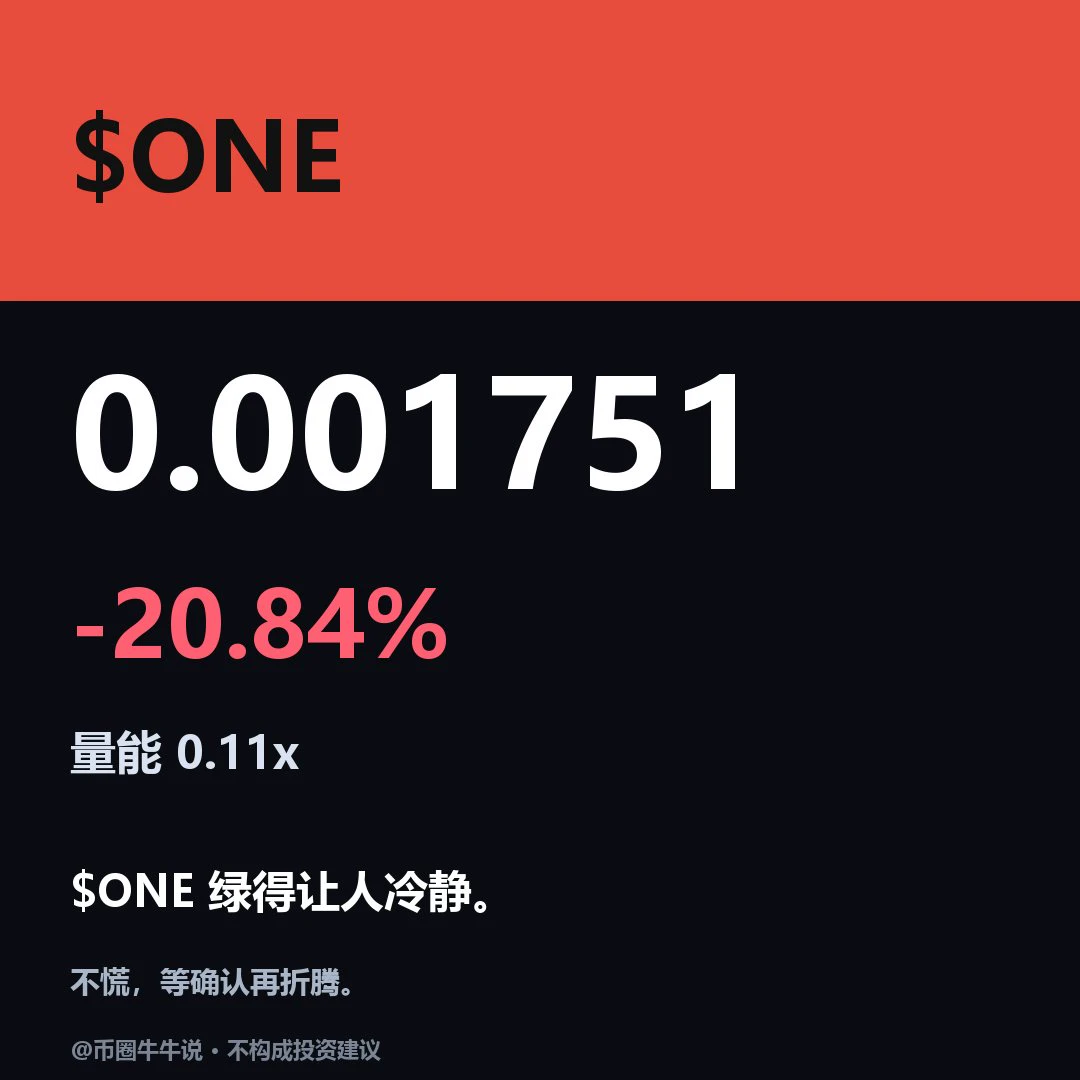
$ONE Current price 0.001751, 24H -20.84% (0.001692–0.00243). 1H is weak: RSI 45.59/EMA20 0.001934, support 0.001692/resistance 0.00243; 4H is stronger: RSI 57.69/EMA20 0.00173, support 0.001027/resistance 0.002476. Upside condition: hold above the 0.00243 resistance level. Downside condition: break below the 0.001692 support level. Review whether 0.00243 can hold and whether price can recover after losing 0.001692; volume ratio is 0.108x, and the setup is invalid without confirmation of participation. Market volatility is high; for observation only.
post-image
Zcash’s New Security Fund Is 99.7% Old Money
Zcash’s new reserve for future block rewards is still overwhelmingly inherited value. About 99.7% of its balance in an early post-NU7 mainnet observation on November 7, 2026, came from previously unclaimed subsidy and fees, leaving just 1.12 ZEC accumulated under the new rules.
At 05:08:38 UTC, the mainnet API for Zakura’s NU7 monitoring dashboard reported a Network Sustainability Mechanism, or NSM, balance of 369.7 ZEC at block 3,547,068. Its status data showed NU7 active.
⚠️ Personal market analysis only. NFA — manage risk and DYOR.
Educational co
post-image
ZEC+1.16%
3. Chian Hao Technologies: Stellar Revenue Growth Signals AI Demand
Chian Hao Technologies reported Q3 revenue of NT$59.08 billion, up a massive 51.7% year-over-year. While the headline focuses on Chian Hao, the ticker tags show Nvidia (NVDA) up 2.80% and AMD up 11.55%.

The headline here is a proxy for the broader Asian semiconductor supply chain. Chian Hao Technologies is likely a key component supplier or manufacturing partner within the tech hardware ecosystem. A 51.7% year-over-year jump in revenue is extraordinary and is almost certainly driven by the insatiable global demand for AI serv
post-image
NVDA+2.80%
AMD+11.55%
Seriously $ETH ? You were holding the line just a minute ago. Watching you fail those moving averages is painful, but you seem intent on testing the floor again. Don't look at me like that.TP: 2,191.69SL: 2,270.37Market movers:
$ONE $ONE : Current Price 0.0017215 - 24h Change: -24.28%
$AIOT : Current Price 0.16956 - 24h Change: +42.86%
post-image
ONE-1.19%
AIOT-2.28%
The guy who turned four figures into eight figures had one ironclad rule: no opening trades after 10 p.m.
He wasn’t afraid of the market. He was afraid of himself.
He once said something that really stuck with me:
“Most people’s losses don’t happen in the market. They happen during the two hours when they’re at their worst.”
His method has four steps, and the first one isn’t even picking coins.
Step one: Decide “when I’m allowed to trade”
He trades only during one time window: 8 p.m. to 11 p.m.
The reason is simple:
That period has the best liquidity (the European and U.S. sessions overlap)
Th
post-image
MayBe humans never truly left the cave.
The cave simply grew larger.
post-image
Both parties want to make this election about Israel, but voters aren’t buying it. Only 4% of people rank foreign policy as their top issue, and Gaza ranks near the bottom in the polls. Politicians make a big show of it on camera, but when they get home, they’re still talking about gas prices and rent. I set my stop-loss too tight last time and got stopped out twice. I learned my lesson: admit when you’ve got the direction wrong, but don’t let the noise lead you astray. Maybe I’ve got it wrong again. Just waiting to get proven wrong. #U.S.Election
post-image
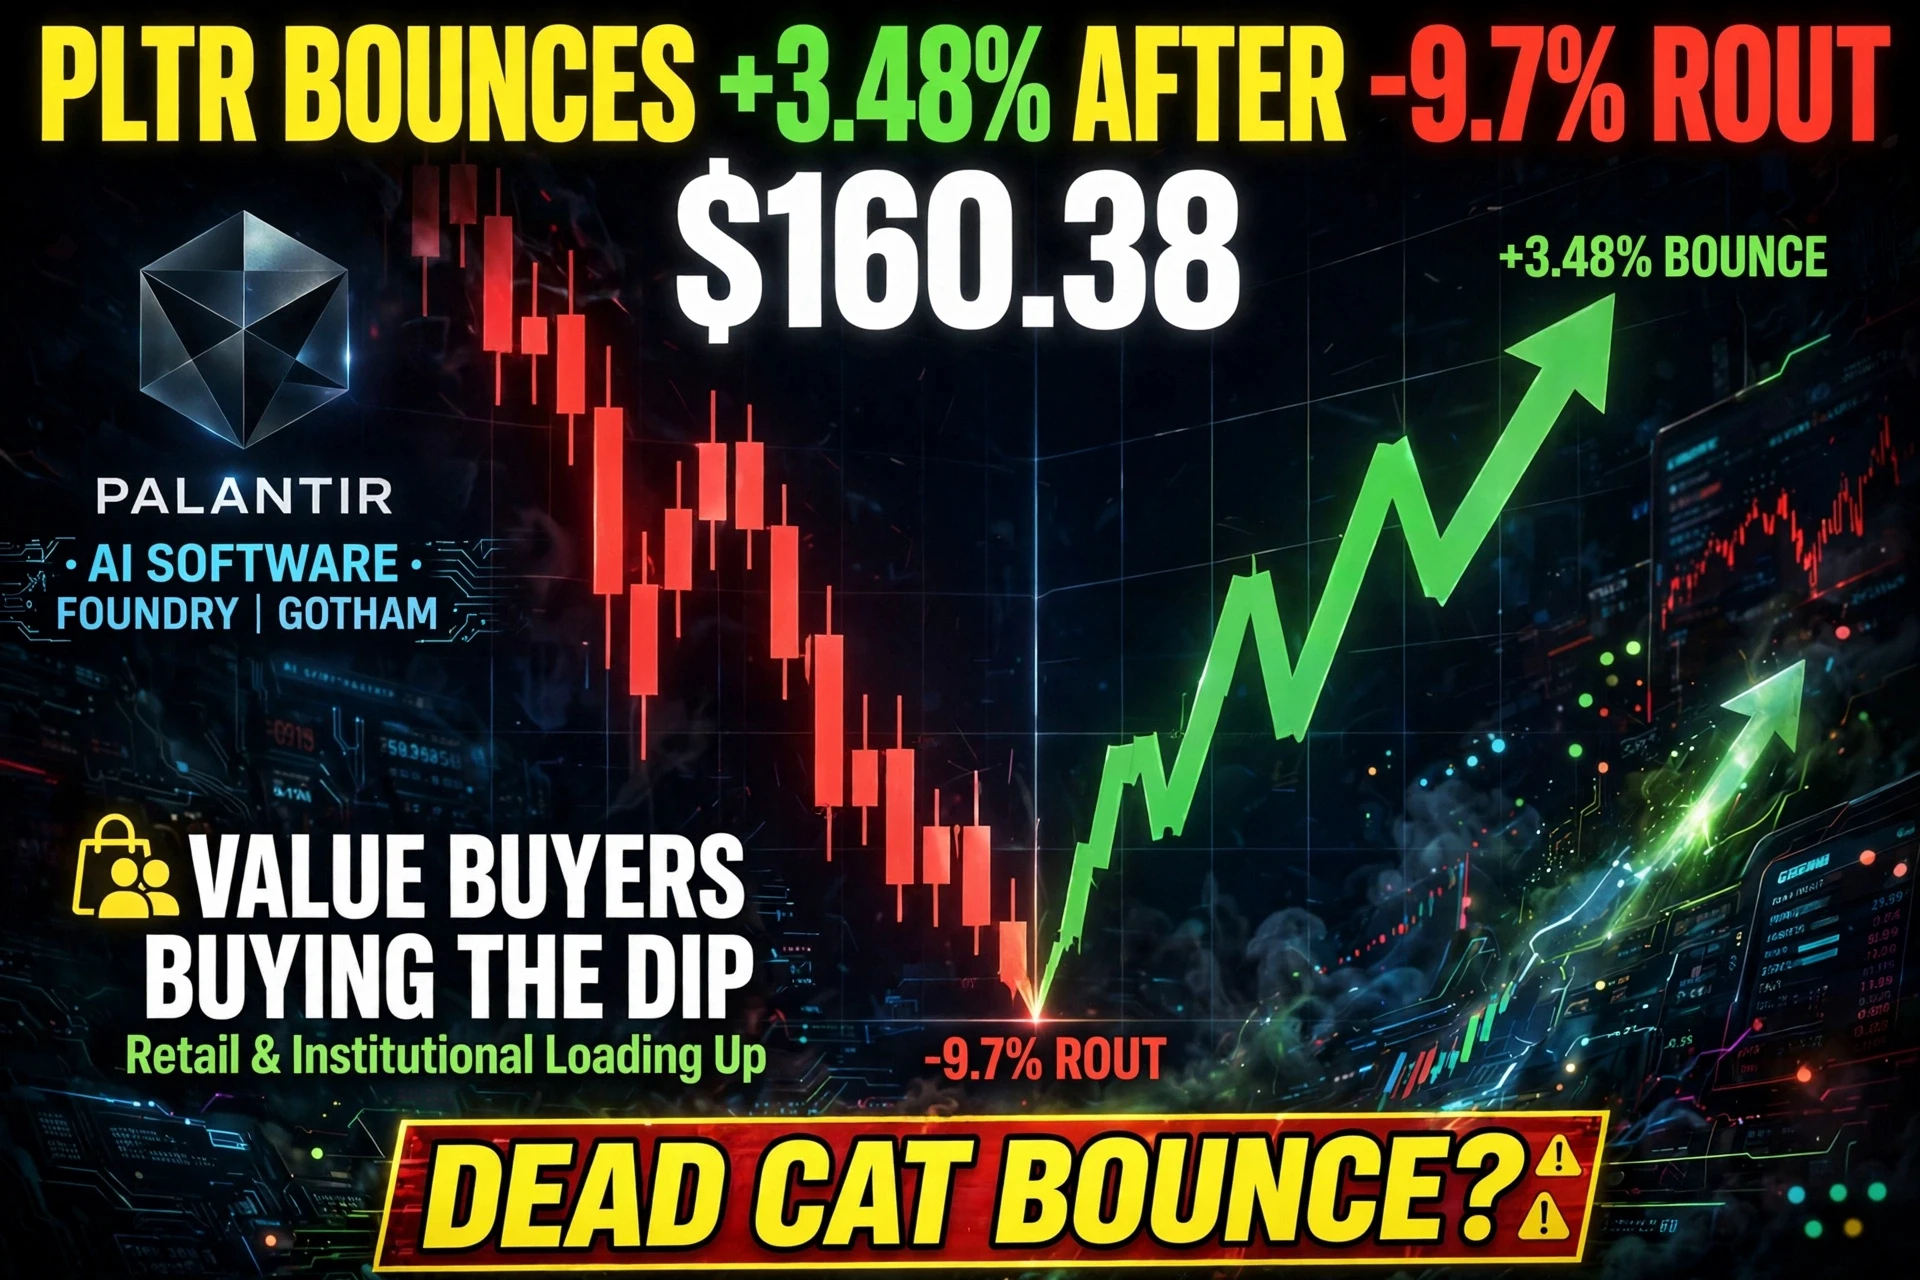
Palantir (PLTR): A Much-Needed Bounce After a Sharp Rout
Palantir bounced to $160.38 on Friday, rising 3.48% after suffering a 9.7% rout on Thursday. The ticker shows PLTR up 3.57%.
Palantir is often viewed as a bellwether for AI software and government contracting. The 9.7% drop on Thursday indicates a severe and sudden negative catalyst—likely disappointing earnings, a downgrade, or a broad sector sell-off that hit high-multiple tech stocks particularly hard. A 3.48% bounce the following day is a natural market reaction as value buyers step in to "buy the dip."

The critical question for in
post-image
PLTR+3.57%
  • 2
  • 1
$JCT BOOM💣 continues to rip higher, hitting take profit (SL is in profit). I’m re-entering here with a small position. The funding rate is positive, so everyone should manage position sizes carefully. A major recent lesson$IRYS $AKE shows that it could surge 2000%; a 1000% gain in a day is also possible. Stay disciplined to make money in the market, everyone💸💸🙈
post-image
JCT-3.26%
IRYS-22.27%
AKE+6.07%
CRYPTO MARKET UPDATES
live-cover
LIVE793
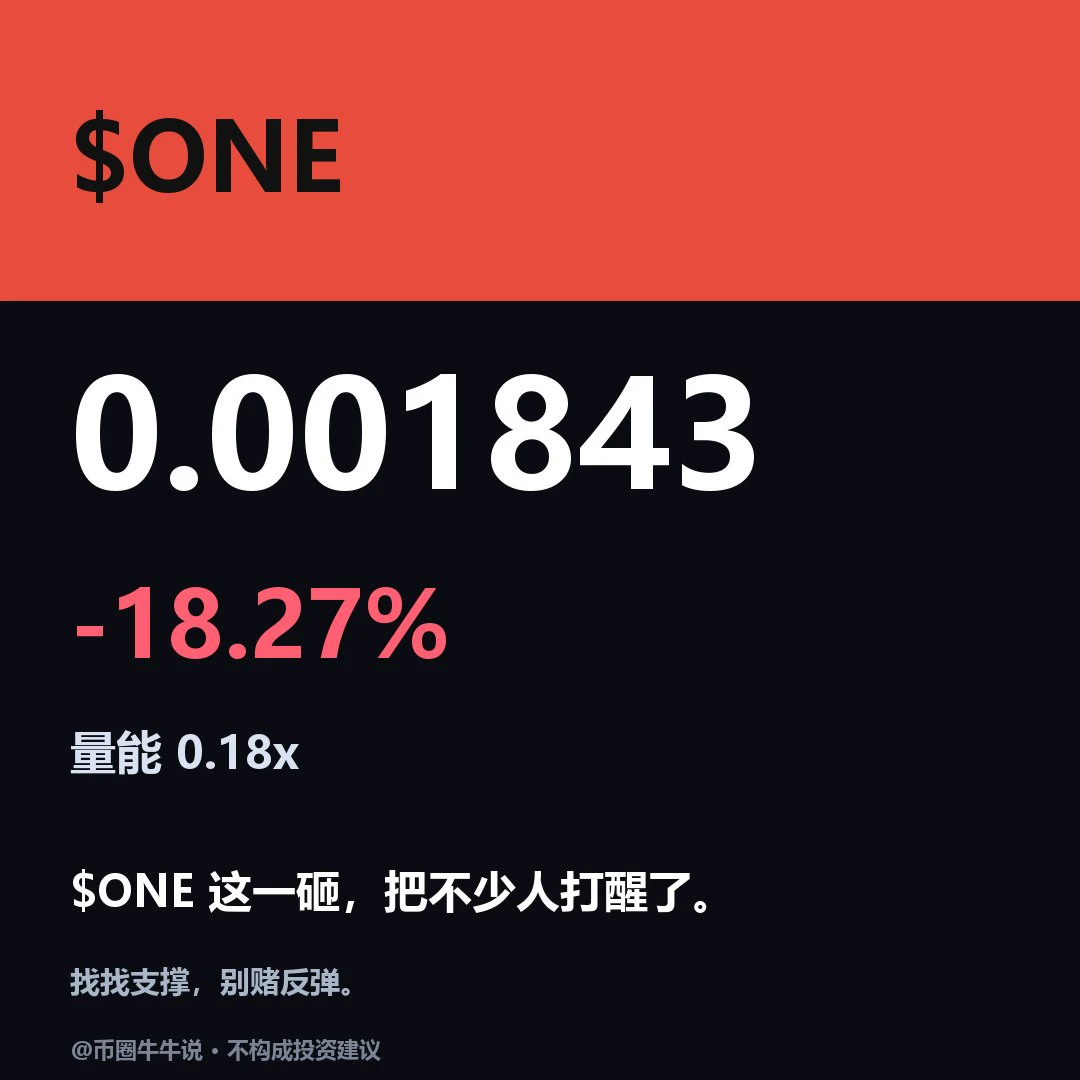
$ONE Current price: 0.001843, 24H -18.27% (0.001692–0.00243). 1H is weak: RSI 48.98/EMA20 0.00193, support at 0.001692/resistance at 0.00243; 4H is stronger: RSI 60.29/EMA20 0.001739, support at 0.001027/resistance at 0.002476. The upside condition is holding above the 0.00243 resistance level; the downside condition is breaking below the 0.001692 support level. Watch whether price can hold above 0.00243 and recover after losing 0.001692; the two timeframes still diverge, and short-term moves cannot be taken directly as a trend reversal; the volume ratio is 0.18x, and without volume confirmati
post-image
#晒出我的持仓收益 Temporarily opened, live now: Ether (ETH)
post-image
ETH-1.26%
I just came across a message and was completely stunned—is this actually true or not?
Let me make my stance clear first: I'm bullish, no hesitation.
$SOX $BNB $BTC I'm keeping an eye on all three of these assets.
I took a quick look at the trading ledger for the past 90 days, and the numbers speak for themselves: +1,500.08+66.06%
Now let's look at their short-term performance: $BNB +0.18%$BTC -0.17%$SOXL +0.24%
Let's set aside whether the news is true or not—positions and profits and losses don't lie. A 66% return over 90 days comes not from chasing news, but from holding steady and reading t
post-image
BTC-0.67%
Load More

Join 40 M users in our growing community

⚡️ Join 40 M users in the crypto craze discussion

💬 Engage with your favorite top creators

👍 See what interests you

Trending Topics

USCPIDataIncoming

13.55k Views1.64k Discussing

The U.S. October CPI report will be released on November 10 at 8:30 a.m. ET. September CPI came in at 3.7% year over year, and markets will be watching closely for signs that inflation is cooling, especially in core CPI. A softer-than-expected reading could strengthen rate-cut expectations, while hotter inflation may pressure risk assets through higher Treasury yields and a stronger dollar. How do you think this CPI print will move $BTC, U.S. stocks and gold?

USAIStocksHitHard

28.45k Views3.74k Discussing

USNonfarmPayrolls

54.47k Views4.49k Discussing

View More